10x Visium Discovery Hub
Explore the power of spatial biology
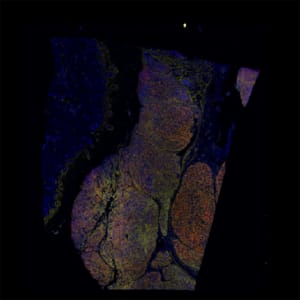
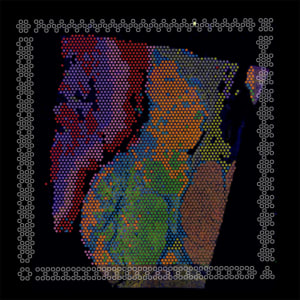
Access 10x Genomics-generated Visium datasets of formalin-fixed, paraffin-embedded tumor samples and experience the power of spatially resolved biology for yourself. Click on an organ below to explore its atlas of data.

Select your organ of interest
Select an organ below to view the Spatial Gene Expression Dataset

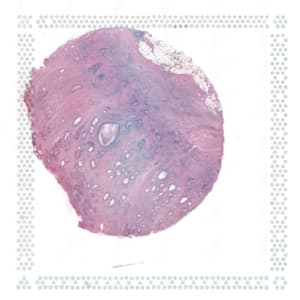
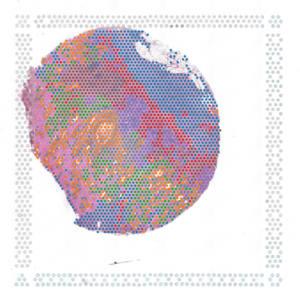
Human Breast Cancer
5 µm section from Ductal Carcinoma In Situ, Invasive Carcinoma
- Species
- Human
- Genes Detected
- 17651
- Capture Area
- 6.5 x 6.5 mm
- Spots Under Tissue
- 2518
- Chemistry
- Visium FFPE
- Mean Reads per Spot
- 32524
- Mean UMI Counts per Spot
- 14442
- Median Genes per Spot
- 5244
Spatial Gene Expression
Human Cervical Cancer
5 µm section from squamous cell carcinoma
- Species
- Human
- Genes Detected
- 17871
- Capture Area
- 6.5 x 6.5 mm
- Spots Under Tissue
- 2781
- Chemistry
- Visium FFPE
- Mean Reads per Spot
- 73046
- Mean UMI Counts per Spot
- 26050
- Median Genes per Spot
- 7276
Spatial Gene Expression
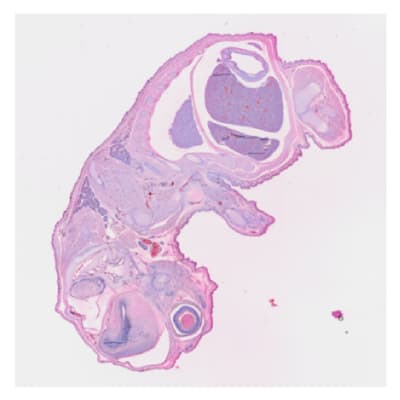
Mouse Melanoma
5 µm section of Mouse Embryo
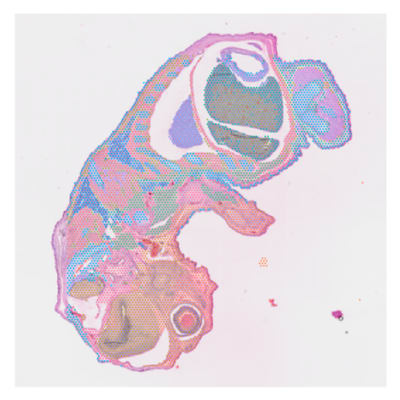
- Species
- Mouse
- Genes Detected
- 19404
- Capture Area
- 11 x 11 mm
- Spots Under Tissue
- 6443
- Chemistry
- CytAssist for FFPE
- Mean Reads per Spot
- 129162
- Mean UMI Counts per Spot
- 62780
- Median Genes per Spot
- 8843
Spatial Gene Expression
Human Intestine Cancer
5 µm section from Human Intestinal Colorectal Cancer
- Species
- Human
- Genes Detected
- 17579
- Capture Area
- 6.5 x 6.5 mm
- Spots Under Tissue
- 2660
- Chemistry
- Visium FFPE
- Mean Reads per Spot
- 77288
- Mean UMI Counts per Spot
- 25312
- Median Genes per Spot
- 7438
Spatial Gene Expression
Human Lung Cancer
5 µm section from Lung, Squamous Cell Carcinoma
- Species
- Human
- Genes Detected
- 18066
- Capture Area
- 6.5 x 6.5 mm
- Spots Under Tissue
- 3858
- Chemistry
- CytAssist for FFPE
- Mean Reads per Spot
- 35785
- Mean UMI Counts per Spot
- 13991
- Median Genes per Spot
- 6174
Spatial Gene Expression
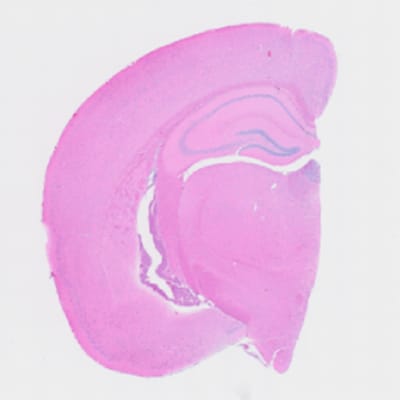
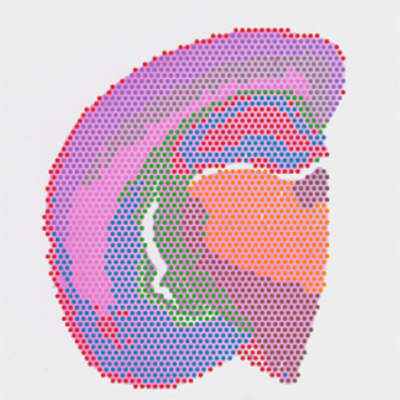
Mouse Brain
5 µm section of Mouse Brain
- Species
- Mouse
- Genes Detected
- 19352
- Capture Area
- 6.5 x 6.5 mm
- Spots Under Tissue
- 2310
- Chemistry
- CytAssist for FFPE
- Mean Reads per Spot
- 53497
- Mean UMI Counts per Spot
- 24862
- Median Genes per Spot
- 6736
Spatial Gene Expression
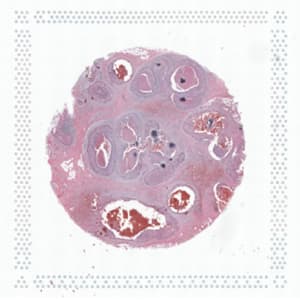
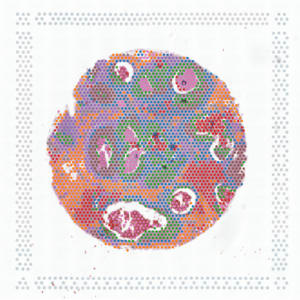
Human Ovarian Cancer
5 µm section from serous papillary carcinoma of human ovarian
- Species
- Human
- Genes Detected
- 17294
- Capture Area
- 6.5 x 6.5 mm
- Spots Under Tissue
- 3455
- Chemistry
- Visium FFPE
- Mean Reads per Spot
- 63836
- Mean UMI Counts per Spot
- 28927
- Median Genes per Spot
- 7621
Spatial Gene Expression
Human Prostate Cancer
5 µm section from Invasive Acinar Cell Carcinoma, Stage IV, Gleason score- 7
- Species
- Human
- Genes Detected
- 16907
- Capture Area
- 6.5 x 6.5 mm
- Spots Under Tissue
- 4371
- Chemistry
- Visium FFPE
- Mean Reads per Spot
- 23087
- Mean UMI Counts per Spot
- 13991
- Median Genes per Spot
- 5391
Spatial Gene Expression
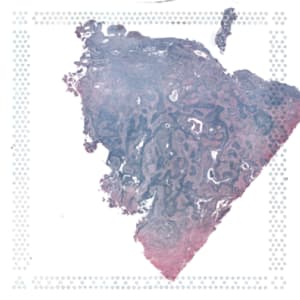
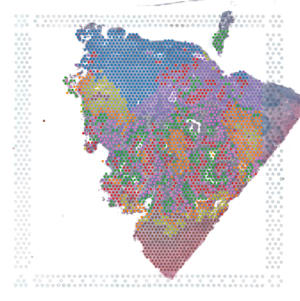
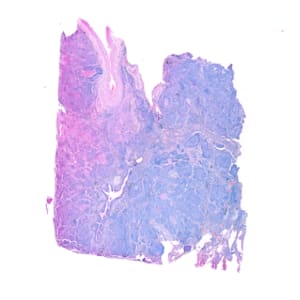
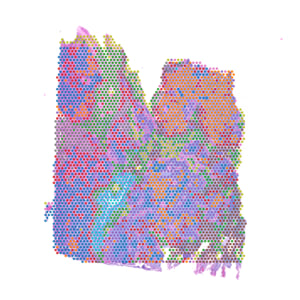
Human Melanoma
5 µm section from Skin, Malignant Melanoma
- Species
- Human
- Genes Detected
- 18069
- Capture Area
- 6.5 x 6.5 mm
- Spots Under Tissue
- 3458
- Chemistry
- Visium CytAssist for FFPE
- Mean Reads per Spot
- 55952
- Mean UMI Counts per Spot
- 27894
- Median Genes per Spot
- 7598
Spatial Gene Expression
Spatial tools for cancer research
Tumor microenvironments (TMEs) are as diverse and complex as the most exotic rainforest and should be studied in context. By combining histology with spatially resolved gene expression insights, Visium data can enable a better understanding of the influence of tissue architecture on cancer progression, immune infiltration, and therapeutic response.

Explore featured resources to enhance your oncology research
Resolve tumor heterogeneity with 10x
Spatial organization of the tumor microenvironment in renal cell cancer.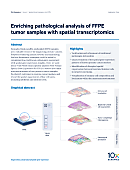
FFPE Application
Learn how Visium for FFPE complemented pathological assessment of tumor microenvironments with spatial gene expression insights for key prostate cancer markers and cell types.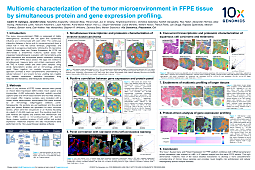
Poster
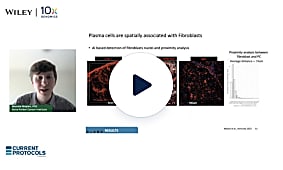
Multiomic characterization of the tumor microenvironment in FFPE tissue by simultaneous protein and gene expression profiling.