Note: 10x Genomics does not provide support for community-developed tools and makes no guarantees regarding their function or performance. Please contact tool developers with any questions. If you have feedback about Analysis Guides, please email analysis-guides@10xgenomics.com.
It is common for multiple tissue sections or Tissue Microarray (TMA) cores to be combined into a single on-instrument region of interest (ROI). This results in one cell-feature matrix containing cells from multiple sections. The matrix can be filtered during bioinformatic analysis, but sometimes researchers prefer to work with smaller subsetted datasets saved to disk.
This guide provides a workflow to split these combined outputs into separate bundles (specifically formatted as SpatialData Zarr files and Xenium Explorer compatible files) to enable per-section QC, individual analysis, and improved image alignment.
- To use the Python-based subset tools, install the following package versions in your environment:
pip install anndata==0.12.9 spatialdata[extra]==0.7.2 geosketch==1.3 scanpy==1.12.0 sopa==2.2.0 numpy==2.0.2
- Download the
subset2zarr.pyscript: https://github.com/10XGenomics/analysis_guides/blob/main/Xenium_subset/subset2zarr.py.
- Open your original output bundle in Xenium Explorer.
- Use the lasso tool to select the specific section or core you wish to subset.
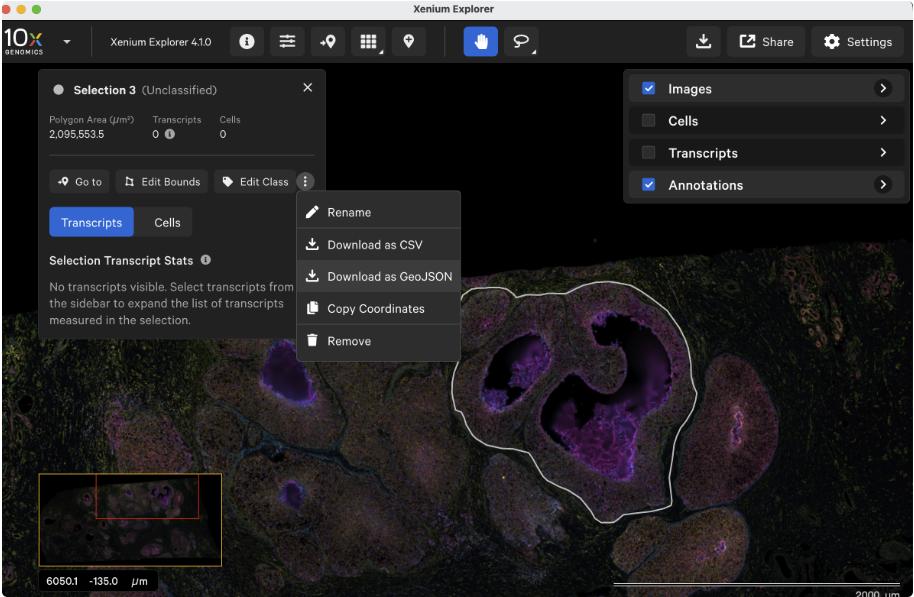
- Export the selection as a GeoJSON file of coordinates.
Use the subset2zarr.py script for high-throughput or command-line based subsetting.
python subset2zarr.py \
-i /path/to/xenium_folder \ # Path to input XOA bundle
-p /path/to/annotation.geojson \ # Path to selection GEOJSON
-o /path/to/output_explorer \ # Xenium Explorer output directory
-z subset.zarr # Path to save subsetted .zarr
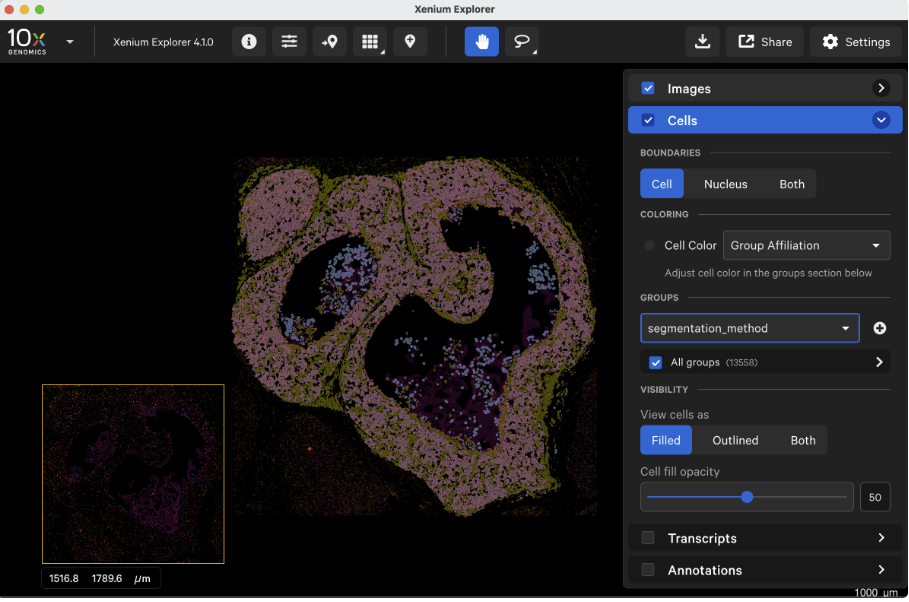
For researchers preferring a guided, interactive environment, a Jupyter notebook that covers two main sessions is provided.
1. Xenium ROI split and conversion to Xenium Explorer
This notebook handles the primary logic of reading the original bundle, applying the GeoJSON boundaries, and exporting the subsetted files for Xenium Explorer.
2. Recalculate metrics for subsetted data
Since subsetting changes the total cell and transcript counts, it is critical to recalculate metrics (e.g., transcripts per cell, median genes per cell) for the specific ROI. This notebook updates the QC metrics to reflect only the data within the selected boundary.
The pipeline generates a subset.zarr file, which can be loaded into a SpatialData Python environment for further exploration.
| Output type | Description |
|---|---|
| Zarr file | Optimized for loading into Python environments like SpatialData or Sopa. See the Xenium downstream analysis in Python tutorial. |
| Explorer files | Cropped images and subsetted transcripts for viewing in Xenium Explorer. |
| Updated metrics (Option B) | Recalculated summary statistics specific to the subsetted region. |
- Memory usage and run time: Run time and peak memory consumption are heavily dependent on the size of the selected ROI and the abundance of transcripts within that region. The Option A script uses a two-stage spatial query (bounding box pre-filter), dynamic image chunking, and Zarr chunking to optimize memory usage.
- Boundary cells: Cells overlapping the selection boundary will be cut. Transcript counts in the cell-feature matrix will only include those physically located inside the boundary.
- Segmentation: This process does not redo cell segmentation. It uses the existing segmentation from the original XOA run.