Note: 10x Genomics does not provide support for community-developed tools and makes no guarantees regarding their function or performance. Please contact tool developers with any questions. If you have feedback about Analysis Guides, please email analysis-guides@10xgenomics.com.
We have completed the tutorial on 10x Cloud Walkthrough, from FASTQs to Quantitative Biological Information. Next, we will use the web_summary.html file output from Cell Ranger to start assessing the quality of the data. We will focus on the results from custom analysis (setting "Force Cells" to 8000) first.
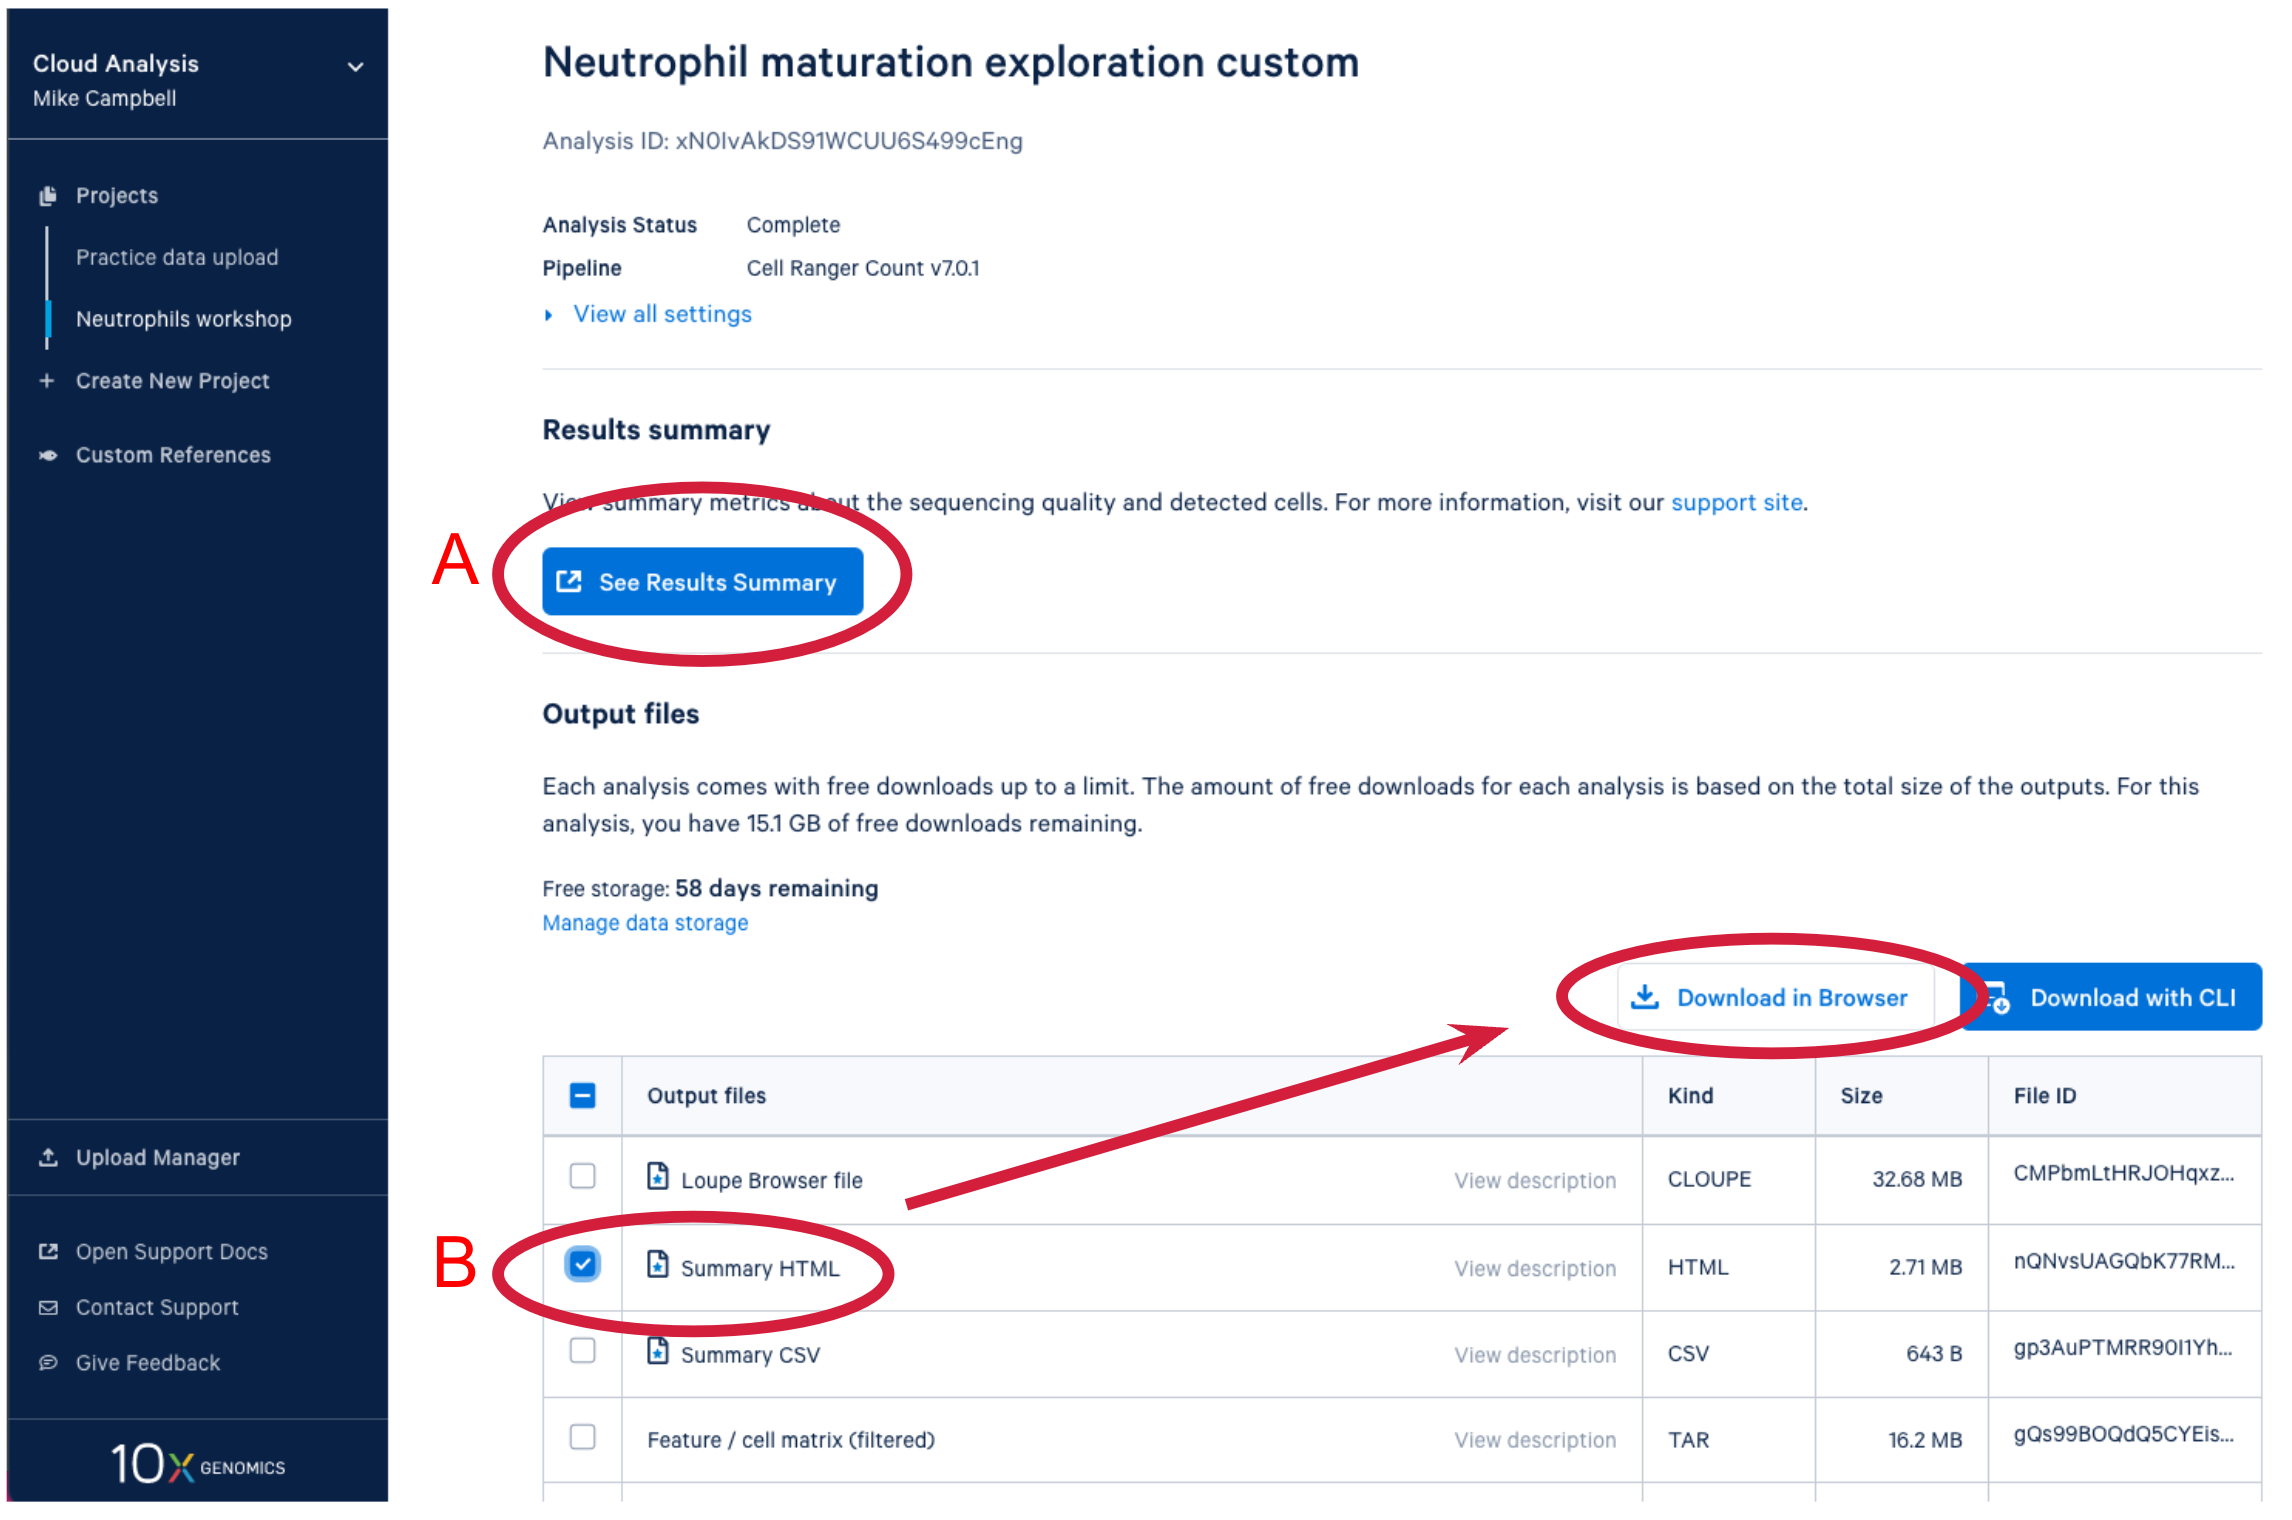
After the analysis completes successfully on the 10x Cloud, we can access the summary file in two ways. (A) Open the summary by clicking on See Results Summary. (B) Check the Summary HTML in the output files list and then click on Download in Browser to download the web_summary.html file. The file can then be viewed in a web browser of your choice.
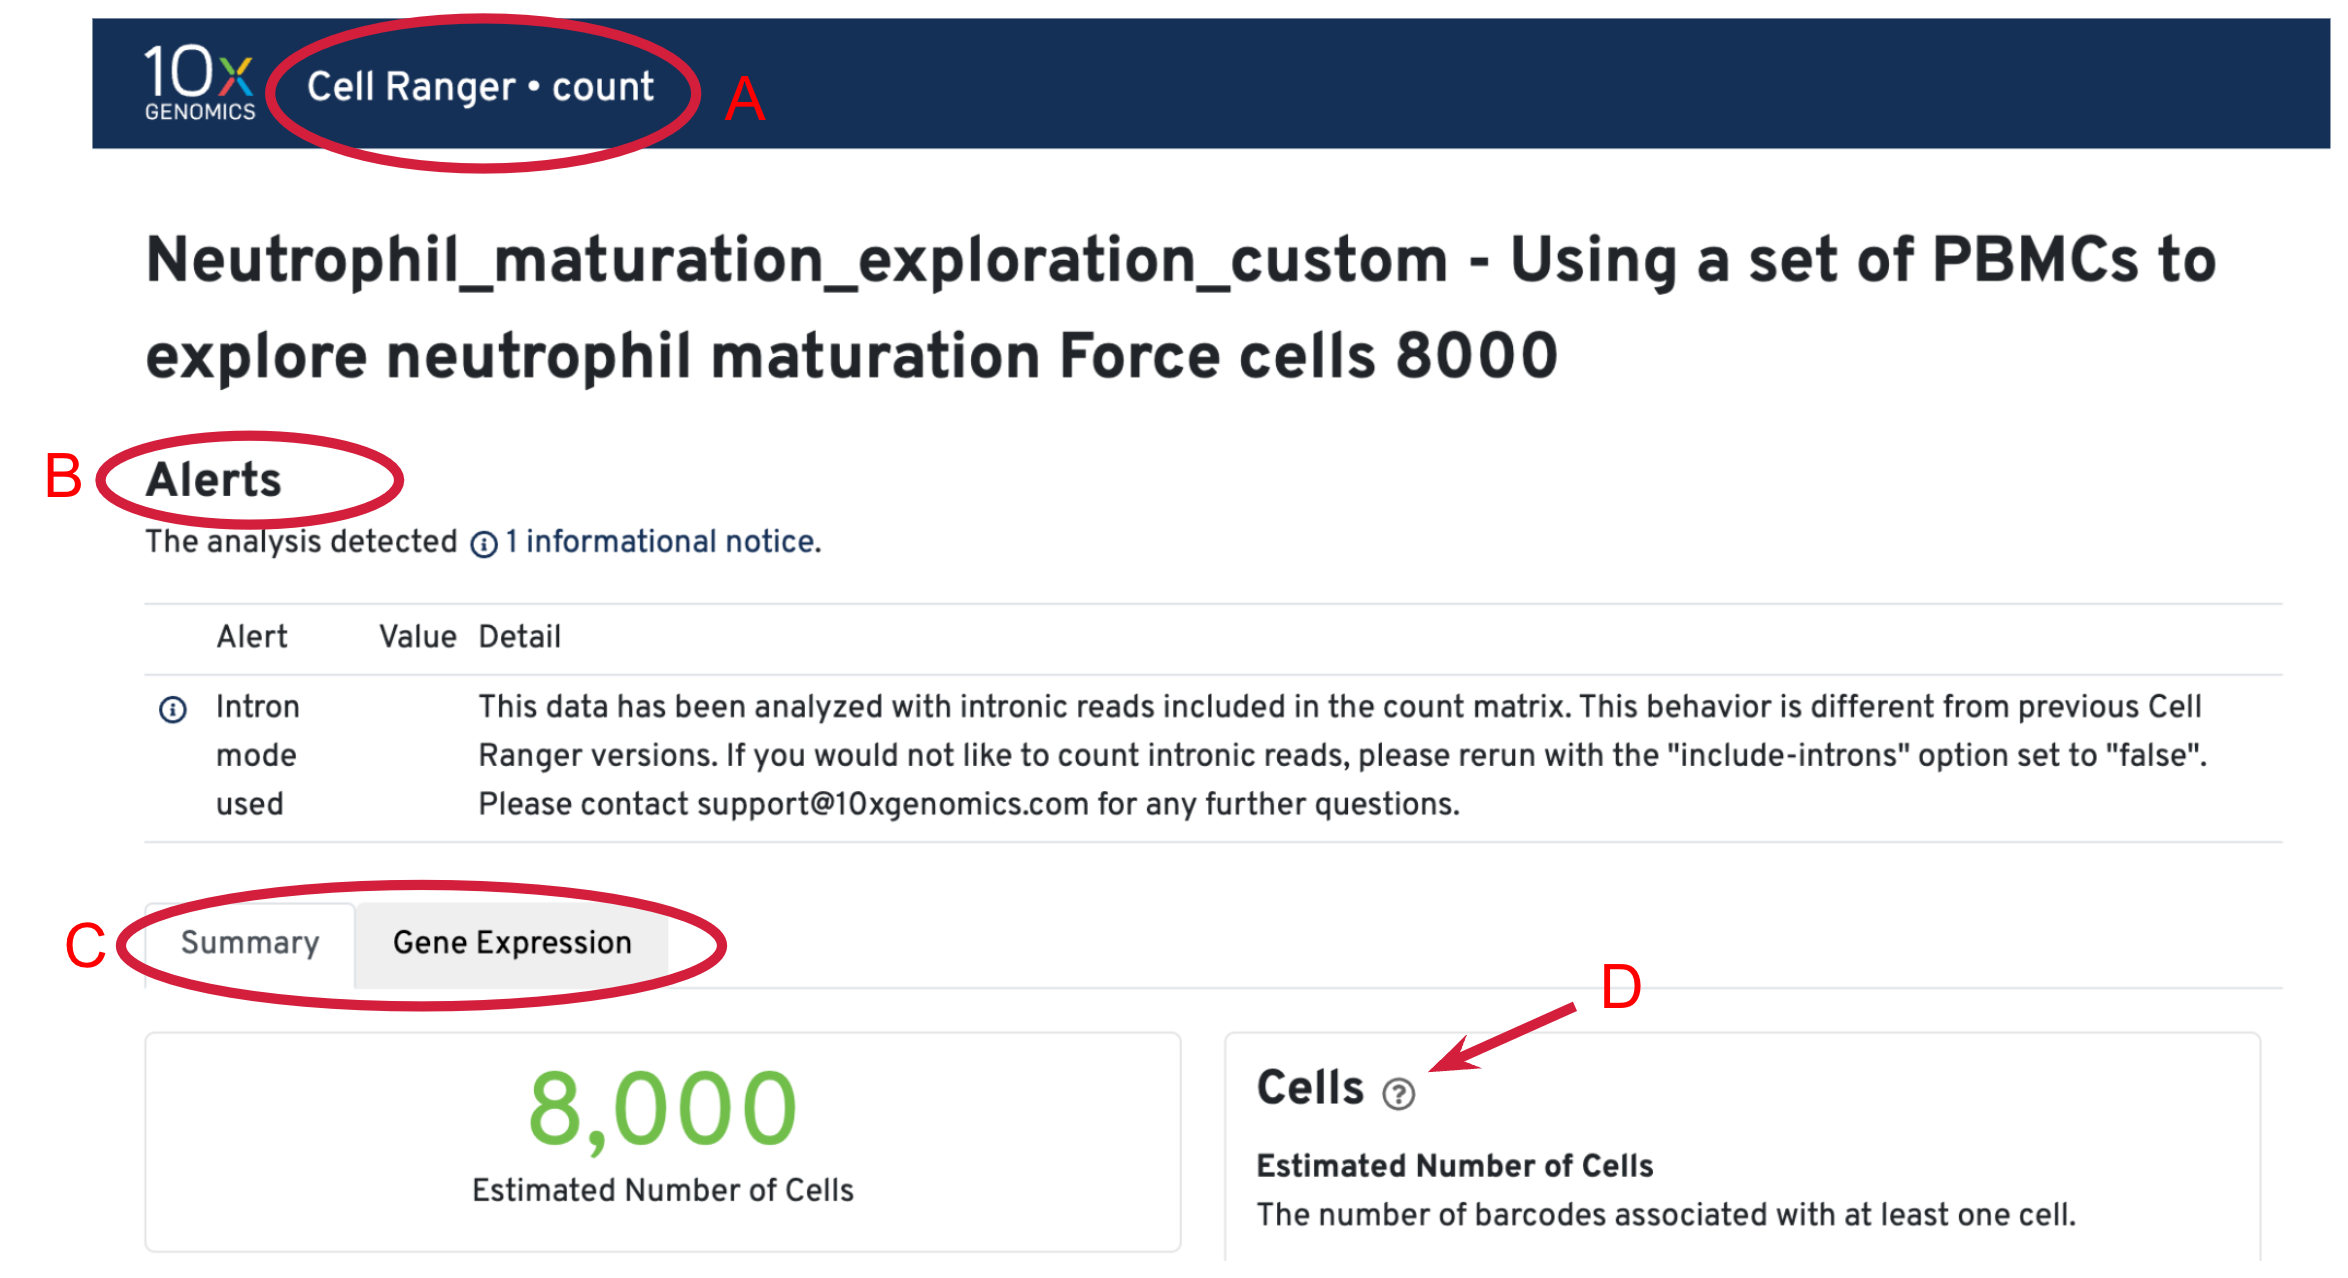
On the top of the web summary, we can confirm the pipeline used to generate the results (A). For this sample, the data were analyzed with the cellranger count pipeline. Under the analysis ID, we may see some alerts (B). In this case, there is only one information alert to inform us that introns are included in this analysis. If results are abnormal, we may see warnings and errors in the alerts section. More information about alerts is provided in the Cell Ranger troubleshooting documentation. Each web summary has multiple tabs, depending on the input library types. Here we only have a Gene Expression library, so there are two tabs: Summary and Gene Expression (C). We will discuss the metrics in each of the tabs in more detail. However, we will not go through all metrics individually, but focus on some key metrics. If we are unsure about what a given metric or plot means, we can click the question mark ? to read full descriptions for each section (D).
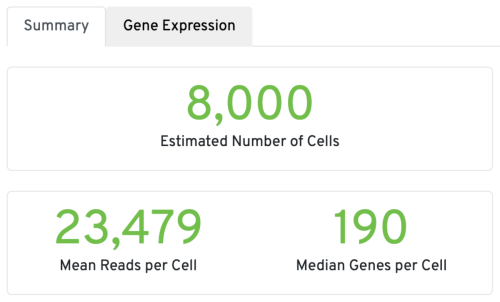
Three key metrics are presented at the top left of the Summary tab:
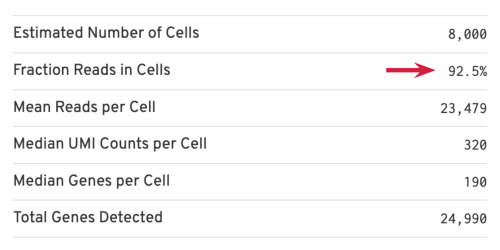
- Estimated Number of Cells: the number of barcodes associated with cells. We set Force Cells to 8000 when running the analysis, therefore, we observe 8,000 cells here.
- Mean Reads per Cell: the total number of sequenced reads divided by the number of cells. We recommend a minimum of 20,000 read pairs per cell.
- Median Genes per Cell: the median number of genes detected per cell-associated barcode. This metric is dependent on cell type and sequencing depth. Here we observe 190, which is lower than what we would normally expect, but it could be explained by the fact that neutrophils only express around a few hundred genes (Hay et al. 2018). Also, with setting Force Cells, we may include some background in the results. We can remove the background using Loupe Browser later.
We are not planning to go through the rest of the sections and metrics in detail, but will highlight the ones more relevant to assess the quality of this sample. For more details of each metrics and their expected range, please refer to this technical note: Interpreting Cell Ranger Web Summary Files for Single Cell Gene Expression Assays.
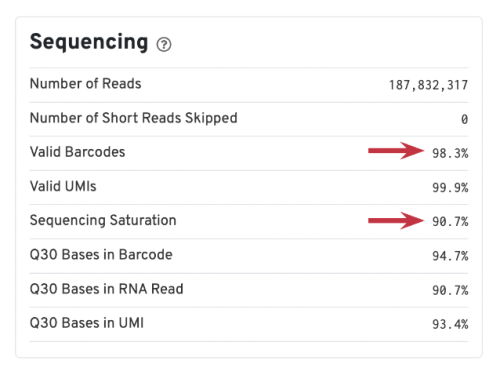
Valid Barcodes: shows the fraction of reads with barcodes that match the inclusion list after barcode correction. Low valid barcodes (<75%) may indicate sequencing issues or sample/library preparation issues.
Sequencing Saturation: a measure of the fraction of library complexity that was sequenced in a given experiment. Depending on the goals of the experiment, you may or may not need high sequencing saturation. For this sample, 90.7% is already very good, which is more than sufficient for us to achieve the goal of this experiment (identify neutrophils and explore neutrophil maturation). For other experiments, this article could be helpful: how much sequencing saturation should I aim for?
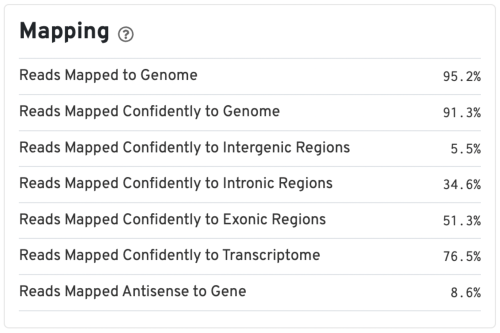
Mapping metrics could vary depending on the species. Overall, we would like the Reads Mapped to Genome to be high (for example, >85% for mouse or human), and the Reads Mapped Confidently to Genome to be close to the Reads Mapped to Genome.
For good quality samples, the Intergenic reads should be low. Intronic reads can be higher when the sample is prepared from nuclei or cells with high-level of intron retention (such as neutrophils, Ulrich & Guigo, 2020).
The Reads Mapped Confidently to Transcriptome are the reads considered for UMI counting. Overall, the mapping metrics for this sample are very good.
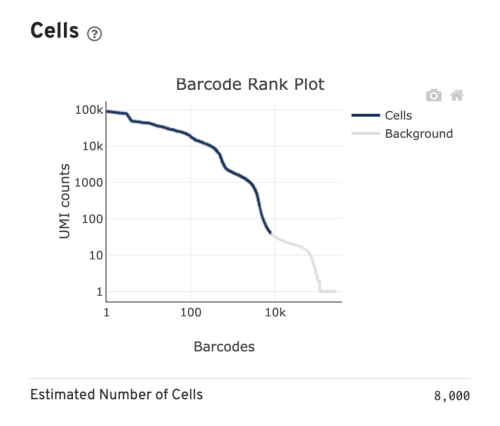
The most important and informative plot in the Gene Expression Web Summary is the Barcode Rank Plot, which shows the distribution of UMI counts in barcodes. All detected barcodes are plotted in decreasing order of the number of UMIs associated with that particular barcode.
We can take a look at a few examples before looking into the barcode rank plot for our sample using this Technical Note: Interpreting Cell Ranger Web Summary Files for Single Cell Gene Expression Assays. Page 4 of the technical note shows a few examples of good and compromised samples. We will look at the typical sample and the heterogeneous sample here.
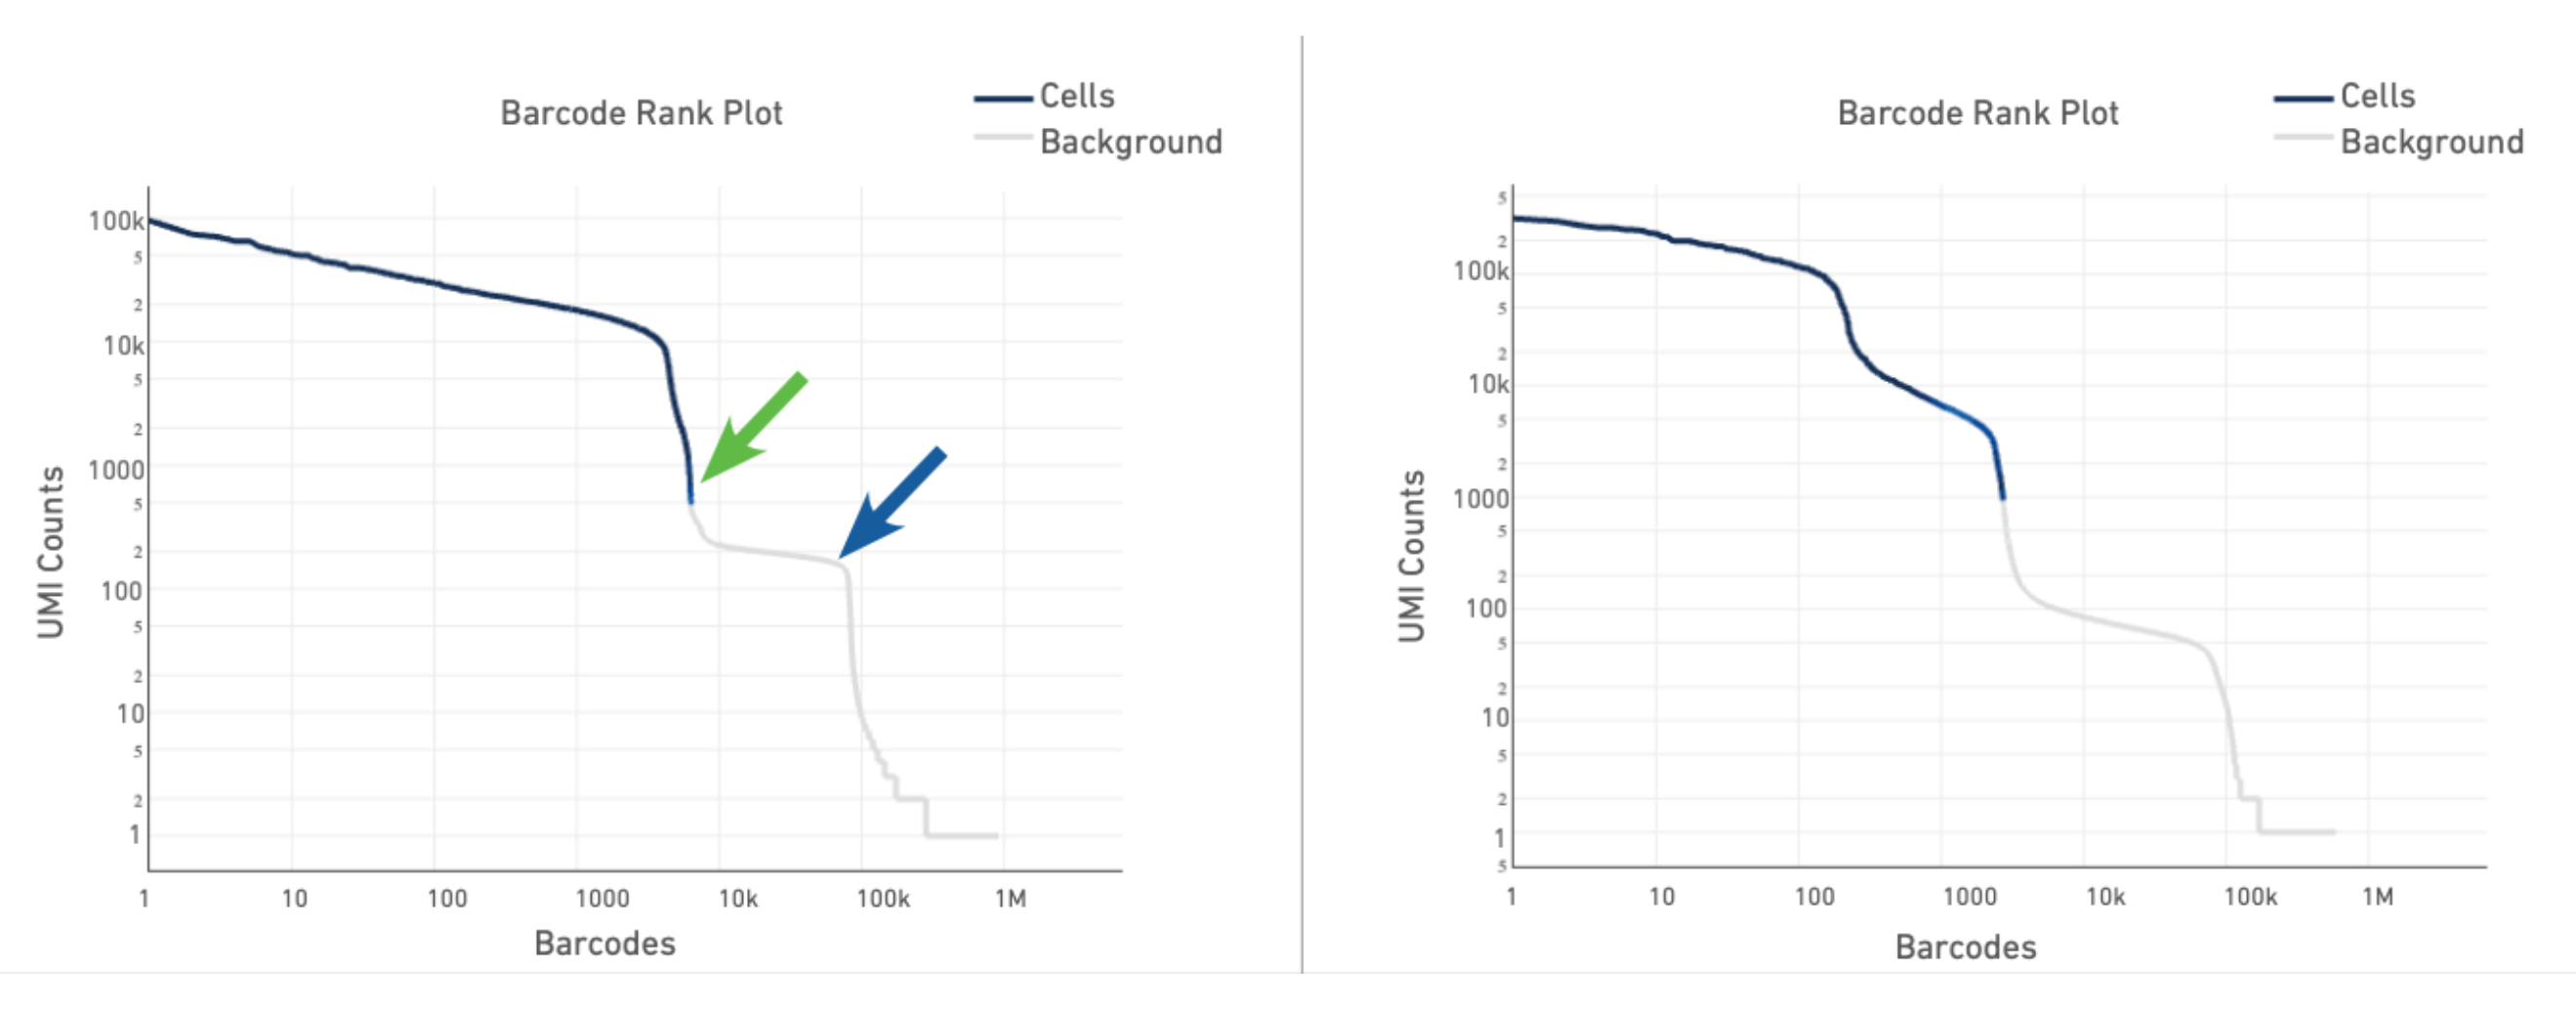
The plot for a typical sample (left in the screenshot below) has a distinctive shape, which is referred to as a "cliff and knee". The blue-to-gray transition (green arrow) is referred to as the cliff; the solid gray (blue arrow) is the knee. The steep cliff is indicative of good separation between the cell-associated barcodes and the barcodes associated with empty GEMs.
Depending on the sample type, heterogeneous populations of cells in a sample may result in a bimodal plot (right in the screenshot below). In these situations, the cell-associated barcodes will have two cliff and knee distributions. However, there should still be clear separation between the barcodes called as cells (blue) and barcodes called as background (gray).
The barcode rank plot for our sample looks similar to the heterogeneous sample in the technical notes. This is consistent with what we expect from our sample, which contains PBMCs (relatively high number of expressed genes) and neutrophils (only expressing around a few hundred genes). However, the transition of blue to gray is lower than expected, which means some of the cells we included could be background (gray). This is fine for now, because we can filter those out in Loupe Browser (Filter out background GEMs).
Several of the Cells metrics are already covered in the key metrics section earlier. One more metric to highlight is the Fraction Reads in Cells, which shows the fraction of valid-barcode, confidently-mapped reads with cell-associated barcodes. Lower percentages (< 70%) indicate that a high level of ambient RNA partitioned into all (cell-containing and non-cell-containing) GEMs.
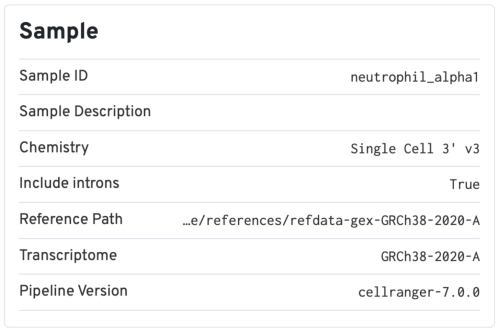
The Sample section includes some basic information of the sample, as well as the input parameters for the analysis. It is always useful to double check if the chemistry version and the transcriptome reference used are consistent with how you prepared the sample. We normally recommend using the latest pipeline version available.
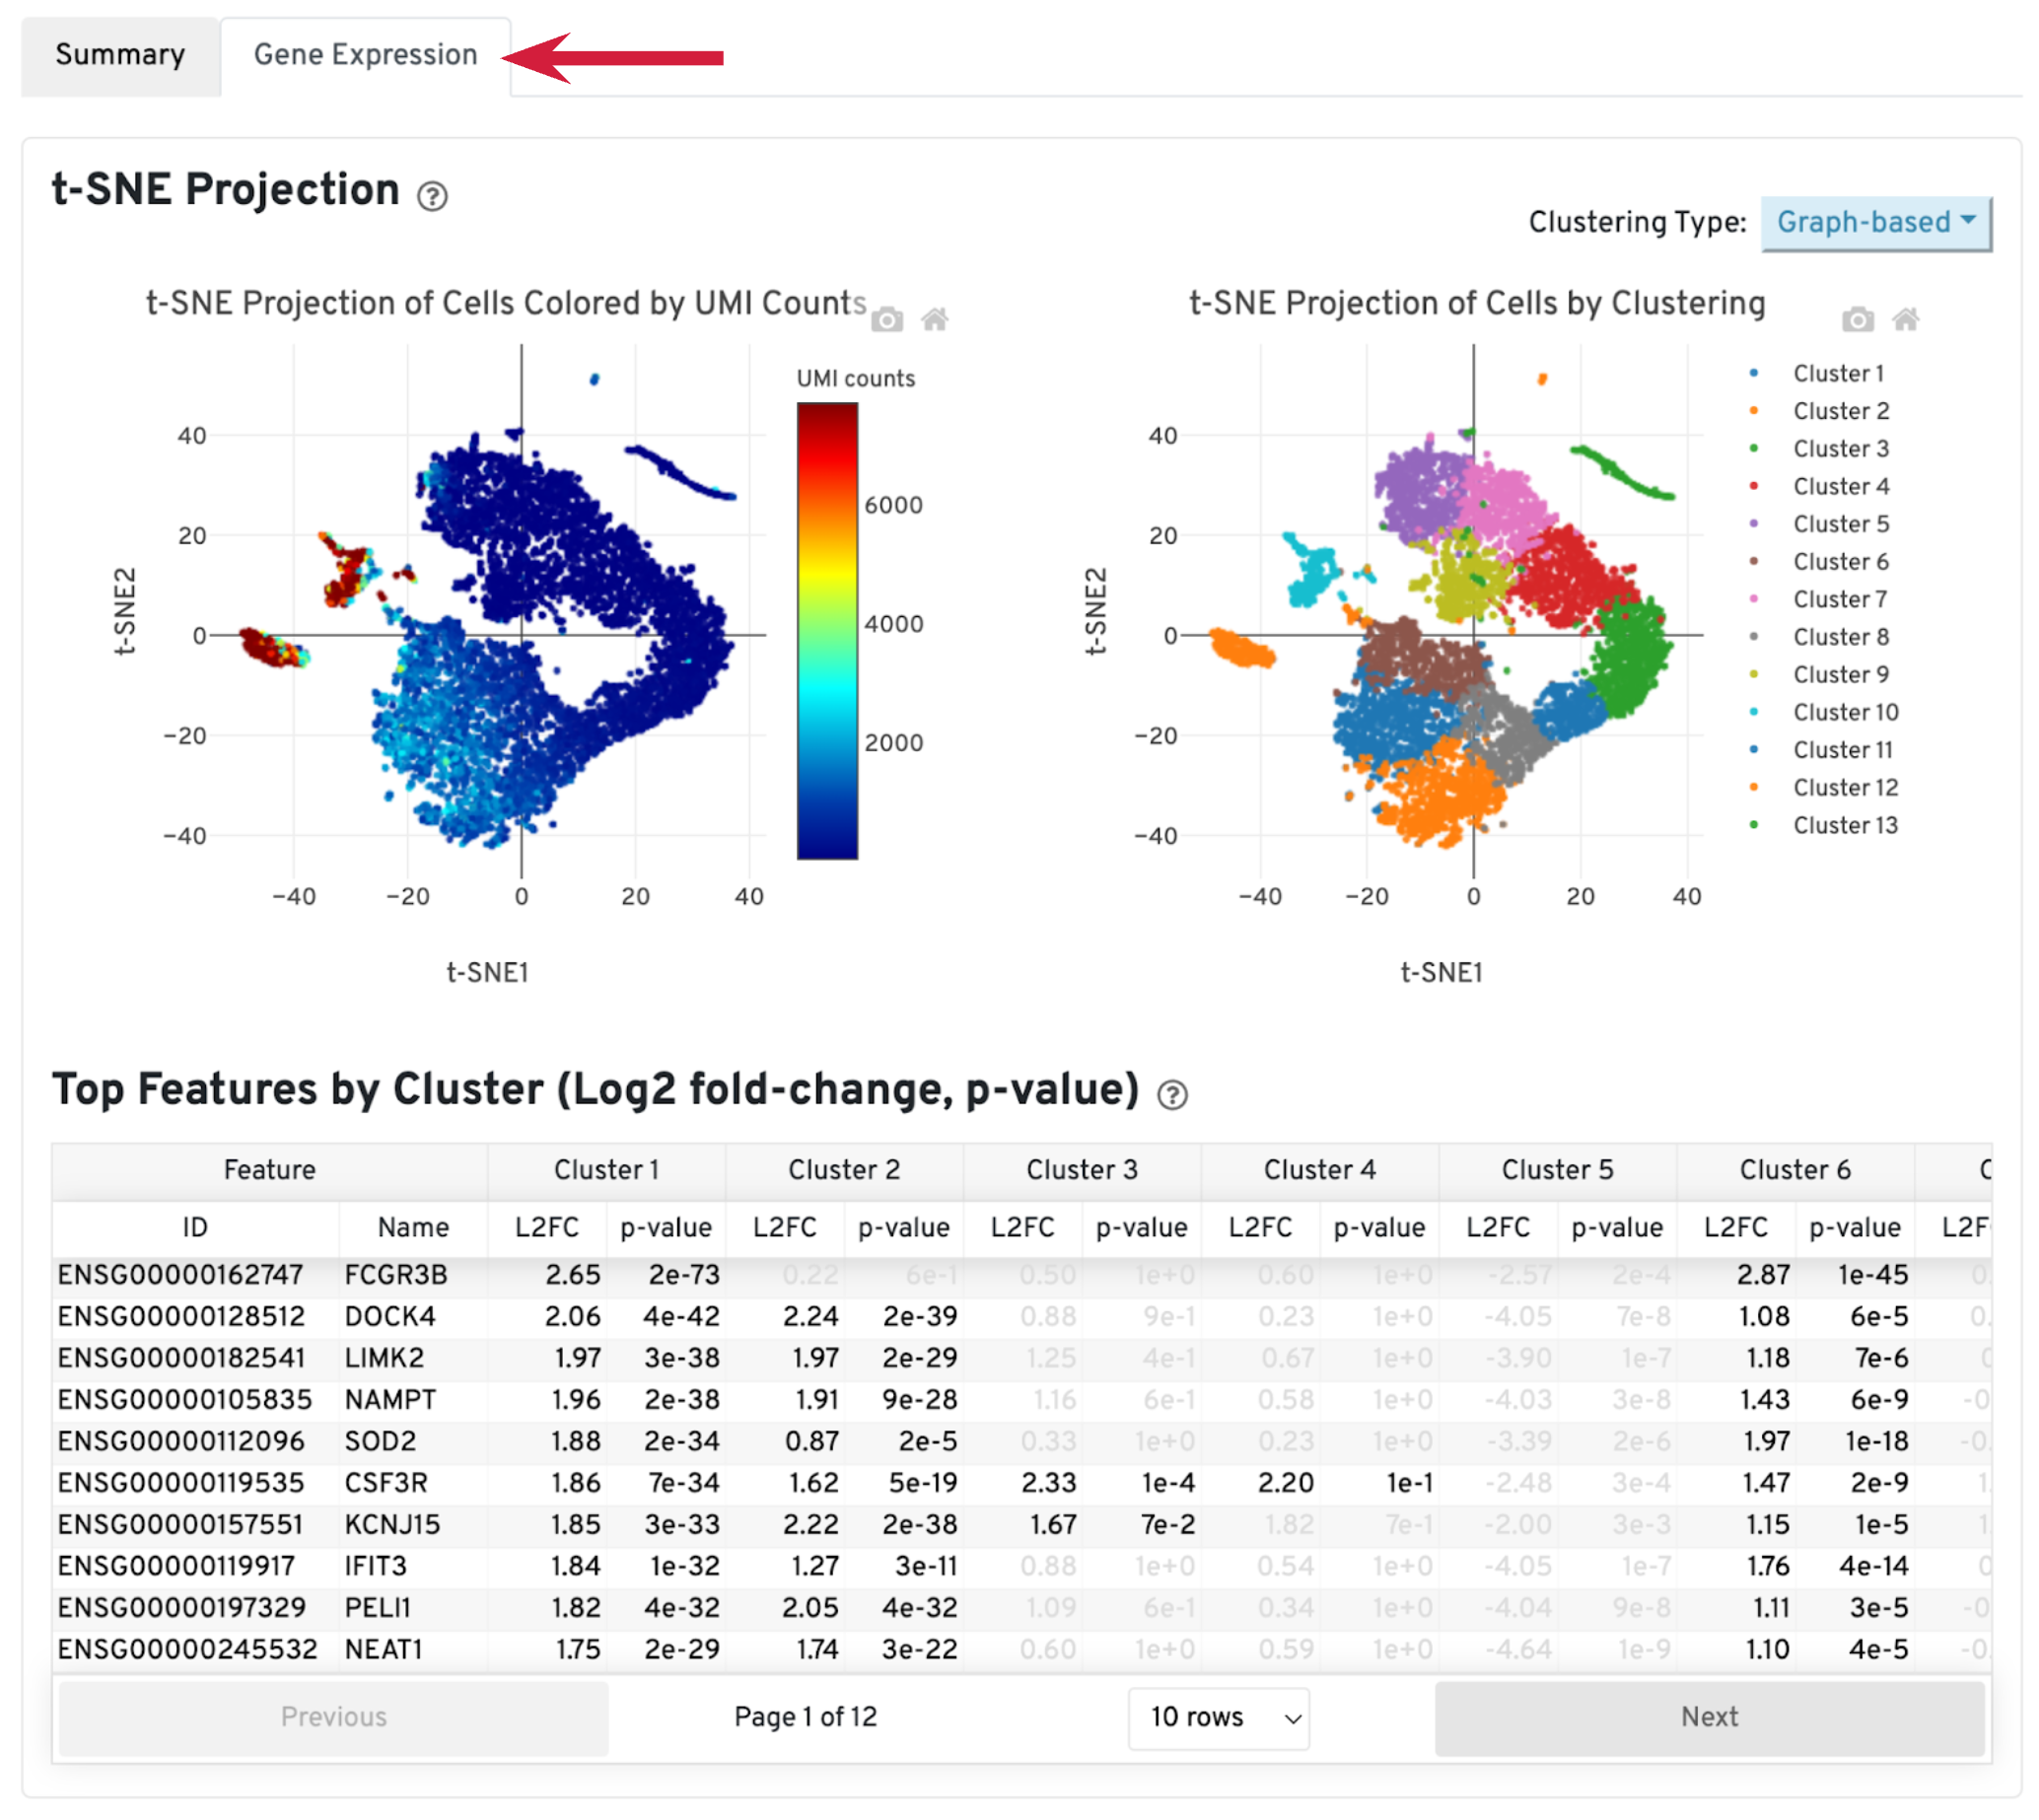
The library-specific analysis tab contains some information on secondary analysis, including dimensionality reduction (t-SNE), clustering, and differentially expressed genes. The goal of this tab is not for downstream analysis (which should be carried out in Loupe Browser or community developed tools), but for quickly assessing the quality of the results with some biological context.
A typical sample should have a t-SNE plot with defined structures – different clusters separated in the plot, as shown in our sample. Lack of cluster structure, or no separation (for a sample with expected heterogeneous cell populations) may indicate sample quality issues or loss of single cell behavior.
The Top Features by Cluster table shows the top differentially expressed genes in each cluster. This table is likely not sufficient for us to perform cell type annotation. However, we can use the table to assess sample quality, because poor samples have some distinct signatures. For example, if the total number of genes in the table is very small (<20), it may indicate loss of single cell behavior. If one or more clusters have many mitochondrial or ribosomal protein genes differentially expressed, it may indicate these clusters are mostly unhealthy or dead cells.
For this sample, we ran Cell Ranger with both default and --force-cells=8000 option. Before comparing the results, we would like to first introduce the cell calling algorithm in Cell Ranger. On a high level, the algorithm has two steps: (1) identify the initial number of high RNA content cells and (2) distinguish low RNA content cells from empty droplets based on the expression profiles using the EmptyDrops method.
When using the default Cell Ranger cell calling algorithm, there are only 1,839 cells identified (left plot below). This is because the RNA profile of neutrophils is more similar to the background (low UMI, low gene count) and the cell calling algorithm cannot readily distinguish between the neutrophils and background. Many of the potential neutrophils at the lower "cliff" (red arrow) were not identified as cells. Therefore, in order to preserve the neutrophils in the results, we need to use the --force-cells parameter to bypass the cell calling algorithm and specify a larger number of cells. We set this parameter to 8000 for this sample based on the number of cells targeted in this experiment. If you are unsure about the number of cells expected, it is better to overestimate at this stage.
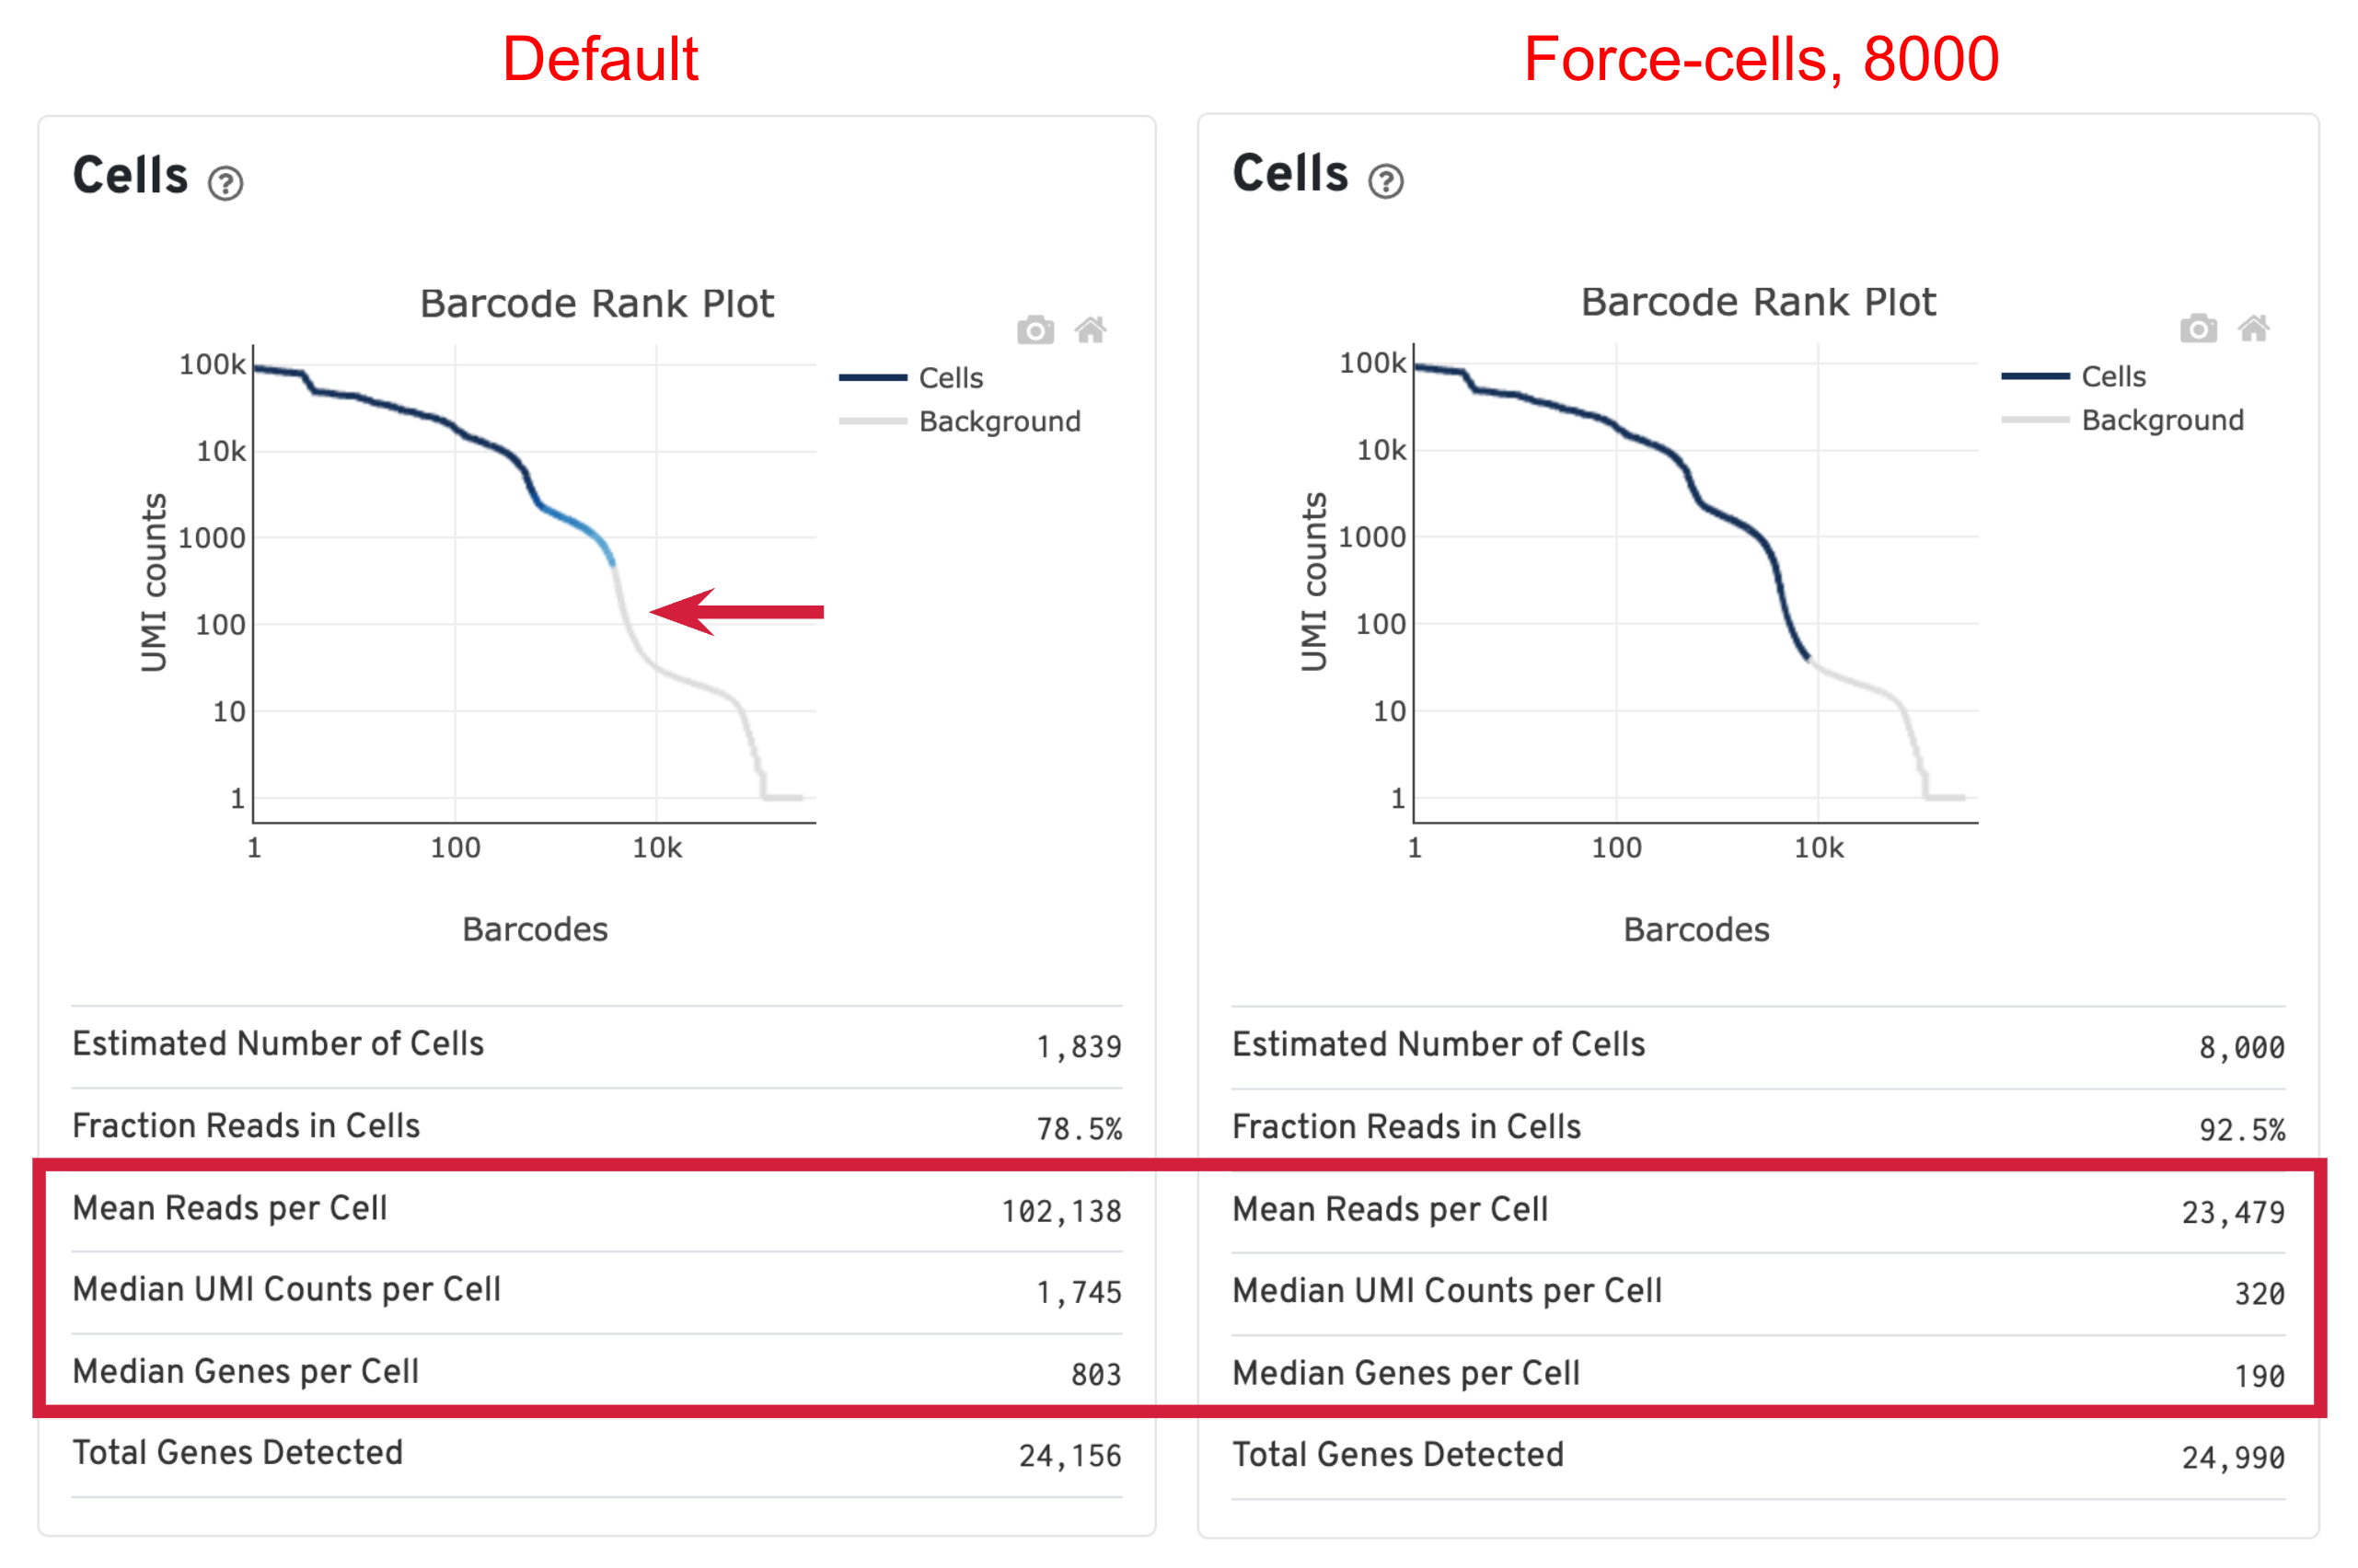
Due to the changes of the cell number, some of the metrics, such as the Mean Reads per Cell, Median UMI Counts per Cell and Median Genes per Cell, are higher in default results compared to using force-cells. This is mainly because in default results, only high RNA content cells (such as B cells, T cells, and monocytes) were captured. The number of genes, UMIs, or reads are indeed higher for these cells. In this scenario, the higher metrics observed previously are not necessarily better because we lost the neutrophils we are interested in.
This concludes the quality assessment section of our workshop. In this example dataset, when forcing 8000 cells, we are also risking including background GEMs as cells. Next, we will use Loupe Browser to filter background and annotate cell types in the data.