Note: 10x Genomics does not provide support for community-developed tools and makes no guarantees regarding their function or performance. Please contact tool developers with any questions. If you have feedback about Analysis Guides, please email analysis-guides@10xgenomics.com.
- Tangram, gimVI, and SpaGE are the top-performing methods to predict spatial distribution of RNA transcripts.
- Cell2location, SpatialDWLS (in Giotto), and RCTD (in spacexr) are the top-performing methods to deconvolute cell type compositions in spots.
Spatial transcriptomics technology has substantially advanced our capability to detect RNA spatial distribution. However, the current approaches have their own unique limitations:
-
Image-based spatial transcriptomics assays that rely on in-situ hybridization and fluorescence microscopy, such as seqFISH, osmFISH, and MERFISH, enjoy high resolution and accuracy in the detection of spatial gene expression, but are limited in the number of detected RNA transcripts.
-
Next-generation sequencing based spatial transcriptomics approaches, such as 10x Visium, can capture RNA transcripts at the whole transcriptome scale, but are limited by their spatial resolution.
To overcome the limitations, multiple bioinformatics tools have been developed to integrate spatial transcriptomics data with single cell gene expression data. In the paper Benchmarking spatial and single-cell transcriptomics integration methods for transcript distribution prediction and cell type deconvolution by Li et al., the authors compared 16 integration methods using 45 paired datasets (paired spatial transcriptomics and scRNA-seq data), and 32 simulated datasets. Based on their tested datasets, they categorized performance of the integration methods in the following four areas:
-
Prediction of spatial distribution of RNA transcripts.
-
Handling matrix sparsity when predicting RNA spatial distribution.
-
Spot cell type composition deconvolution .
-
Computational resource consumption.
| Methods | RNA Spatial Distribution | Matrix Sparsity Handling | Cell Type Deconvolution | Computational Resource |
|---|---|---|---|---|
| Tangram | YES | YES | YES | YES |
| gimVI | YES | YES | YES | |
| SpaGE | YES | YES | YES | |
| Seurat | YES | YES | YES | YES |
| SpaOTsc | YES | YES | YES | YES |
| novoSpaRc | YES | YES | YES | YES |
| LIGER | YES | YES | YES | |
| stPlus | YES | YES | YES | |
| Cell2location | YES | YES | ||
| SpatialDWLS | YES | YES | ||
| RCTD | YES | YES | ||
| Stereoscope | YES | YES | ||
| DestVI | YES | YES | ||
| STRIDE | YES | YES | ||
| SPOTlight | YES | YES | ||
| DSTG | YES | YES |
Note: YES indicates that the given method was tested in the specified area
| Performance | Top-performing tools |
|---|---|
| Prediction of spatial distribution of RNA transcripts | Tangram, gimVI, and SpaGE (Figure 1A) |
| Handling matrix sparsity when predicting RNA spatial distribution | Tangram, gimVI, and SpaGE (Figure 1B) |
| Deconvolution of cell type compositions in spots | Cell2location, SpatialDWLS, and RCTD (Figure 1C) |
| Computational resource consumption | Seurat (prediction of spatial distribution of RNA transcripts, Figure 1D), Seurat and Tangram (deconvolution of cell type compositions, Figure 1E) |
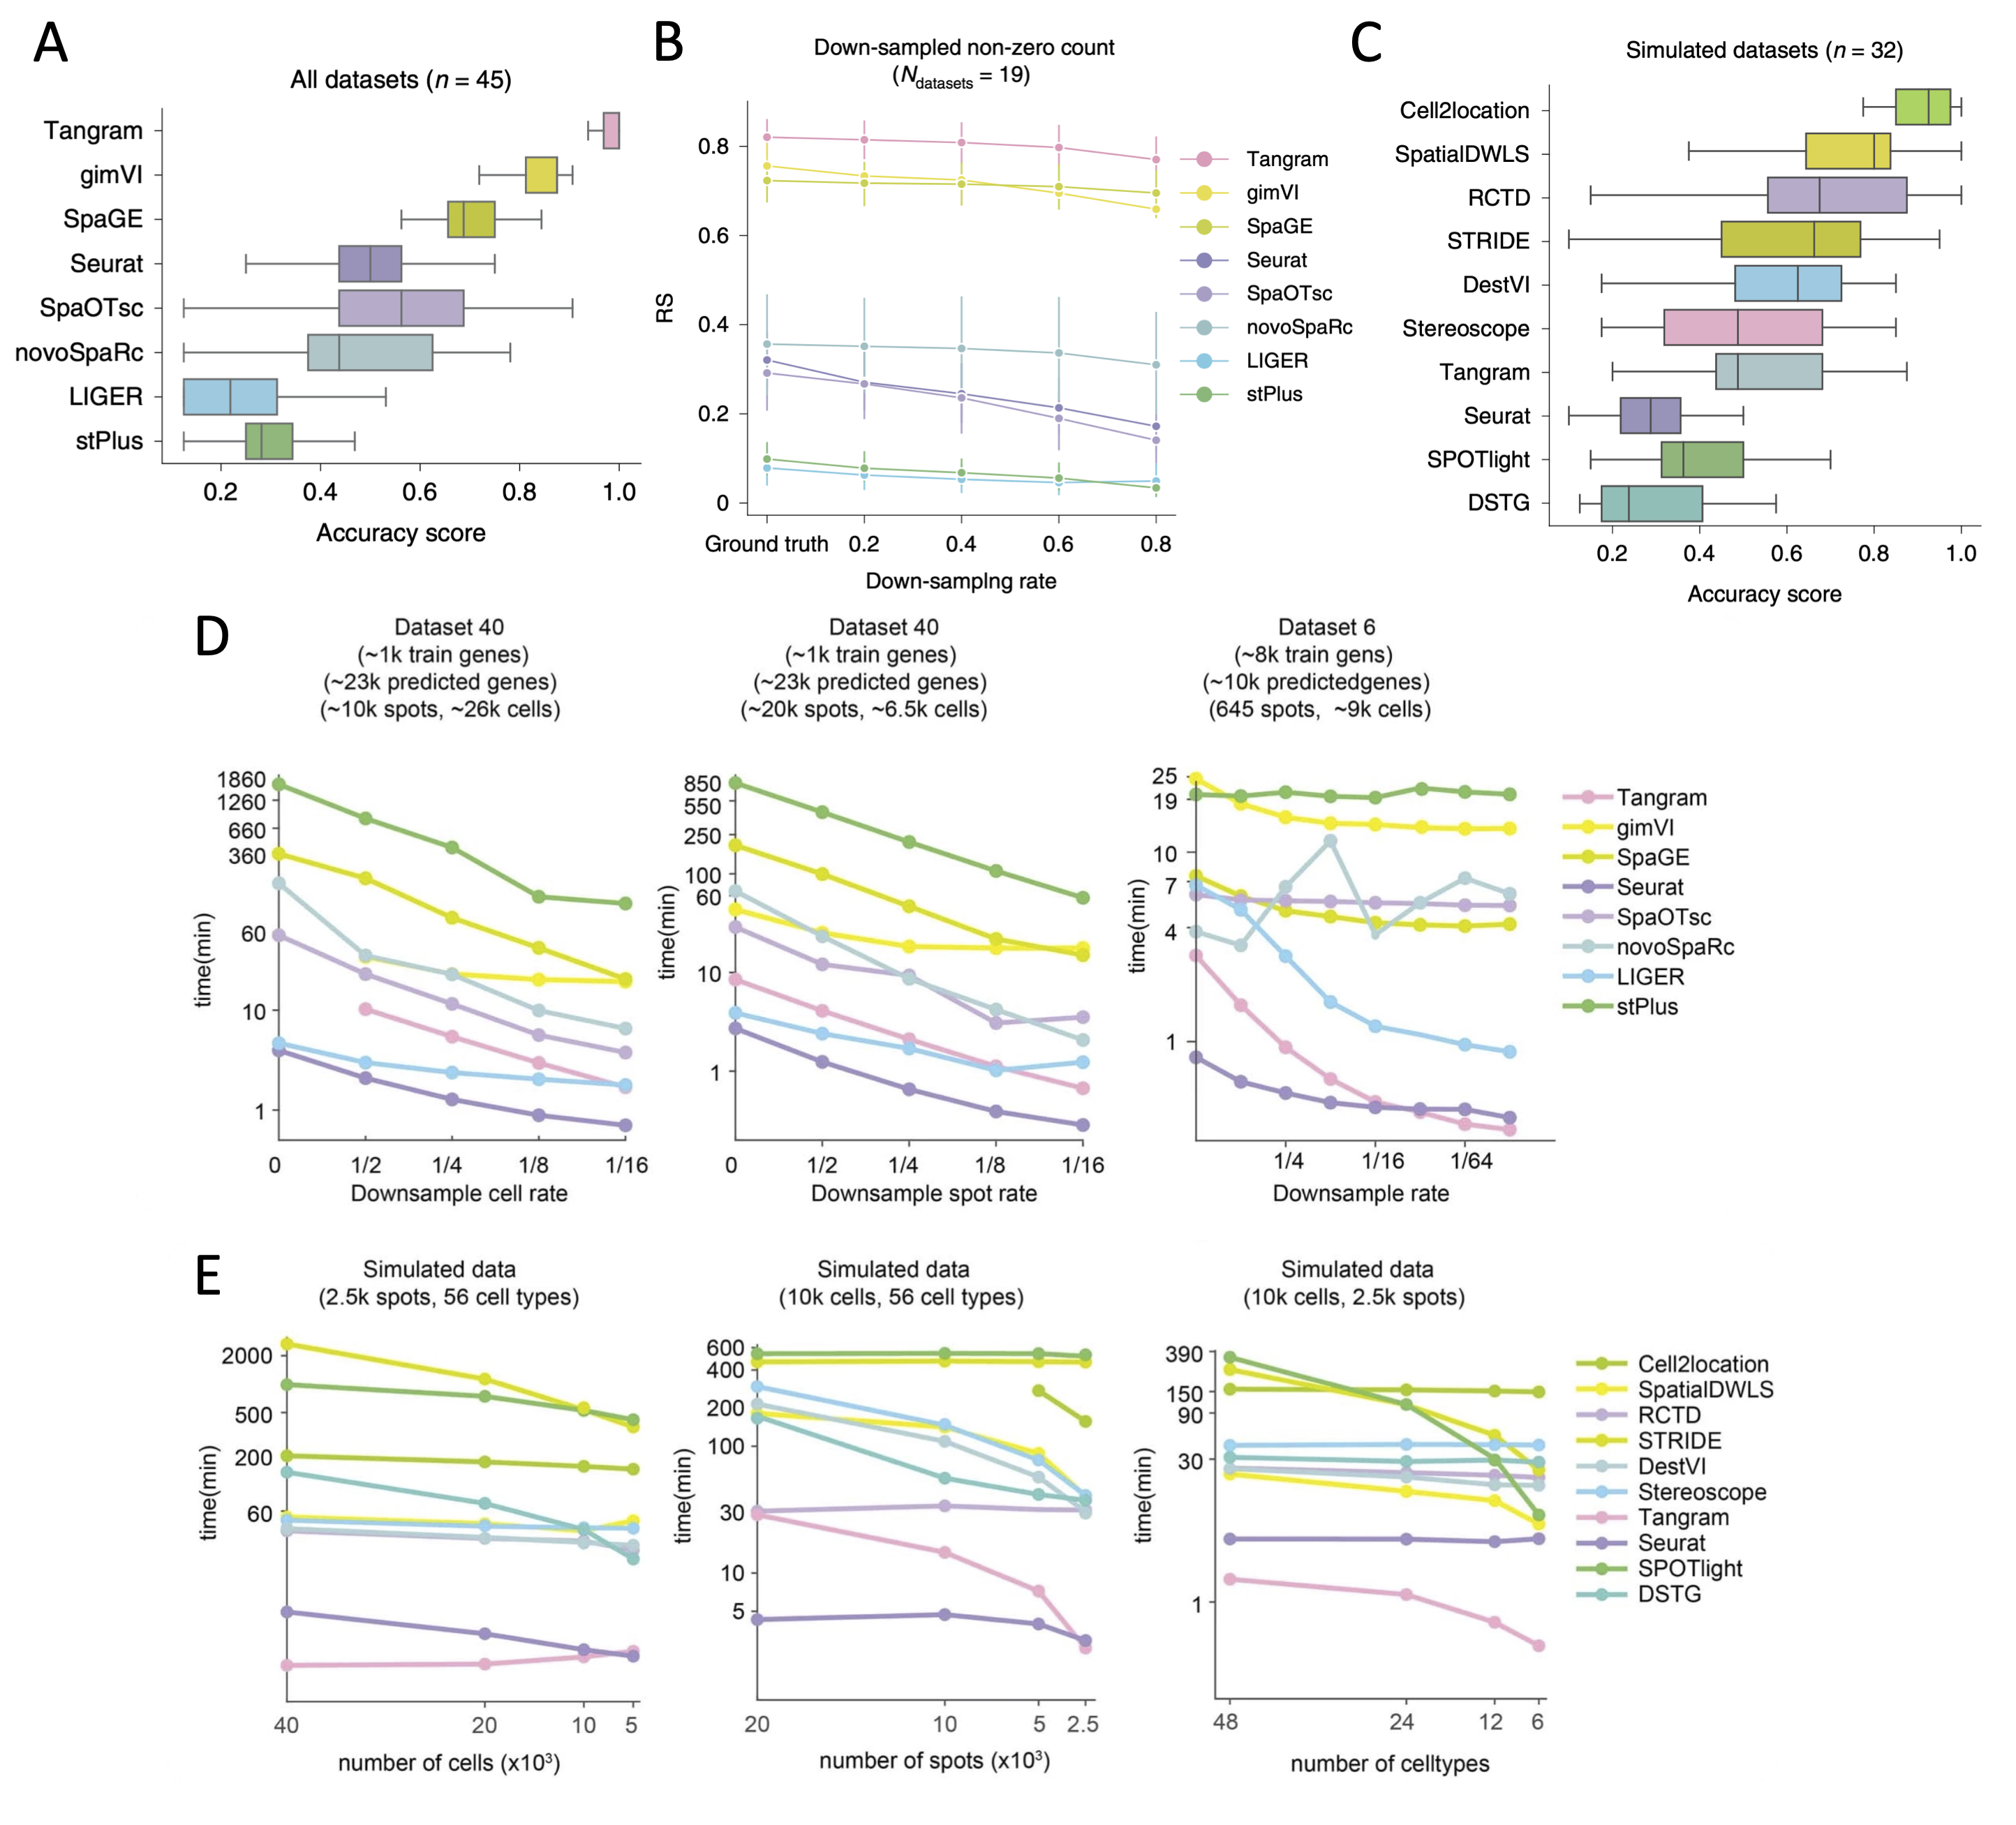
Figure 1. Comparisons of integration tools. A. Boxplots of accuracy score of the eight integration methods for all 45 paired datasets to predict spatial distribution of RNA transcripts (adopted from Fig 2e in Li et al. 2022). B. Robustness score (RS) values of the eight integration methods when processing the sparse expression matrices of the down-sampled datasets to predict RNA spatial distribution (adopted from Fig 3c in Li et al. 2022). C. Boxplots of accuracy score of the ten integration methods for 32 simulated datasets to deconvolute cell types in spot. SpaOTsc and novoSpaRc are excluded, as they require spatial location information for each spot, which is not available in the simulated datasets (adopted from Fig 4e in Li et al. 2022). D. The impact of the number of cells in scRNA-seq data, the number of spots in spatial data, and the number of genes used for training on computational resources consumed by the integration methods that can predict the spatial distribution of undetected transcripts (adopted from Extended Data Fig. 9a-c in Li et al. 2022). E. The impacts of the number of cells in scRNA-seq data, the number of spots in spatial data, and the number of the cell types on computational resources consumed by the integration methods that can deconvolute cell types of histological spots (adopted from Extended Data Fig. 9e-g in Li et al. 2022).
The field of spatial transcriptomics is continually evolving and users should carefully consider their chosen methods. It is good user practice to test multiple methods on their own data, and find consensus in the results before drawing conclusions. To learn more about methods for integrating spatial and single-cell transcriptomics data, please see this introduction: Integrating Single-cell and Visium Spatial Gene Expression Data.