Note: 10x Genomics does not provide support for community-developed tools and makes no guarantees regarding their function or performance. Please contact tool developers with any questions. If you have feedback about Analysis Guides, please email analysis-guides@10xgenomics.com.
- Different methods performed best for 10x Genomics datasets with different characteristics.
- Overall, Harmony, Seurat 3, and LIGER are the top performers based on qualitative and quantitative evaluations.
Researchers often need to analyze single-cell RNA-seq datasets compiled from multiple experiments or publicly available data. These data could be different in technology platforms, reagent lots, handling personnel, etc. For example, Human Cell Atlas datasets can be generated by different laboratories worldwide. These technical differences lead to batch effects, which need to be corrected to perform downstream analysis and draw meaningful conclusions. There are growing numbers of computational tools developed for batch correction for scRNA-seq data. A*STAR researchers (Tran, Hoa Thi Nhu, et al. A benchmark of batch-effect correction methods for single-cell RNA sequencing data. Genome biology 21.1 (2020): 1-32.) performed comprehensive comparisons of 14 methods on various datasets.
An effective batch correction method for scRNA-seq should remove unwanted technical variations among batches while preserving cell type purity. When considering batch correction, we often emphasize removing the unwanted technical variation. However, keeping the meaningful biological diversity is equally important.
Tran et al. chose 14 commonly used batch correction methods and evaluated their effectiveness using datasets with different characteristics. They utilized visualization methods (t-SNE and UMAP) and quantitative metrics to benchmark the methods. The table below summarises the top-performing tools for various 10x Genomics datasets that the authors have evaluated.
Table 1: Summary of recommended methods for different datasets with 10x Genomics data.
| Data characteristics | Top-performing tools |
|---|---|
| Common cell types in different batches, different chemistry | Harmony; Seurat 3 |
| Non-identical cell types in different batches | Harmony |
| Big data (Human Cell Atlas) | LIGER |
The most common and intuitive approach to evaluate batch correction is by visually inspecting t-SNE or UMAP plots. As an example of scenario 1, the researchers evaluated the 14 methods using UMAP for two batches (10xGenomics 3’ and 5’ GEX) of PBMC data (Figure 1, adapted from Fig. 4 of the publication).
Effective batch correction methods (such as Seurat 3 and Harmony results) should mix the two batches without mixing up different cell types. On the other end of the spectrum, some methods, such as ComBat, failed to mix the two batches. Other methods, such as scGen, managed to mix the batches, but did not maintain cell type purity (see the unwanted mixing of CD4 and CD8 cells, pointed by the red arrow).
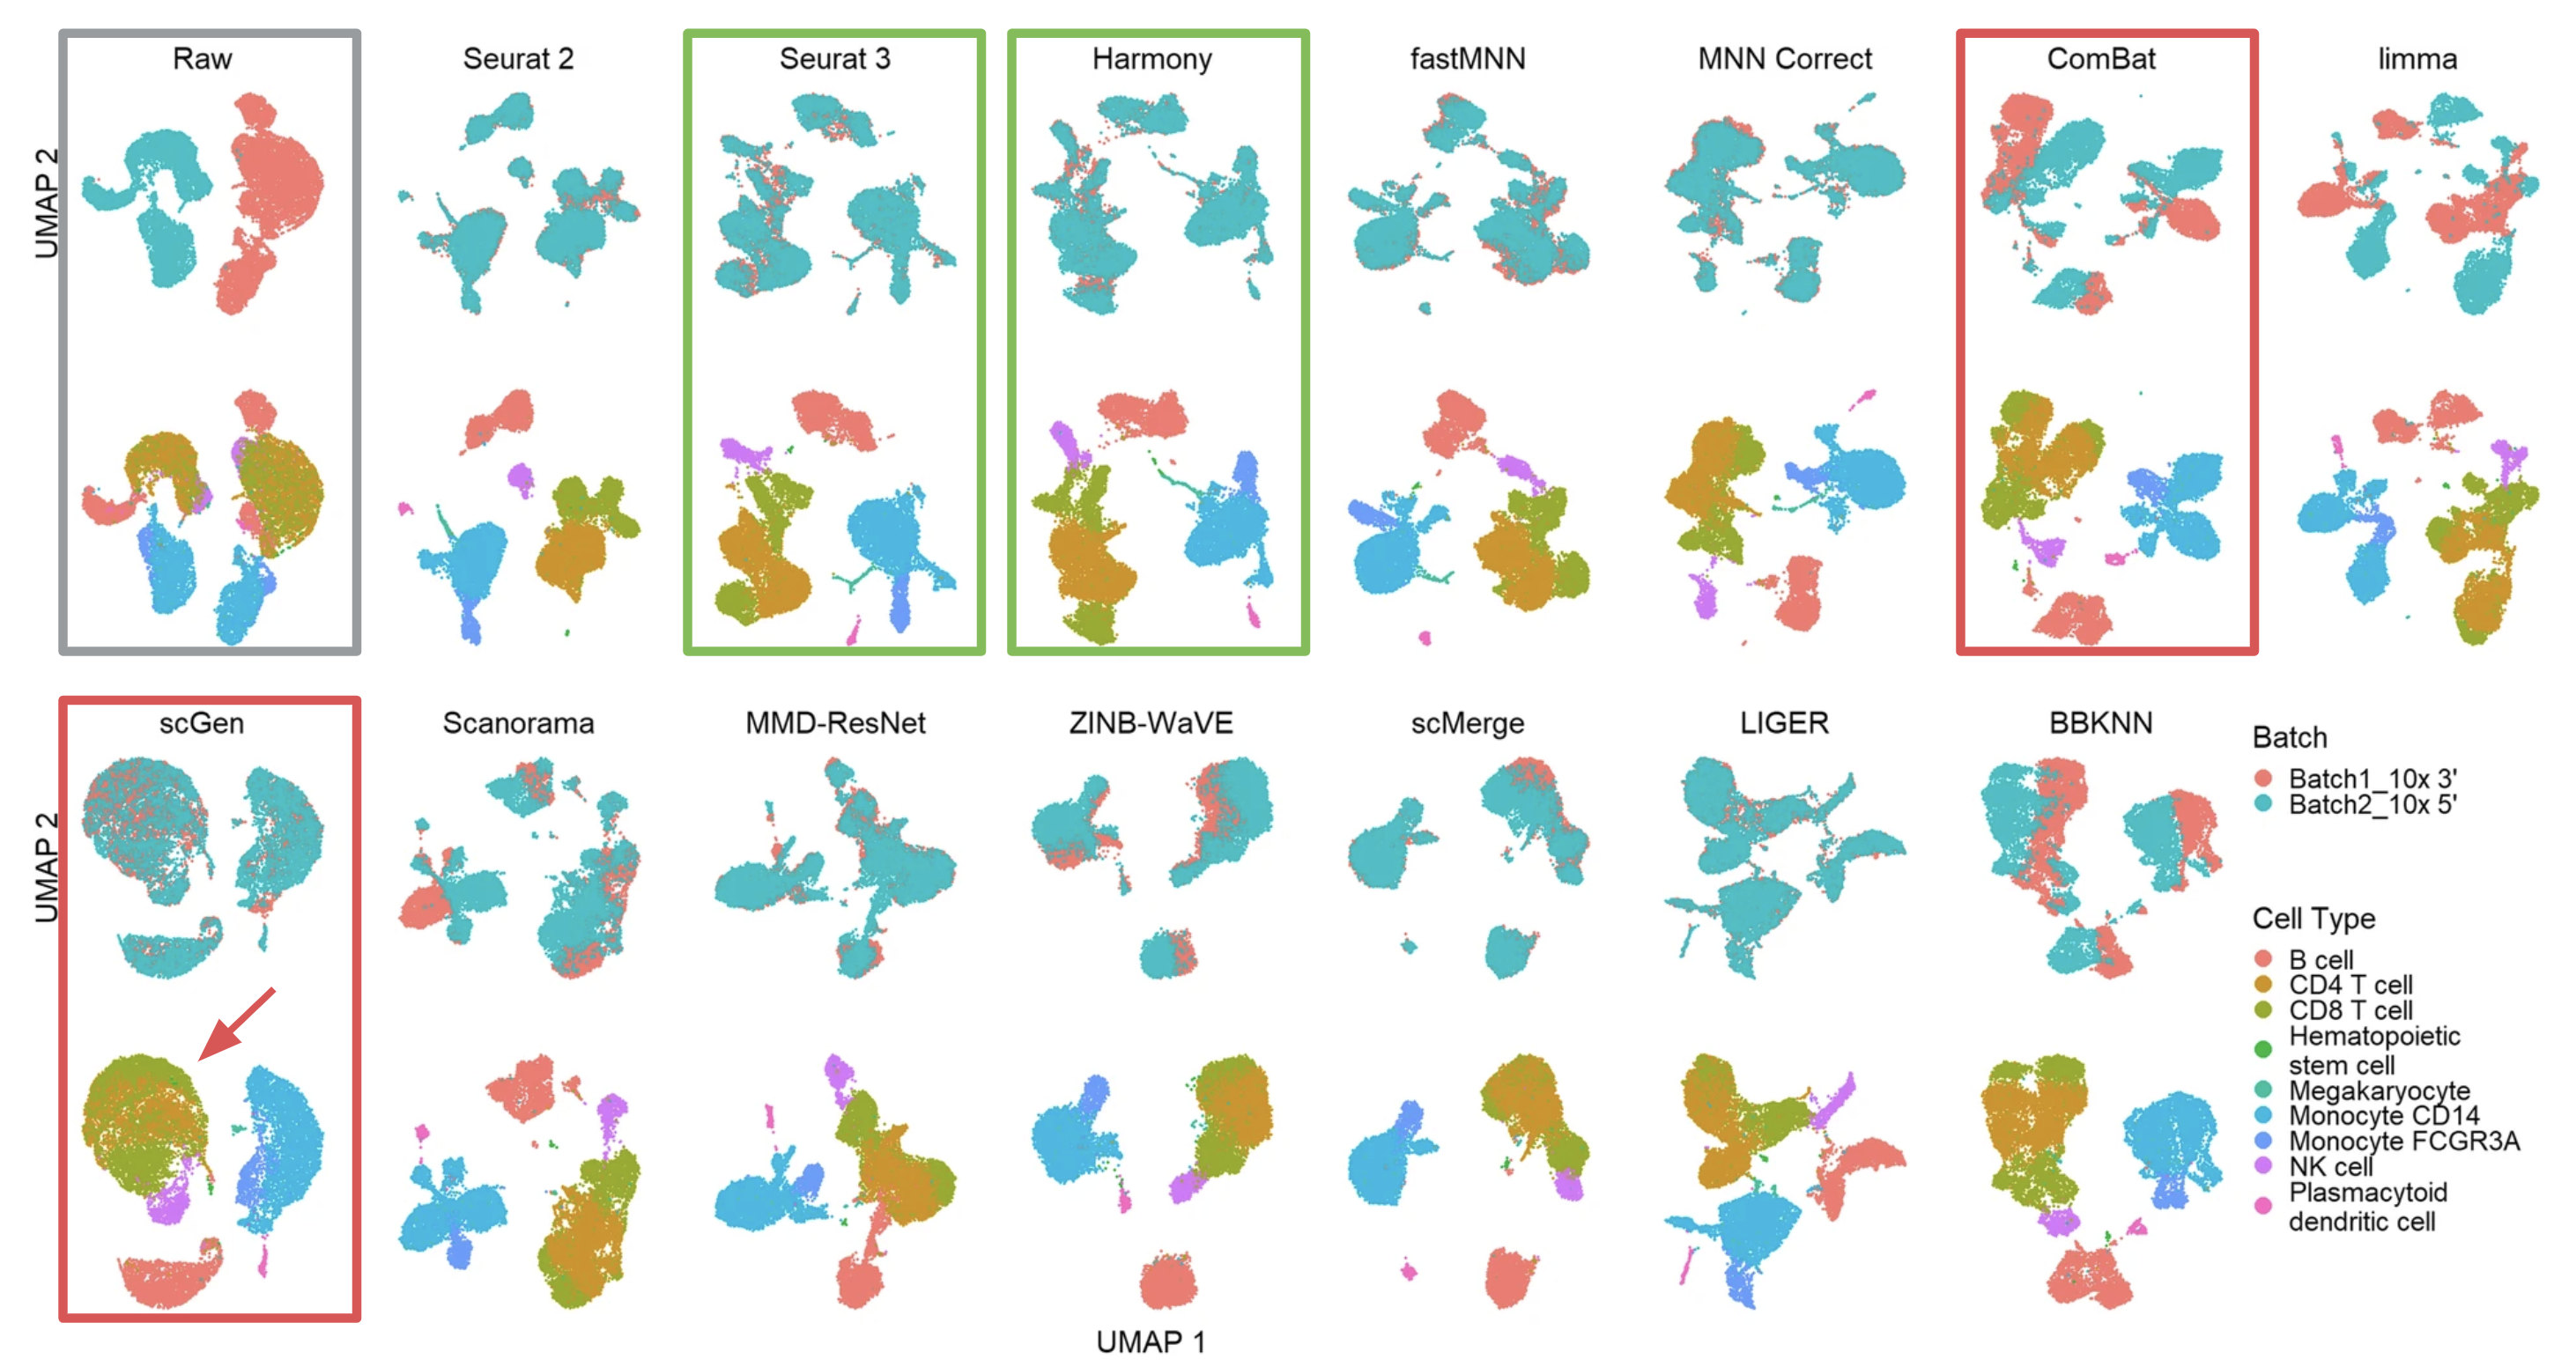
Figure 1 (adapted from Fig. 4 of the publication) Qualitative evaluation of methods using UMAP visualization for human PBMCs. The 14 methods are organized into two rows, with the name of the methods showing on top of each panel. Each panel contains two UMAP plots. Cells are colored by batches in the first plot and colored by cell type in the second.
To learn more about batch effect correction, please see this introduction: Batch effect correction.