A more precise way to find the needle in the haystack: Identifying rare biology with Xenium In Situ

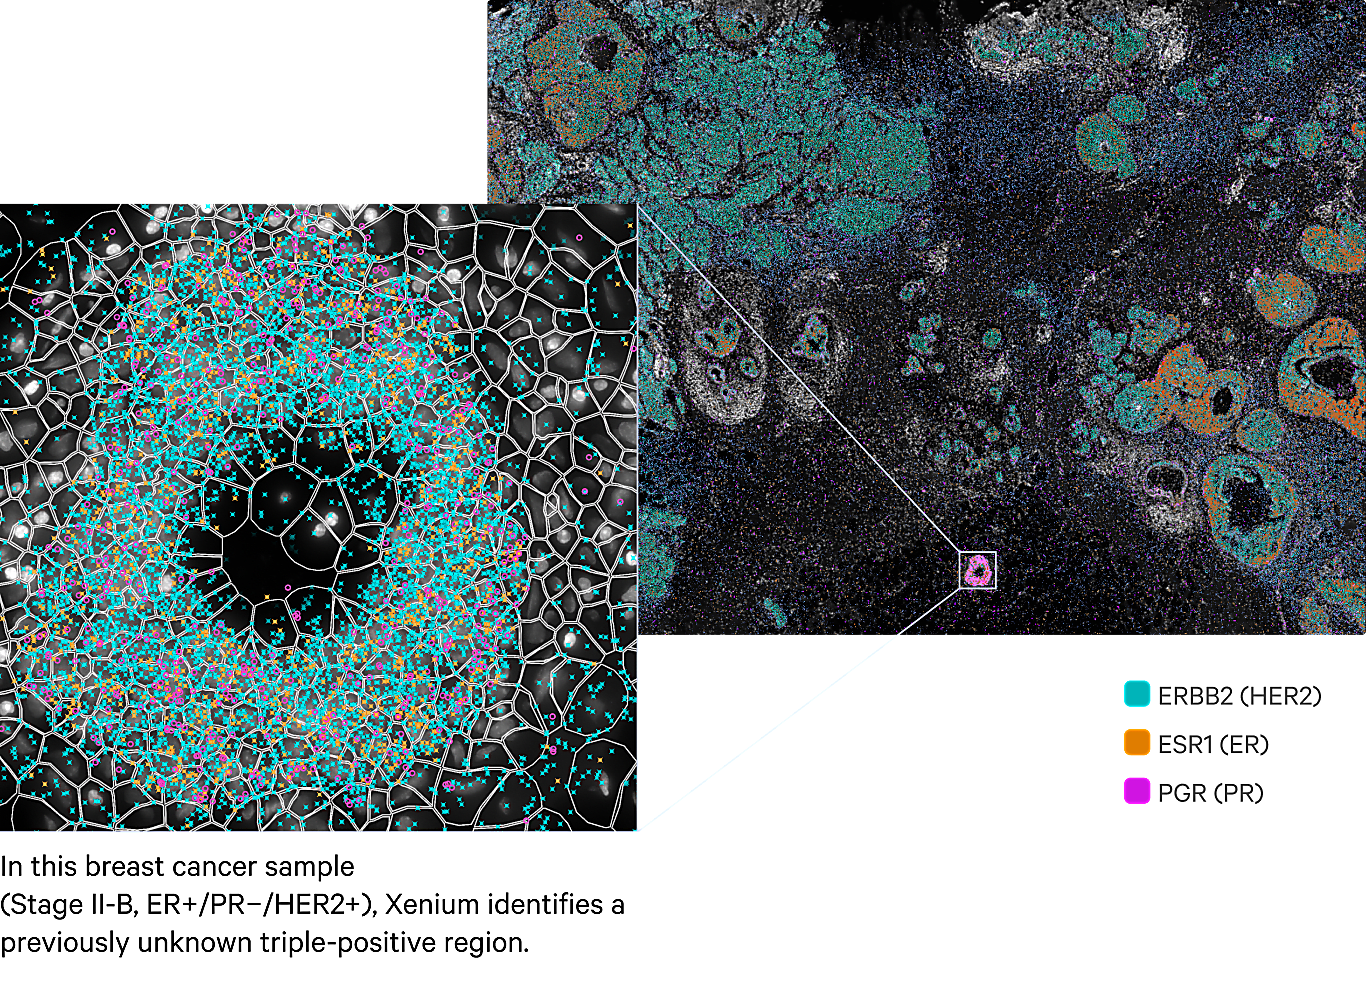
*Impact at a glance: It's easy to miss the subtle heterogeneity hidden in complex tumor microenvironments, like the small triple-positive region in the breast cancer sample pictured below. But seeing this biology could be the difference between knowing if a tumor will remain benign or turn invasive. Xenium In Situ not only uncovered this rare region, but provided detailed single cell spatial analysis of three distinct tumor subtypes with vastly different cellular microenvironments across the whole tumor section.*
Explore these findings, published in Nature Communications, in greater detail in this blog.
Two seemingly identical tumors. One tumor remains non-invasive and relatively innocuous. The second becomes invasive and turns into an aggressive cancer.
Why? The simple answer is heterogeneity, but there is nothing simple about heterogeneity.
Capturing heterogeneity
While cancer has some of the most notorious examples, inter- and intra-patient heterogeneity is a complication of all diseases. In fact, cellular heterogeneity is necessary for the vast majority of human biological functions even in health.
Assessing this heterogeneity is complicated by several challenges. First, small molecular fluctuations can lead to large functional changes (1). Additionally, heterogeneity at the genomic level may not translate to the transcriptomic, proteomic, or structural levels—and vice versa (2). Furthermore, spatial context can greatly influence heterogeneity (3).
Heterogeneity has been difficult to dissect with legacy methods, but integrating the powerful resolution of single cell data with the morphological context provided by spatial transcriptomic data has allowed researchers to make great strides in capturing drivers of this complex biology. This approach is computationally heavy and still relies on inference rather than direct observation. While these whole transcriptome analyses are great for discovery, examining the genes of interest these methods uncover in greater detail is still necessary to gain a true understanding of their significance.
So what if there was a way to combine the power of single cell resolution with the morphological context of spatial gene expression in a single experiment?
Identifying rare cancer biology: A case study made possible by Xenium In Situ
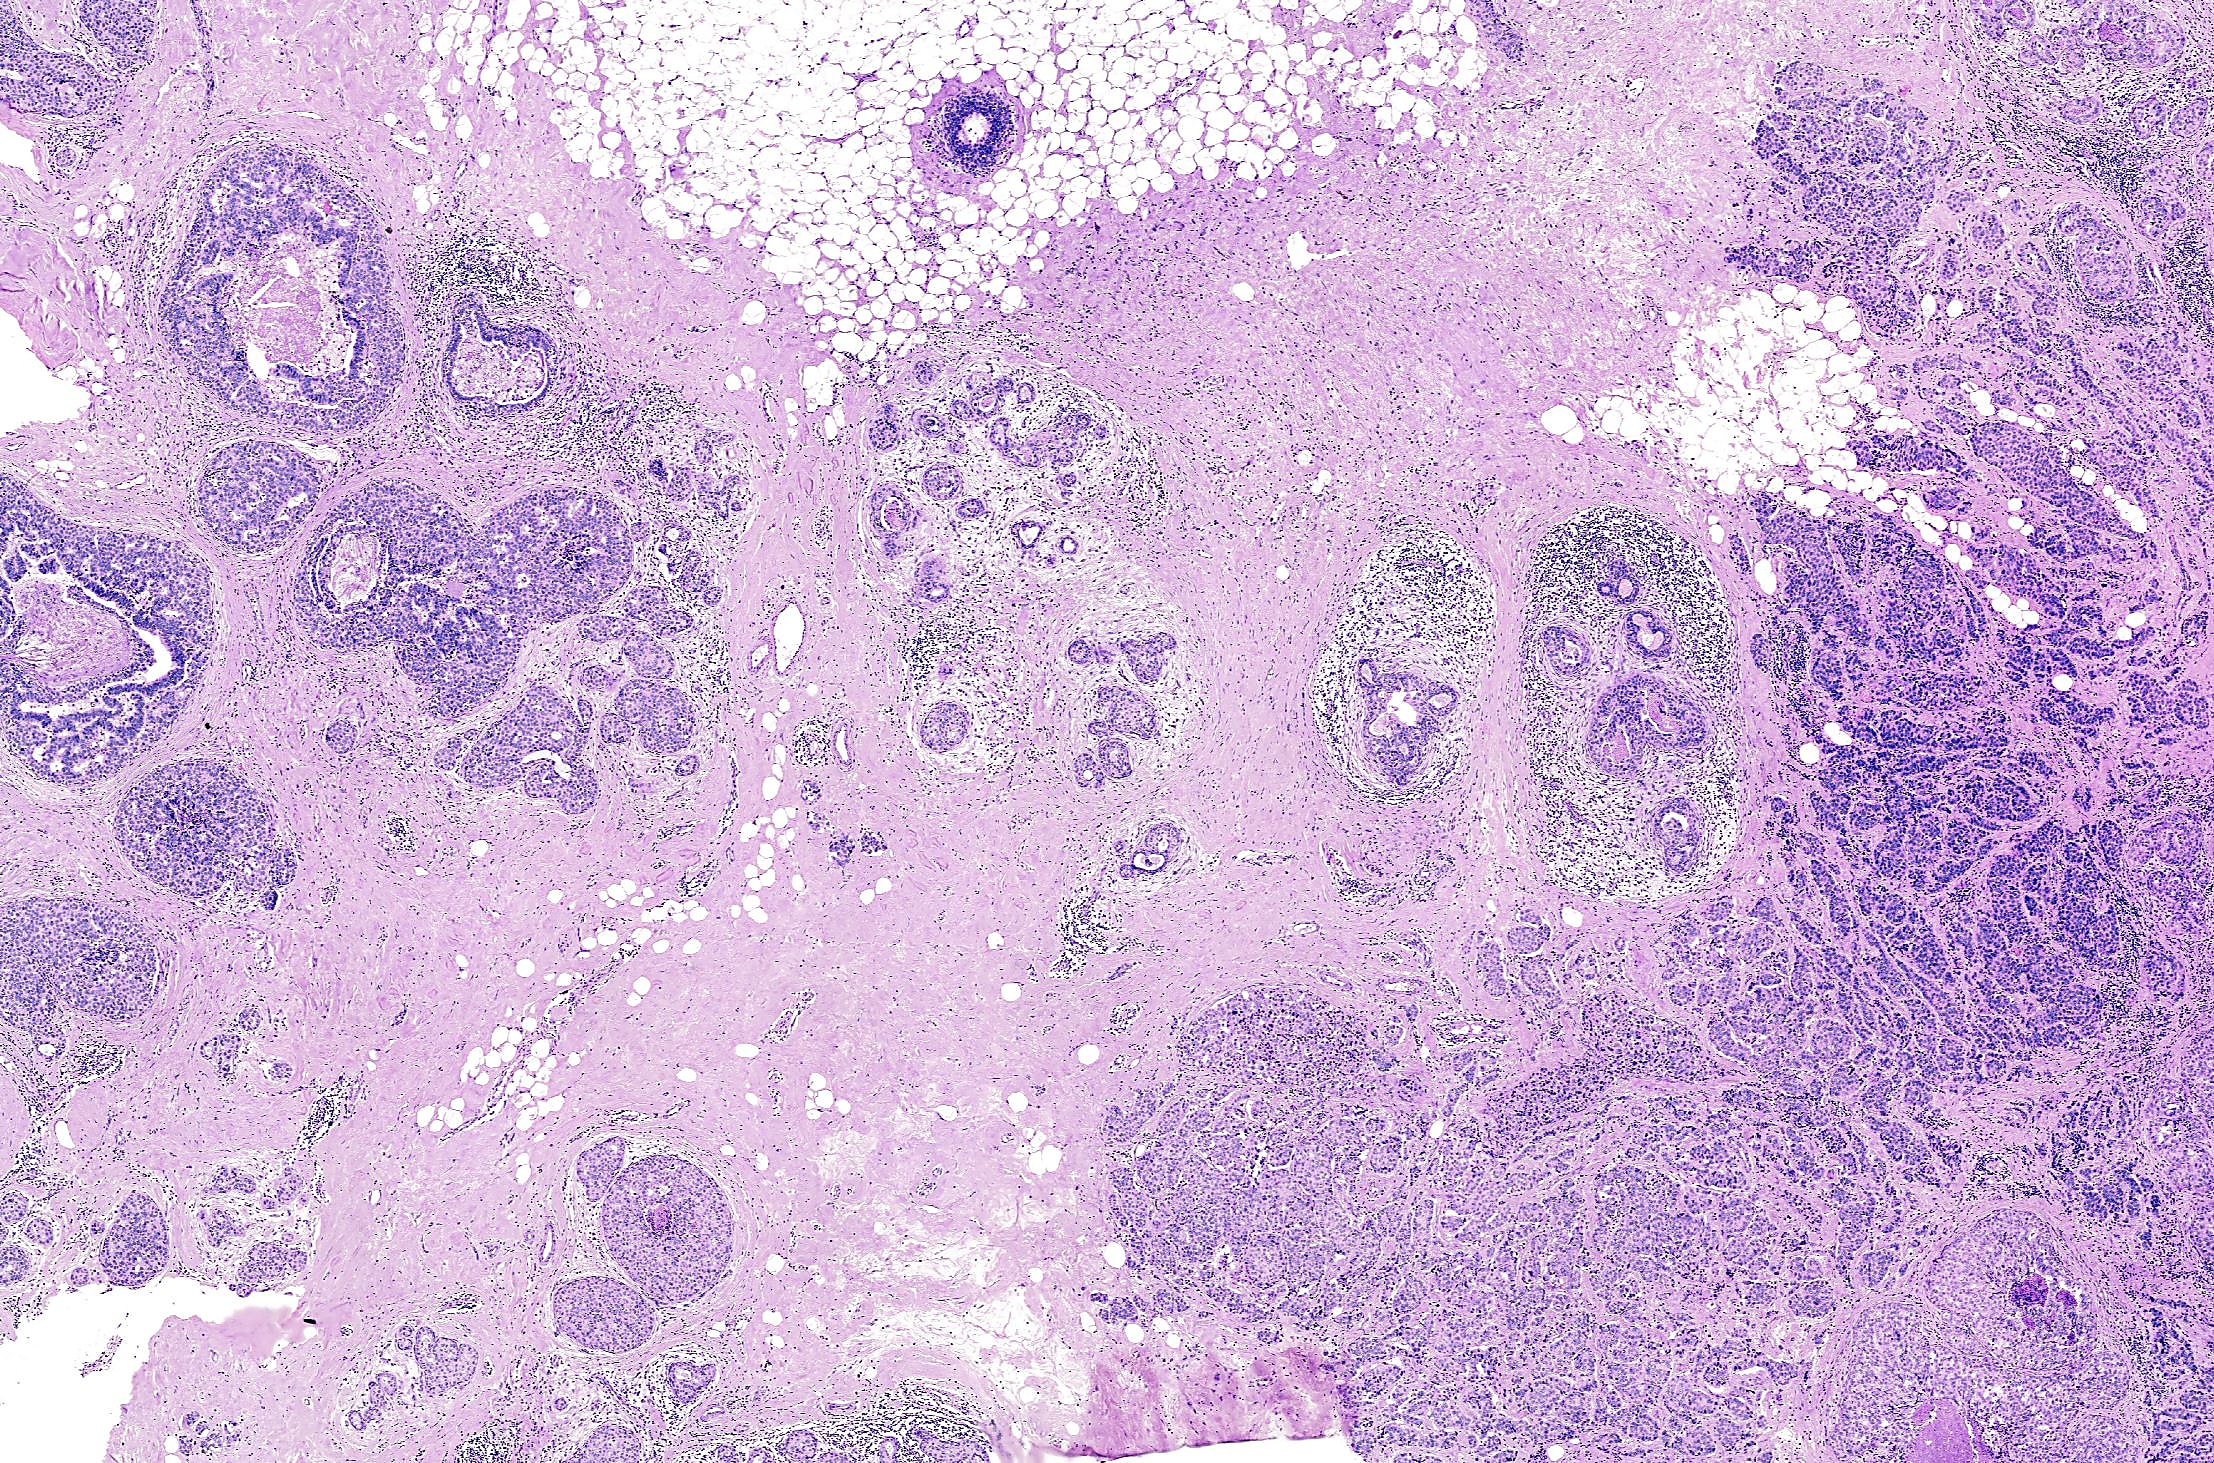
Imagine you're a researcher and the following ductal carcinoma in situ (DCIS) sample comes across your bench along with the opportunity to analyze it with Xenium In Situ.
What does your analysis reveal?
Based on traditional histopathology assessment with H&E staining, this breast mass core biopsy was annotated as HER2+/ER+/PR- (4). In other words, the sample expresses the human epidermal growth factor receptor 2 (HER2/ERBB2) and estrogen receptor (ER/ESR1) but does not express the progesterone receptor (PR/PGR).
To generate the subcellular gene expression map, highly specific and sensitive circularizable padlock probes are used to detect RNA transcripts of interest. This sample was processed with a Xenium human breast gene panel containing probes for 313 genes reflecting tumorigenic and healthy human breast tissue states previously described in single cell atlas data (5–7).
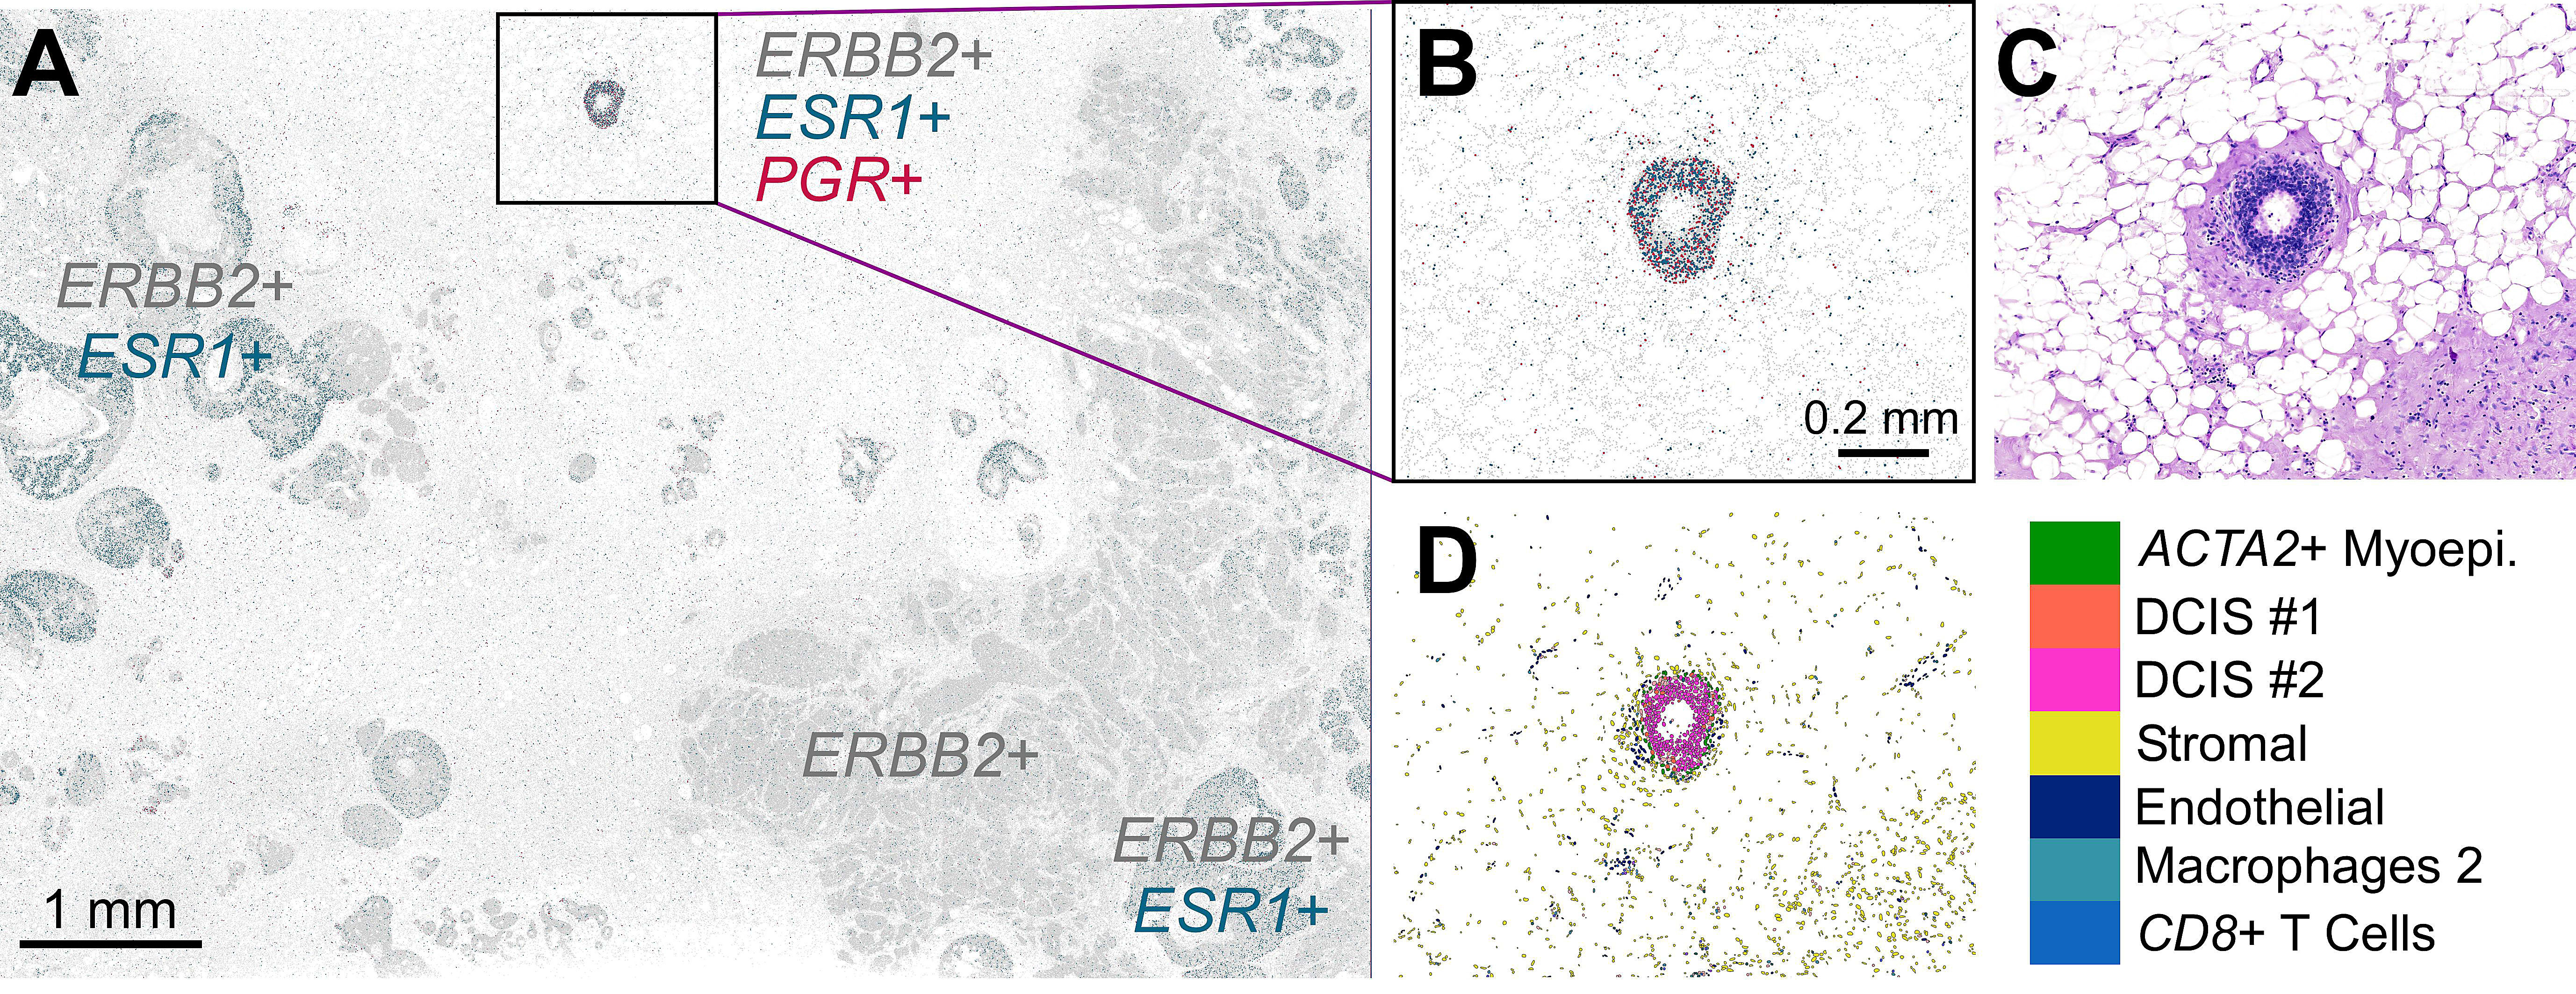
Reviewing the expression of ESR1, ERBB2, and PGR in the Xenium spatial plot shown in Figure 2A revealed that much of the analyzed tissue section expresses both ERBB2 and ESR1 transcripts (HER2/ER double positive) or just ERBB2 transcripts (HER2 positive).
However, Xenium also revealed a small region—approximately 5.5 mm x 7.5 mm—with triple-positive expression of ERBB2, ESR1, and PGR transcripts (HER2+/ER+/PR+; Figure 2A–D). Given the use of receptor status for predicting patient prognosis and considering treatment strategies (8–9), the importance of having the ability to identify this unique triple-positive region cannot be stressed enough.
On locating the proverbial needle in the haystack: How Xenium In Situ detected this rare biology
To comprehensively study tissue biology, Xenium In Situ combines powerful single molecule RNA detection with spatial decoding technology to rapidly detect 100s–1,000s of RNA targets at subcellular resolution across entire tissue sections. This type of analysis enables studies to not only locate and type cells within their biological context, but also address questions about cell–cell communication, profile cellular microenvironments, and identify rare cell infiltration.
Xenium is able to deliver high specificity by leveraging unique four-factor authentication chemistry. Each target is identified using padlock probes which must:
- Have both arms stably hybridize to the target (Steps 1 & 2),
- Undergo ligation of the probe ends to each other, generating a circularized probe (Step 3),
- And, complete successful rolling circle amplification of this circularized probe (Step 4).
The approach is sensitive enough to distinguish between RNAs with high homology and detect lowly expressed transcripts. The combination of Xenium’s highly sensitive chemistry and subcellular spatial resolution were critical for the detection of this triple-positive area.
For detection, fluorescently labeled probes are automatically cycled in, incubated, imaged, and removed by the instrument. Upon completion of the instrument run, the data is integrated, building a spatial map of the transcripts across the entire tissue section.
Xenium’s profiling of the entire tissue section at high resolution is another important element that contributed to the identification of this area. The triple-positive region was roughly 0.1 mm2 of the total 42 mm2 processed for this analysis. The sparsity of this region would be a challenge for non-targeted and/or low resolution methods. Furthermore, since some spatial technologies profile only regions of interest pre-selected before the experiment, such a small region could have been easily overlooked as there was no previous way to know that it contained unique biology.
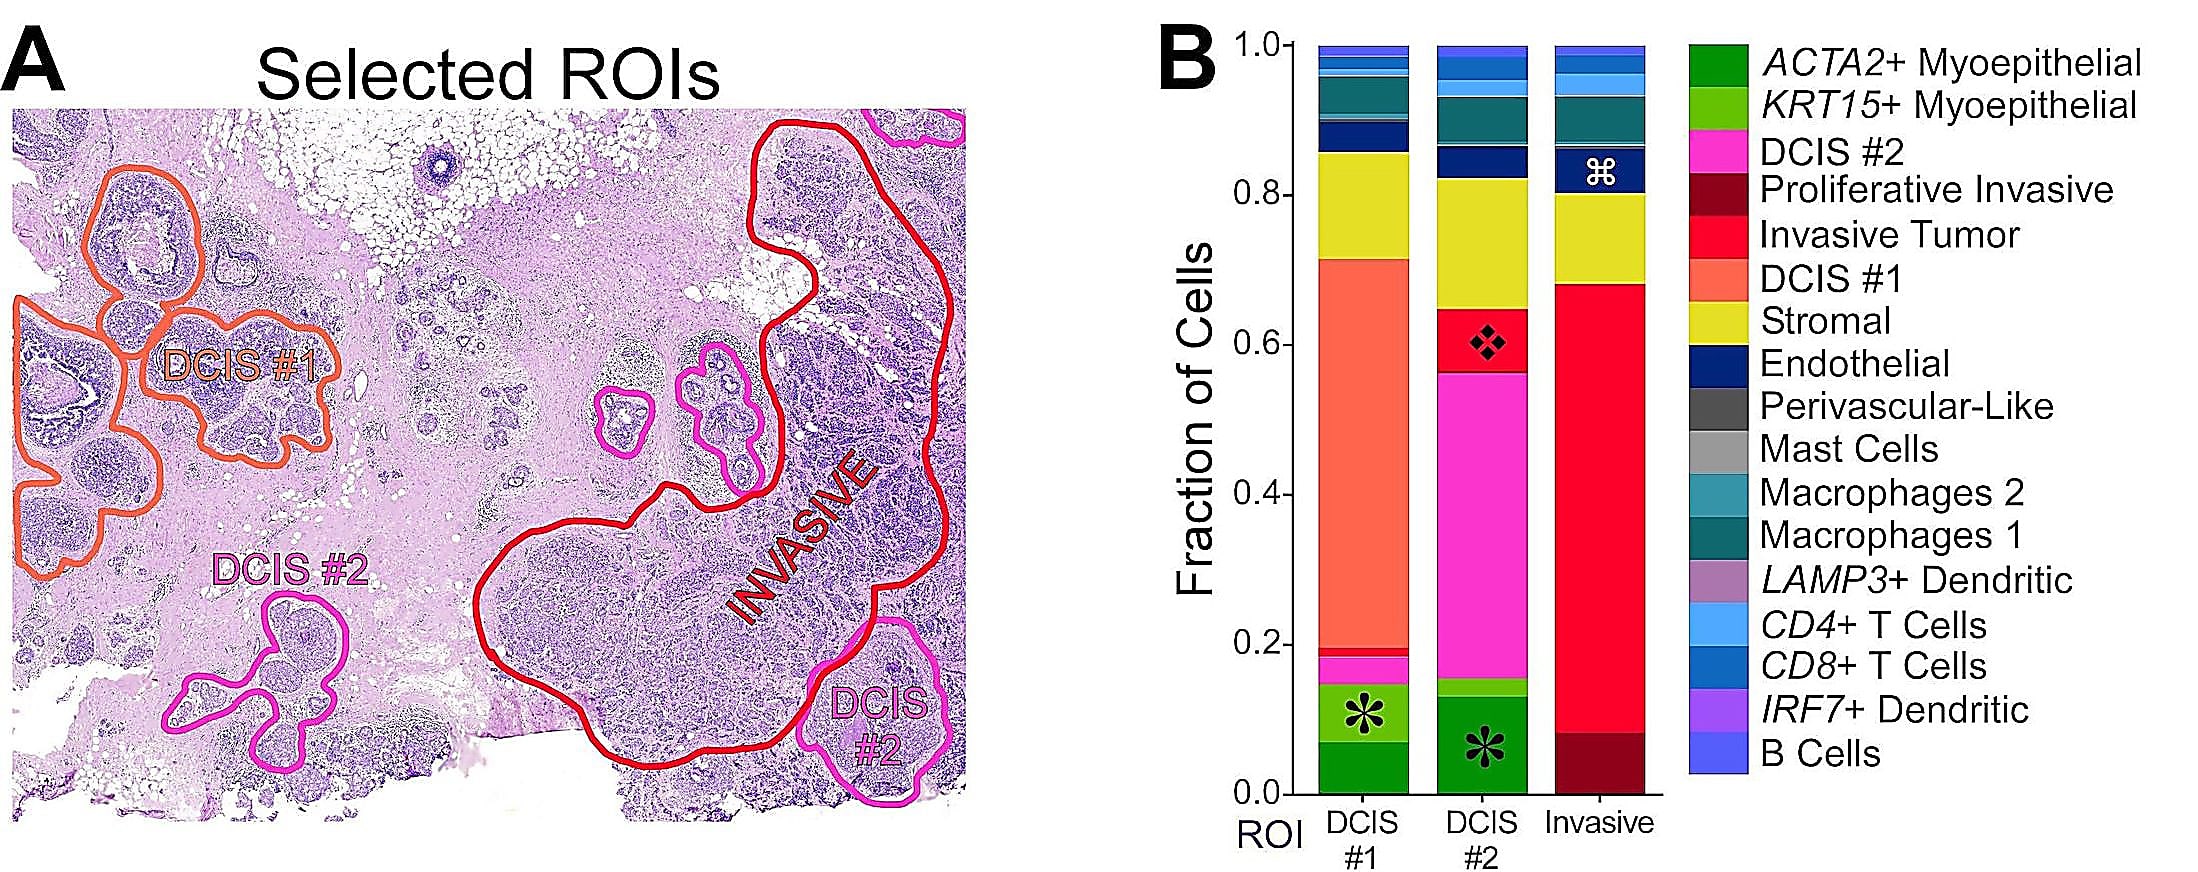
Detailed analysis of this section revealed three distinct tumor subtypes with vastly different cellular microenvironments (Figure 3). Xenium was able to provide high-quality data derived from a highly heterogeneous biopsy across this full section, demonstrating its ability to tackle challenging tissue types.
Another powerful advantage of Xenium In Situ is the ability to perform immunofluorescence staining on the same tissue section following a Xenium run (Figure 4). This capability is possible because the non-destructive on-instrument biochemistry and decoding cycles preserve protein epitopes. While some spatial technologies offer analysis RNA and protein expression, many require serial slides to be used for the separate analyte types, which prevents simultaneous visualization of the analytes at scale. Tissue integrity is also preserved during Xenium processing which means H&E staining is possible post-Xenium processing as well (Figure 2C). Having access to tissue histopathology, protein expression, and gene expression data from the same tissue section allows for a much more comprehensive understanding of the sample's biology.
New discoveries are waiting
When investigating biology as complex as whether a tumor will remain benign or turn invasive, finding a needle in a haystack may sometimes seem easier than deciphering the molecular mechanisms driving cancer. However, each new biological mechanism revealed has the potential to change how we diagnose, treat, and, one day, maybe even cure cancer.
Read more about this unique DCIS sample in our pre-print.
References:
- Chang AY & Marshall WF. Organelles – understanding noise and heterogeneity in cell biology at an intermediate scale. J Cell Sci 130: 819–826 (2017). doi: 10.1242/jcs.181024
- Goldman SL, et al. The impact of heterogeneity on single-cell sequencing. Front Genet 10: 8 (2019). doi: 10.3389/fgene.2019.00008
- Moses L & Pachter L. Museum of spatial transcriptomics. Nat Methods 19: 534–546 (2022). doi: 10.1038/s41592-022-01409-2
- Janesick A, et al. High resolution mapping of the breast cancer tumor microenvironment using integrated single cell, spatial and in situ analysis of FFPE tissue. bioRxiv (2022). doi: 10.1101/2022.10.06.510405
- Pal B, et al. A single-cell RNA expression atlas of normal, preneoplastic and tumorigenic states in the human breast. The EMBO Journal. 40: e107333 (2021). doi: 10.15252/embj.2020107333
- The American Cancer Society. (2021, November 8). Breast cancer hormone receptor status. Understanding a breast cancer diagnosis. Retrieved April 13, 2023, from https://www.cancer.org/cancer/breast-cancer/understanding-a-breast-cancer-diagnosis/breast-cancer-hormone-receptor-status.html
- Dunnwald LK, Rossing MA & Li CI. Hormone receptor status, tumor characteristics, and prognosis: a prospective cohort of breast cancer patients. Breast Cancer Res 9: R6 (2007). doi: 10.1186/bcr1639