Annotating single cell datasets: A Q&A covering challenges of automated and manual methods

Our complementary platforms, Chromium and Visium, have allowed scientists to produce multiomic, high-throughput single cell datasets, enabling visualization of the full richness of biological complexity. While 10x Genomics offers many resources for experimental planning and workflow optimization, these are only the first steps to a successful single cell run. Of equal importance is data analysis, and, for single cell gene expression experiments, that involves annotating, visualizing, and interpreting the data.
It’s a new year and, with that, a good time to step up your single cell experimental data analysis. In this blog post, we feature a conversation with our 10x Genomics colleagues in Canada and University of Toronto scientists Tallulah Andrews, PhD, a senior postdoctoral fellow with the MacParland lab, and her collaborators Zoe Clarke and Delaram Pouyabahar, both PhD students of computational biology in the Bader lab. They shared about a recently published tutorial (1) offering guidelines for annotating single cell transcriptomic maps using automated and manual methods, and provided answers to frequently asked questions about single cell data analysis. Read a summary of that Q&A below, then learn more with our analysis guides.
Is there a "go-to" place for getting good reference datasets? More specifically, do you have any suggestions for immune profiling data?
Gene Expression Omnibus (GEO), the Single Cell Expression Atlas, or cell atlas projects.
What can you do if you don't have a reference dataset when using automated methods?
There are other strategies you can use that we haven’t gotten to in the presentation. For instance, you can gather lists of markers that you know represent the cell types that you predict will exist in your sample and use automatic marker-based annotation tools. You can also make your own reference dataset if you are often working with the same type of cells and take the time to label a large, comprehensive dataset with high-quality labels. Then, you can compare the rest of your samples to this dataset.
Would that introduce a bias? This would assume your known markers are specific, which is rarely the case.
There is absolutely a bias! However, that is not always a bad thing, in the sense that if you are using a consistent protocol and a consistent species (i.e., generating your samples the same way every time), this may actually help the automatic tool label your cells correctly. That being said, if you incorrectly labeled your reference, the automatic tool would continue to propagate these errors. Therefore, it’s very important to try to find very good sets of marker genes or use a high-quality reference. All these things are easier said than done, but the more experiments that are done on a given cell type, the better the marker databases that exist become and the easier cell-type labeling should be.
Will an automatic annotation approach always label the cells/clusters, regardless of whether you're using an appropriate reference? In other words, if you're using an immune cell reference, will it always find what looks most like a T cell?
The use of high-quality references is very important and has a direct influence on the annotation. It’s also important to use a reference that is similar to the query dataset. If it is not available, you need to rely on marker-based annotation. There is a list of tools available in the paper that provide “unknown” as a label.
What pathway tools are you currently using?
Pathway tools are used to determine whether a set of genes in a given pathway are concordant or discordant between samples.
GSEA and GSVA were used in the MacParland et al paper (2). There are many more options, such as UCell, ssGSEA, and many more tools that are available, that are specifically designed for single cell data. GSEA and GSVA can be used on bulk RNA-seq data as well. Another popular online option is g:Profiler. To get these network visualizations, you can feed results from at least both GSEA and g:Profiler into Cytoscape, which you can also use to collapse redundant pathways.
Can cells of different biological states be annotated based on pathways, or is it better to annotate based on marker genes?
It’s often best to use a combination of information. Pathways are great because they combine sets of genes to allow you to predict the behavior of groups of cells, which is likely the most informative in determining cell state. However, there are also some key markers that exist that can potentially be just as informative, for instance, marker genes that tell you that a typically quiescent cell is actually activated. A lot depends on your sample or cell type(s) of interest.
Do you have recommendations for a good approach to annotate tumor cells?
Often, tumor samples are annotated first with a healthy reference, but then manual annotation is required to really understand the particular nuances of the sample (since tumors are so unique).
Have you tested both methods (labeling each cell individually before creating a cluster, and after creating a cluster)? Should we expect major differences between both methods?
There are different types of tools that label individual cells vs. clusters, and they each have their pros and cons. If you use a method that labels individual cells instead of clusters and have many similar cell subtypes in the reference, the cell-type labels may vary within a single cluster. Generally, automatic tools agree with each other for broad cell types, and much more variation is noticed as soon as you start looking at more similar cells (e.g., T-cell subtypes).
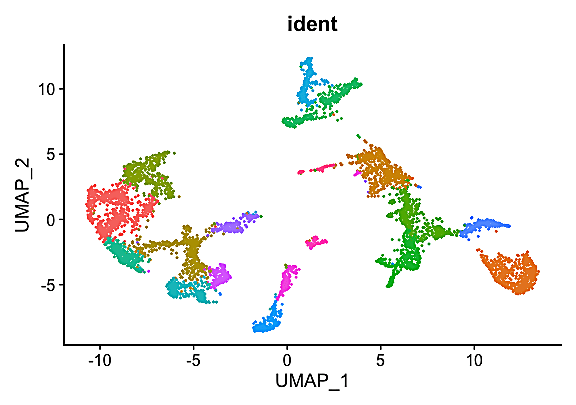
Which non-linear clustering method has superiority over another: UMAP or t-SNE?
t-SNE and UMAP are visualization approaches, so they do not explicitly cluster the cells. For visualization, UMAP is often preferred since it’s able to preserve the global relationship between the cells.
We first need to get the principal component analysis (PCA) and then run the dimension reduction for visualizing clusters. How do you calculate the differentially expressed genes (DEGs)? Do you prefer to use Wilcoxon, which is included in the Seurat or MAST package?
In our experience, the use of the Wilcoxon test could lead to “pseudoreplication bias.” MAST has an implementation of the linear mixed model, which has addressed this issue. NEBULA is another option for running the DE test, which has been recently published. It also utilizes linear mixed models similar to MAST. You can check these links for more info:
https://www.nature.com/articles/s41467-021-21038-1
https://www.nature.com/articles/s42003-021-02146-6
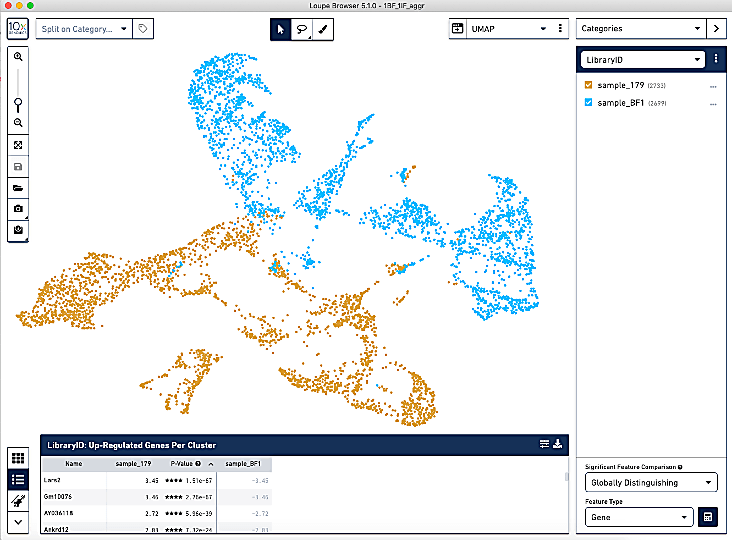
Other than looking at UMAP plots, how can you analyze batch effects? Is it necessary to remove batch effects if they are very subtle?
General good practice when looking for batch effects is to first scale and normalize your samples separately, merge them together, and then cluster and visualize this on a UMAP or t-SNE. If your cells are grouping mostly by cell type and not by sample, batch correction is not necessary. If you find your cells are mostly clustering by sample, then batch correction is recommended. Different batch correction methods have different effects. Harmony is very popular but is often criticized for over-correcting. Seurat RPCA is another great method.
How do you ensure you are not over-clustering or under-clustering your data?
It’s often good to look at the same dataset using different clustering resolutions. At the same clustering resolution, one cluster may break down into useful subtypes whereas other large, very similar clusters may over-cluster. In the end, it’s a bit of a balance, and you would likely want to optimize this in a way that you feel you can confidently label all or most of your clusters.
In my 10x Genomics single cell data, I see some cells in UMAP embedding that spread away from the clusters or are mixed with other cell-type clusters. Is there a recommendation for this?
That is a common issue. You could consider subclustering the data. You might want to evaluate if those are novel cell types or doublets.
Most of these approaches are designed to characterize intra-sample variations. What about inter-sample variations? What if the goal is to characterize the response of a tissue to conditions A vs. B? Do you process them independently and then compare?
There isn’t a full consensus in the field on which approach would be best. We often normalize the sample individually and then merge and integrate the results. The problem with integration is that it might remove the biological variation along with the technical variation, so separate analysis might be preferred in that case. You might want to consider alternative approaches to identify sources of variation in your data as well. Factor analysis and matrix factorization methods (PCA components, f-scLVM [factorial single-cell latent variable model], scCoGAPS [single-cell coordinated gene association in pattern sets], etc.) might also be useful to identify the hidden sources of variation within the merged datasets.
For more information on how you can kickstart your data analysis journey, visit our Resources section to find our collection of analysis guides.
References:
- Clarke ZA, et al. Tutorial: guidelines for annotating single-cell transcriptomic maps using automated and manual methods. Nat Protoc 16: 2749–2764 (2021). doi: 10.1038/s41596-021-00534-0
- MacParland SA, et al. Single cell RNA sequencing of human liver reveals distinct intrahepatic macrophage populations. Nat Commun 9: 4383 (2018). doi: 10.1038/s41467-018-06318-7