
Overview
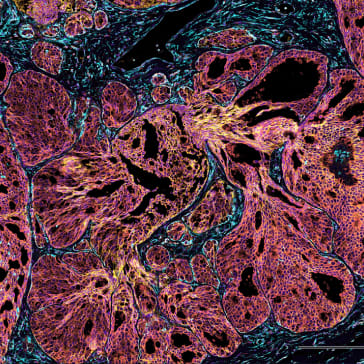
This human FFPE breast cancer data showcases results using the preproduction version of the Atera Whole Transcriptome Assay (WTA), which is currently under development. The assay was designed to closely match the Chromium Flex Apex assay in terms of content and sensitivity, and includes 18,028 genes. The number of probes per gene were optimized to maximize sensitivity of lowly expressed genes and avoid optical crowding risk for highly expressed genes. The 10x Genomics in situ multimodal cell segmentation solution was used to generate cell segmentation boundaries. Analysis from this dataset was presented in the AACR poster available here.
How to view data
Interactively explore this dataset with the web demo ("Open web demo" above), a preview of the upcoming desktop version of visualization software.
This preview dataset can also be opened in Xenium Explorer software (v4.1.1), but you may experience performance issues due to the large dataset size. See the Getting Started with Xenium Explorer page for general guidance navigating the web demo interface and these instructions to explore the aligned H&E image in the demo.
Download the files to explore further on your desktop. This preview dataset was converted to closely resemble Xenium Onboard Analysis v4 file formats for compatibility with existing analysis packages. It has been tested with seurat v5.4.0, scanpy v1.12.0, and spatialdata v0.7.2 + spatialdata_io v0.6.0. However due to minor differences in formats, it is not compatible with Xenium Ranger and not guaranteed to be compatible with other untested community-developed tools. Atera's official output data format will be optimized to integrate with the broader bioinformatics ecosystem and reduce data management overhead. Future Atera data releases will showcase the new file format to help customers transition.
Biomaterials
FFPE tissue blocks were purchased from BioIVT (breast cancer, DCIS: G3 (T1c N0 M0)).
Analysis metrics
| Metric | Breast Cancer |
|---|---|
| Median transcripts per cell | 2,116 |
| Cells detected | 170,057 |
| Nuclear transcripts per 100 µm² | 4,549.2 |
| Total high quality decoded transcripts | 624,095,990 |
| Region area (µm²) | 58,944,371.2 |
Custom Cell Groups
Differentially expressed genes from the graph-based clustering results were exported to annotate cell types. Major cell groups were annotated based on Kumar et al. (2023). High-grade versus low-grade DCIS (ductal carcinoma in situ) tumor cells were annotated based on molecular markers, myoepithelial cell number, and spatial localization. Similarly, cancer-associated fibroblasts (CAFs; low-grade or high-grade DCIS-associated) were annotated based on their spatial location. H&E proved insufficient for identifying structured basal-like DCIS which was staged as 'normal' by a pathologist, therefore, we exclusively utilized molecular markers. Cycling cells were validated using the CellCycleScoring function in Seurat. Apocrine cells were identified by histology and PIP expression (encodes prolactin-induced protein). High-grade 11q13-positive DCIS cells were identified by high collective expression of genes found on the 11q13 locus.
Custom Gene Groups
For the 11q13 Amplicon gene group, we list 12 genes located within the 11q13 chromosomal locus that are upregulated in high-grade DCIS cells. For all other gene groups, marker genes were derived from differential expression results generated by graph-based clustering. Genes were ranked using a composite score of log2(fold change) × log2(mean counts + 1), retaining only genes with an adjusted p-value < 0.05. For immune cell types, the resulting ranked lists were further refined against published literature and cell atlas resources to retain only markers with established specificity for the relevant cell type.