The cellranger multi algorithm processes Chromium Single Cell 5' with Feature Barcode Technology for Barcode Enabled Antigen Mapping (BEAM)/Antigen Capture, Gene Expression, V(D)J, and Antibody Capture libraries simultaneously. This page describes the unique aspects of the multi algorithm designed to process Antigen Capture libraries.
Cell calling is the process of finding and assigning 10x Barcodes as cell-associated or cellular barcodes (vs. background/noise barcodes).
Initially, the identification of cellular barcodes takes place independently for Gene expression and V(D)J libraries generated from a single Gel Beads-in-emulsion (GEM) well. The cellular barcodes identified in the Gene Expression library are then used to inform the cellular barcodes identified in the V(D)J library. Specifically, any barcodes that were not assigned as cells in the Gene Expression library are filtered out of the V(D)J library as well, making V(D)J cells a subset of the gene expression cells.
This process prevents background or empty barcodes from being identified as T/B cells and helps make V(D)J cell calling more accurate. You can learn more about cellranger multi cell calling in the Why use multi? section of the cellranger multi pipeline page.
Occasionally, during sample processing for Antigen Capture and Antibody Capture library creation, proteins may clump together nonspecifically to form large aggregate molecules. Any GEMs that contain these aggregated molecules will have unusually large UMI counts.
Since the protein aggregates are nonspecific, barcodes affected by antigen or antibody aggregates must be removed. This 10x Genomics Knowledge Base article describes why you may observe a high fraction of reads coming from barcodes with high UMI counts.
In Cell Ranger, aggregate detection happens before cell calling; any barcodes associated with aggregation are removed and the remaining barcodes go through cell calling.
During aggregate detection, the algorithm selects the top 100 cell barcodes with the highest antigen UMIs. Outliers are then identified and filtered out from this set of 100 barcodes based on the interquartile range (IQR) of:
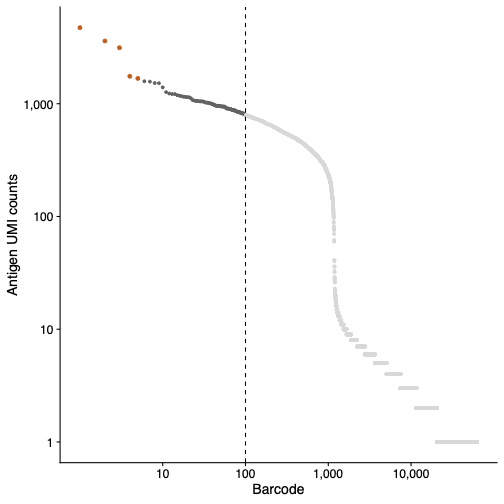
Antigen aggregates can be seen as a sharp beak at the top of the antigen barcode rank plot reported in the Antigen tab (Libraries section) of the web_summary.html. Refer to the antigen barcode rank plot in your web summary to QC your data for antigen aggregates.
This example antigen barcode rank plot (below) has been annotated with a dotted line to show the first 100 barcodes. The aggregate barcodes removed by the antigen aggregate detection algorithm are shown in orange.
Aggregate barcodes are reported in the aggregate_barcodes.csv file located in the per_samples_outs/sample_name/count directory. Aggregate barcodes are retained in the raw_feature_bc_matrix.
Please note:
- The sample_filtered_feature_bc_matrix and the Loupe Browser compatible .cloupe file are computed only with cellular barcodes.
- Antigen specificity scores are not calculated for aggregate barcodes. They are calculated only for cellular barcodes in the Gene Expression library (all of which are present in the feature-barcode matrix and the
.cloupefile). - The Loupe V(D)J Browser compatible .vloupe file is created for all the cellular barcodes in the V(D)J library (which is a subset of the cellular barcodes in the Gene Expression library).
Although both antigen and antibody aggregates are reported in the same CSV file (aggregate_barcodes.csv), the process of detecting and filtering out antigen aggregates is different from that used for antibody aggregates.
The antigen specificity score is the likelihood of an antigen binding to a specific receptor compared to the negative control. Cell Ranger uses a beta distribution to model the probability that a given T or B cell receptor is biased towards binding a particular antigen versus the negative control. This probability is calculated for a confidence level of 0.925 or more.
Mathematically, the antigen specificity score is calculated using the expression:
Where beta.cdf is the cumulative distribution function of the beta distribution, AntigenUMI is the UMI count for the target antigen, and ControlUMI is the UMI count for the negative control. Pseudo counts of +1 and +3 are added to the antigen and control UMI counts, respectively, because the beta distribution is undefined when UMI counts are 0.
The cumulative probability distribution function for a few different antigen-negative control UMI counts is shown below:
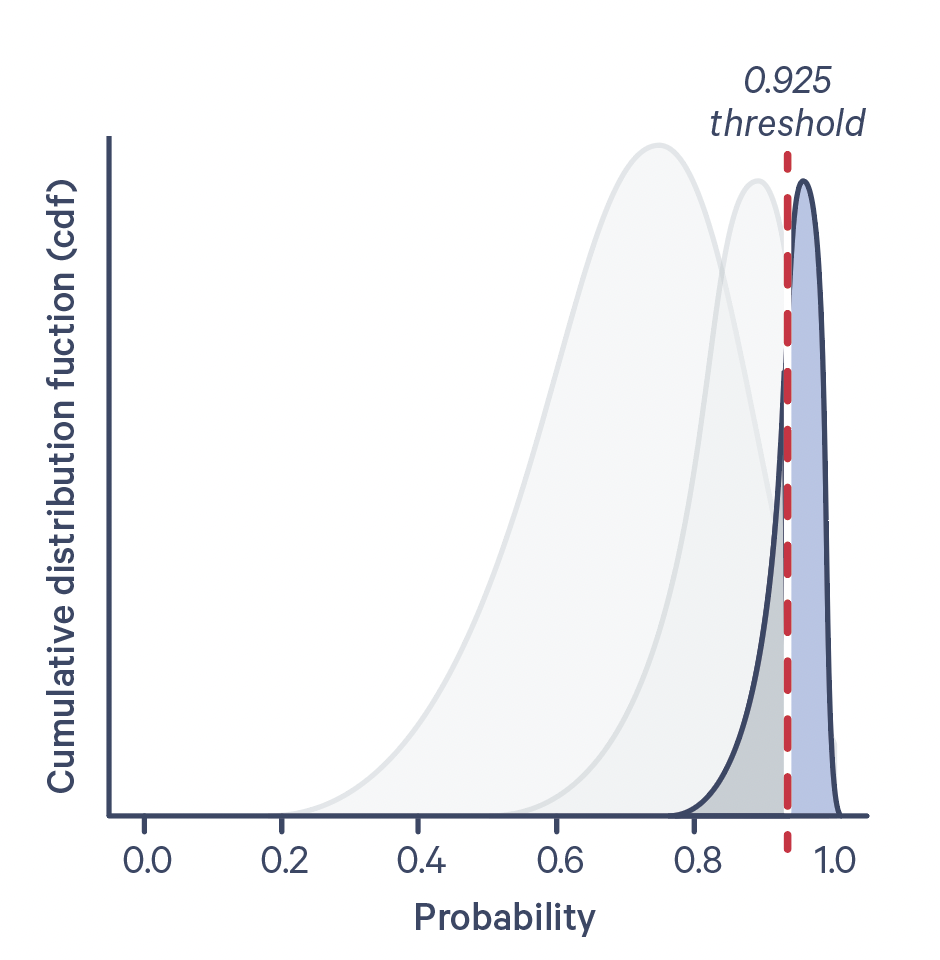
Confidence level is plotted on the X-axis, and the dotted line corresponds to a confidence level of 0.925. The antigen specificity score is the numerical value of the area under the curve, to the right of the dotted line.
Please note:
- An antigen specificity score is calculated per cell barcode for each antigen-negative control pair specified in the Feature Reference CSV and multi config CSV.
- A given cell can have high antigen specificity scores for more than one antigen.
- Antigen specificity scores are not calculated if a negative control antigen is not specified.
Properties of the antigen specificity score
- Antigen specificity scores tend to cluster at the extremes (~0 or 100).
- Cells with larger UMI support tend to have higher antigen specificity scores. For a given antigen UMI:control UMI ratio, the confidence in the probability that a receptor binds to the antigen versus negative control is higher for cells with a larger number of UMIs.
- For cells with zero antigen or control UMIs, the pseudo counts of 1 and 3 (see mathematical equation above) add a small residual value. These residual values should be ignored as they are biologically meaningless.
Antigen specificity score is not a measure of antigen affinity or avidity
Immunologists describe the binding strength of an antigen in terms of antigen affinity and antigen avidity. Antigen affinity is the strength of interaction between the antigen and its T or B cell receptor at a singular binding site. Antigen avidity is a measure of the overall strength of interaction between an antigen and its receptor, summed across all points of interaction.
Cell Ranger's antigen specificity score indicates whether or not a given T or B cell receptor associates with an antigen. The antigen specificity score is not a measure of binding strength, and therefore, cannot be used as a proxy for antigen avidity or affinity.
Antigen specificity score output file and documentation
Cell Ranger outputs antigen specificity scores in a CSV file called antigen_specificity_scores.csv. It is located in the outs/ folder, here: /outs/per_sample_outs/sample_name/antigen_analysis/antigen_specificity_scores.csv.