The goal of cell segmentation is to approximate boundaries between cells so that transcripts can be assigned to cells. Downstream, these results will be used to produce a cell-feature matrix, similar to those output by existing single cell and spatial technologies.
These segmentation algorithms are supported for the following assays depending on whether Cell Segmentation Staining is used (algorithms apply for both Xenium v1 and Xenium Prime chemistries):
| Xenium In Situ assay | Nucleus segmentation | Cell segmentation |
|---|---|---|
| Gene Expression + Cell Segmentation Staining | DAPI-based | Multimodal |
| Gene Expression | DAPI-based | Nuclear expansion |
The first step is to detect the locations of nuclei using the DAPI images and a custom neural network for nucleus segmentation. The neural network is trained on thousands of manually labeled image patches covering multiple tissue types. Any nucleus that has 95% or more of its pixel intensity lower than an intensity threshold of 15 photoelectrons (pe) will be removed for deconvolved DAPI images and 105 pe for the DAPI Z-stack.
Prior to XOA v4.0, nucleus segmentation was performed on each Z-slice of the DAPI Z-stack. In XOA v4.0, the nucleus segmentation algorithm prioritizes using the DAPI and 18S rRNA marker (when Cell Segmentation Staining workflow used) 2D global focus map images, and is supplemented by the 3D DAPI Z-stack results. This step enables better detection of nuclei in regions with saturated DAPI signal.
Here is an example of the nucleus and cell boundaries from a mouse retina dataset† before and after analyzing with the XOA v4.0 nucleus segmentation algorithm. Nucleus boundaries are in red and cell boundaries are colored by segmentation method.
| Description | Example in Xenium Explorer |
|---|---|
| Nuclear morphology image (2D, DAPI) | 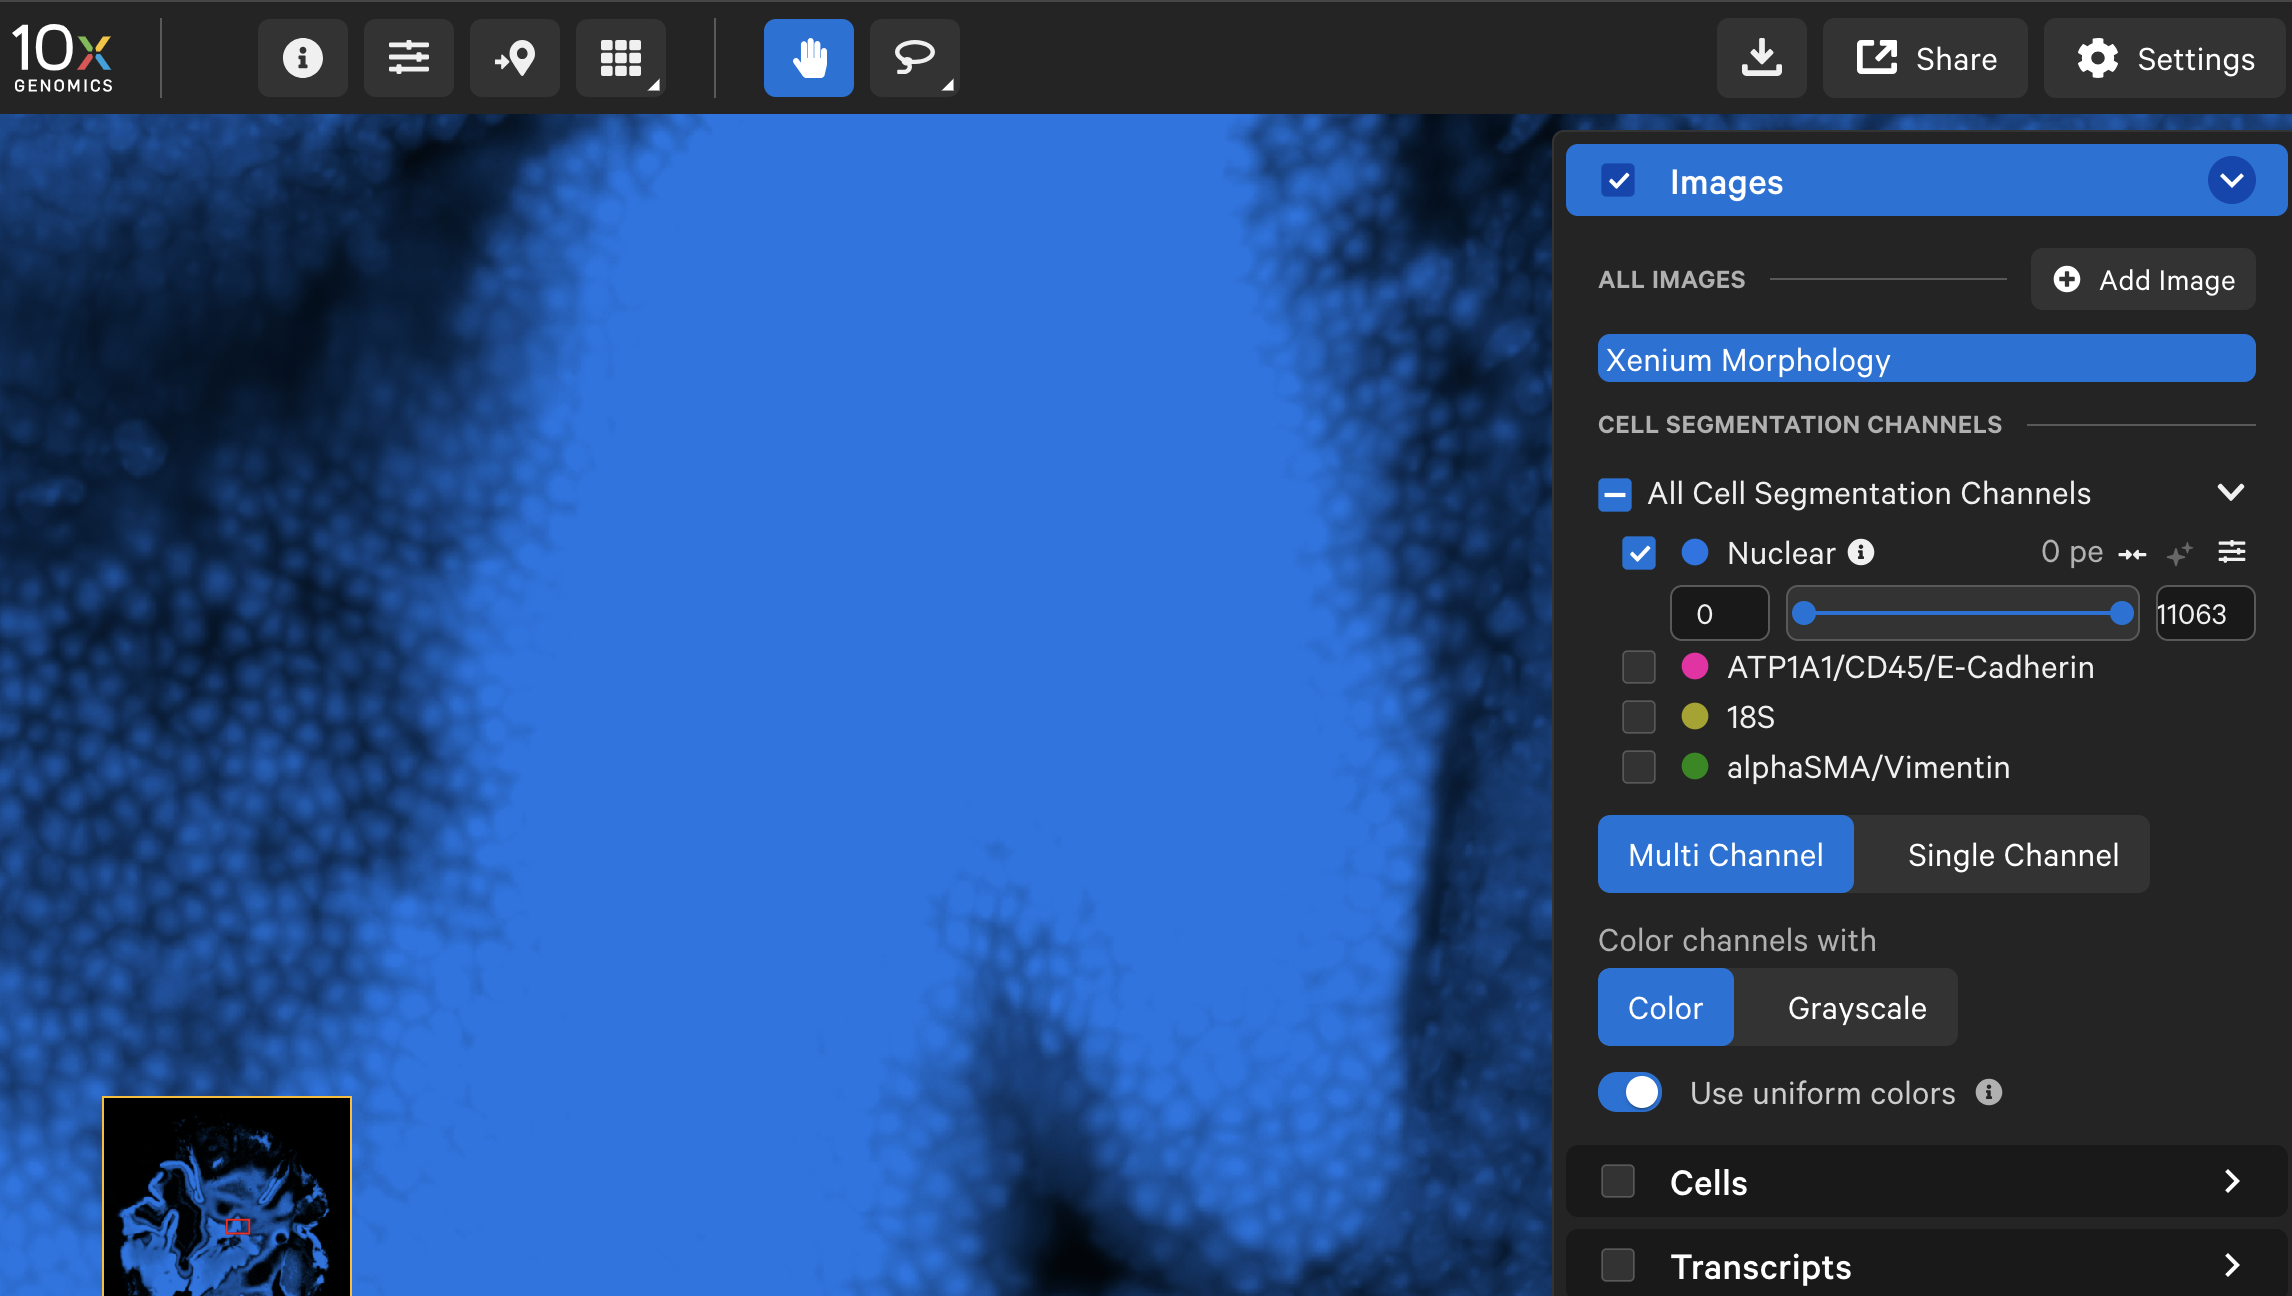 |
| Interior RNA morphology image (18S) | 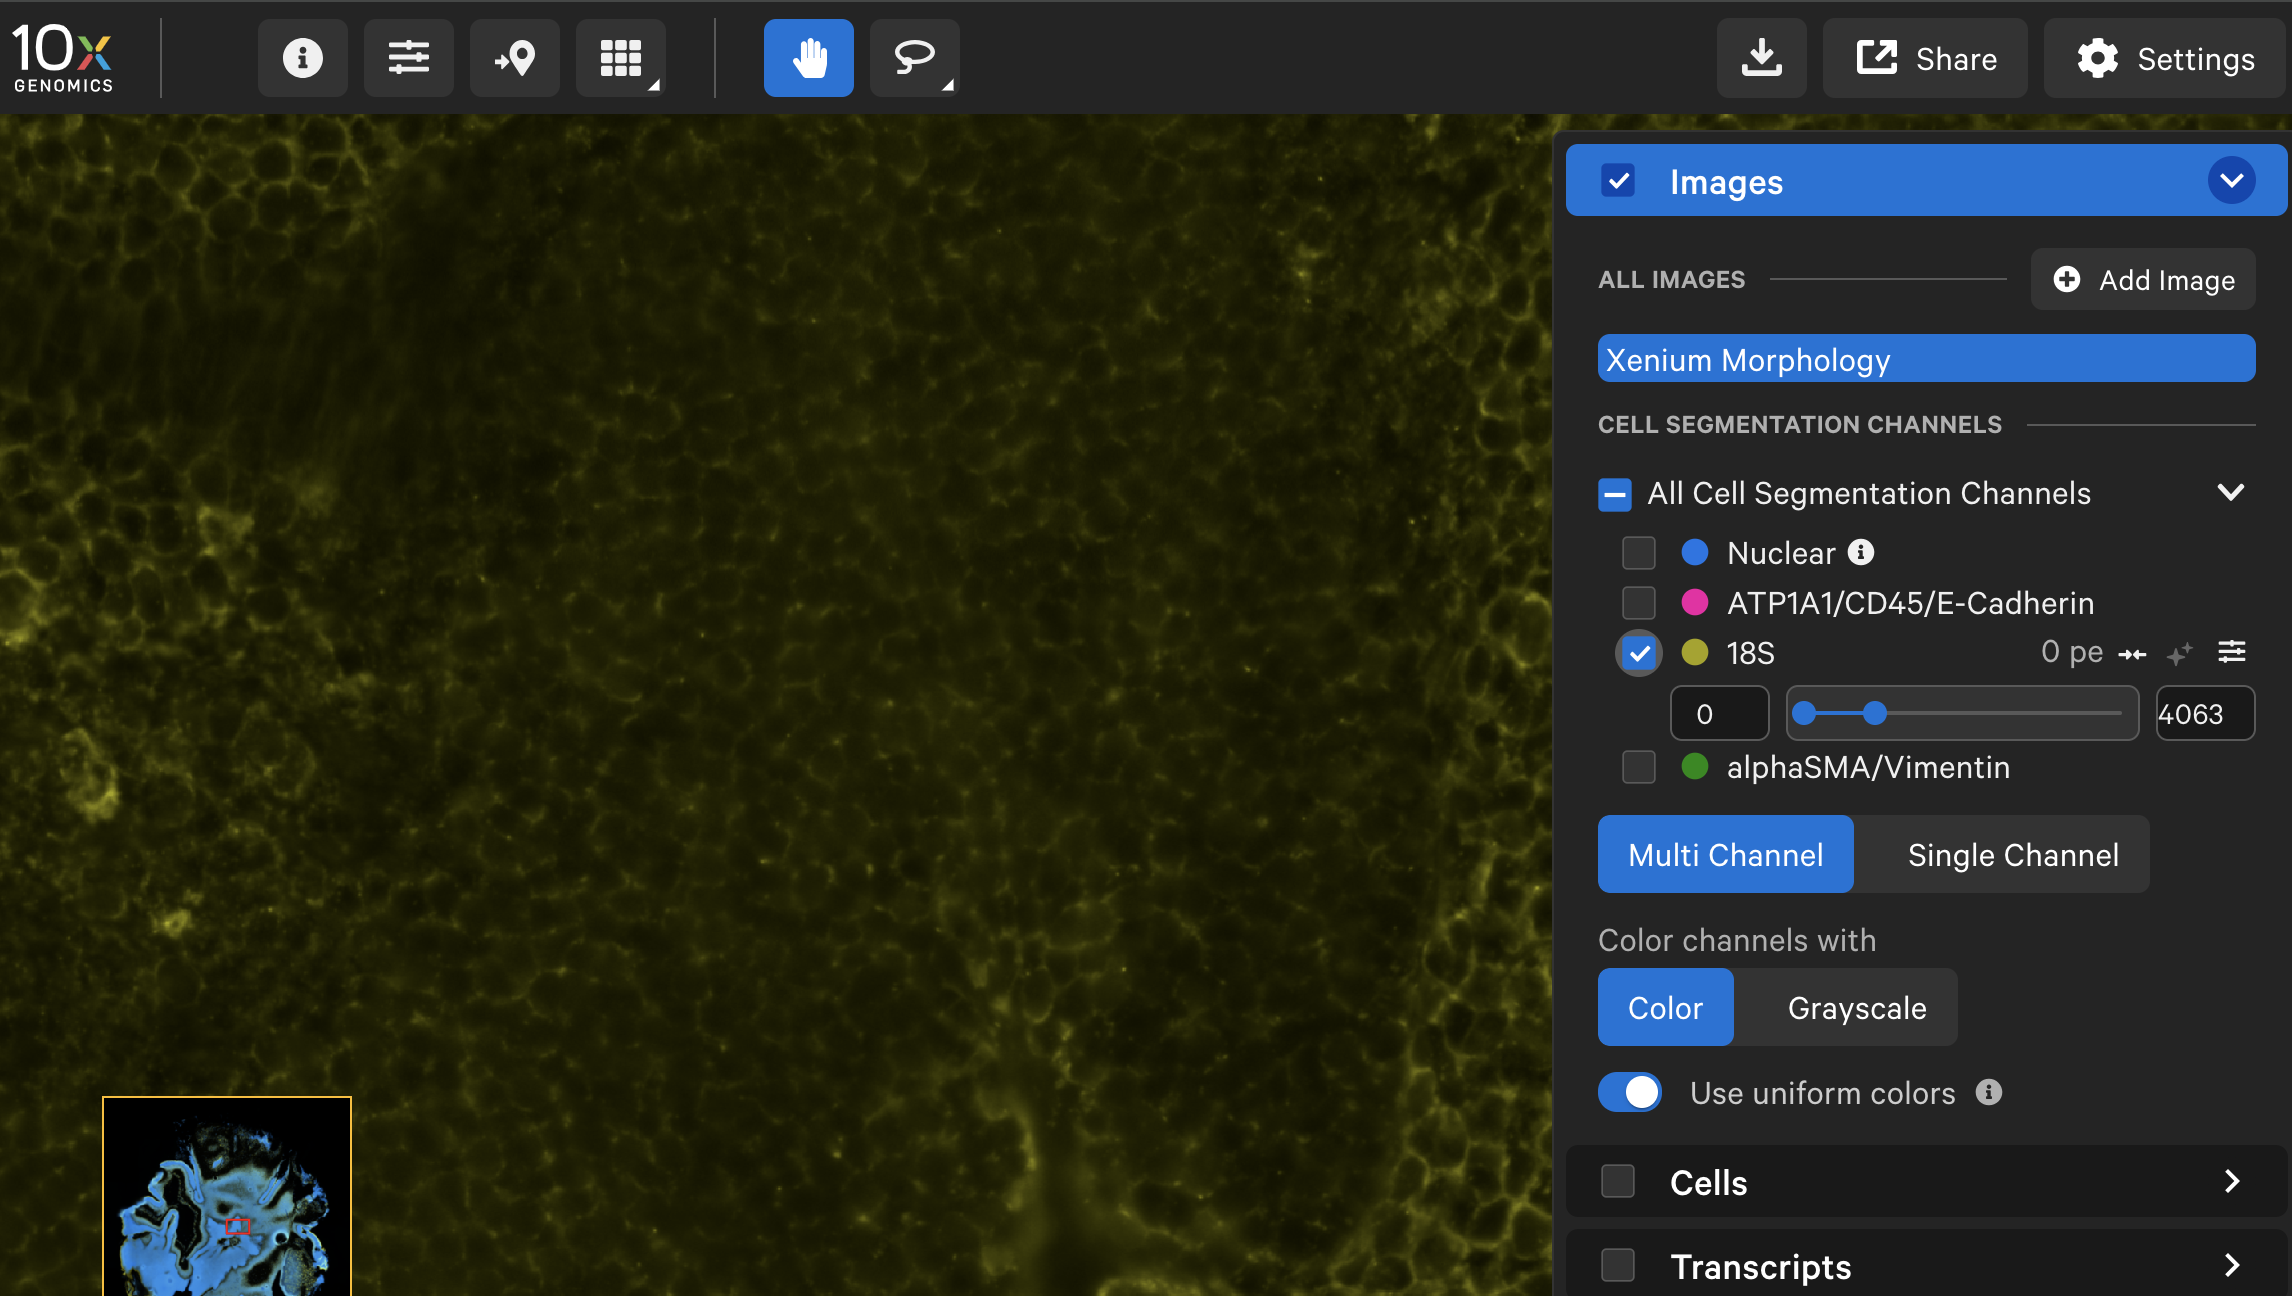 |
| Pre-XOA v4.0 nucleus segmentation algorithm | 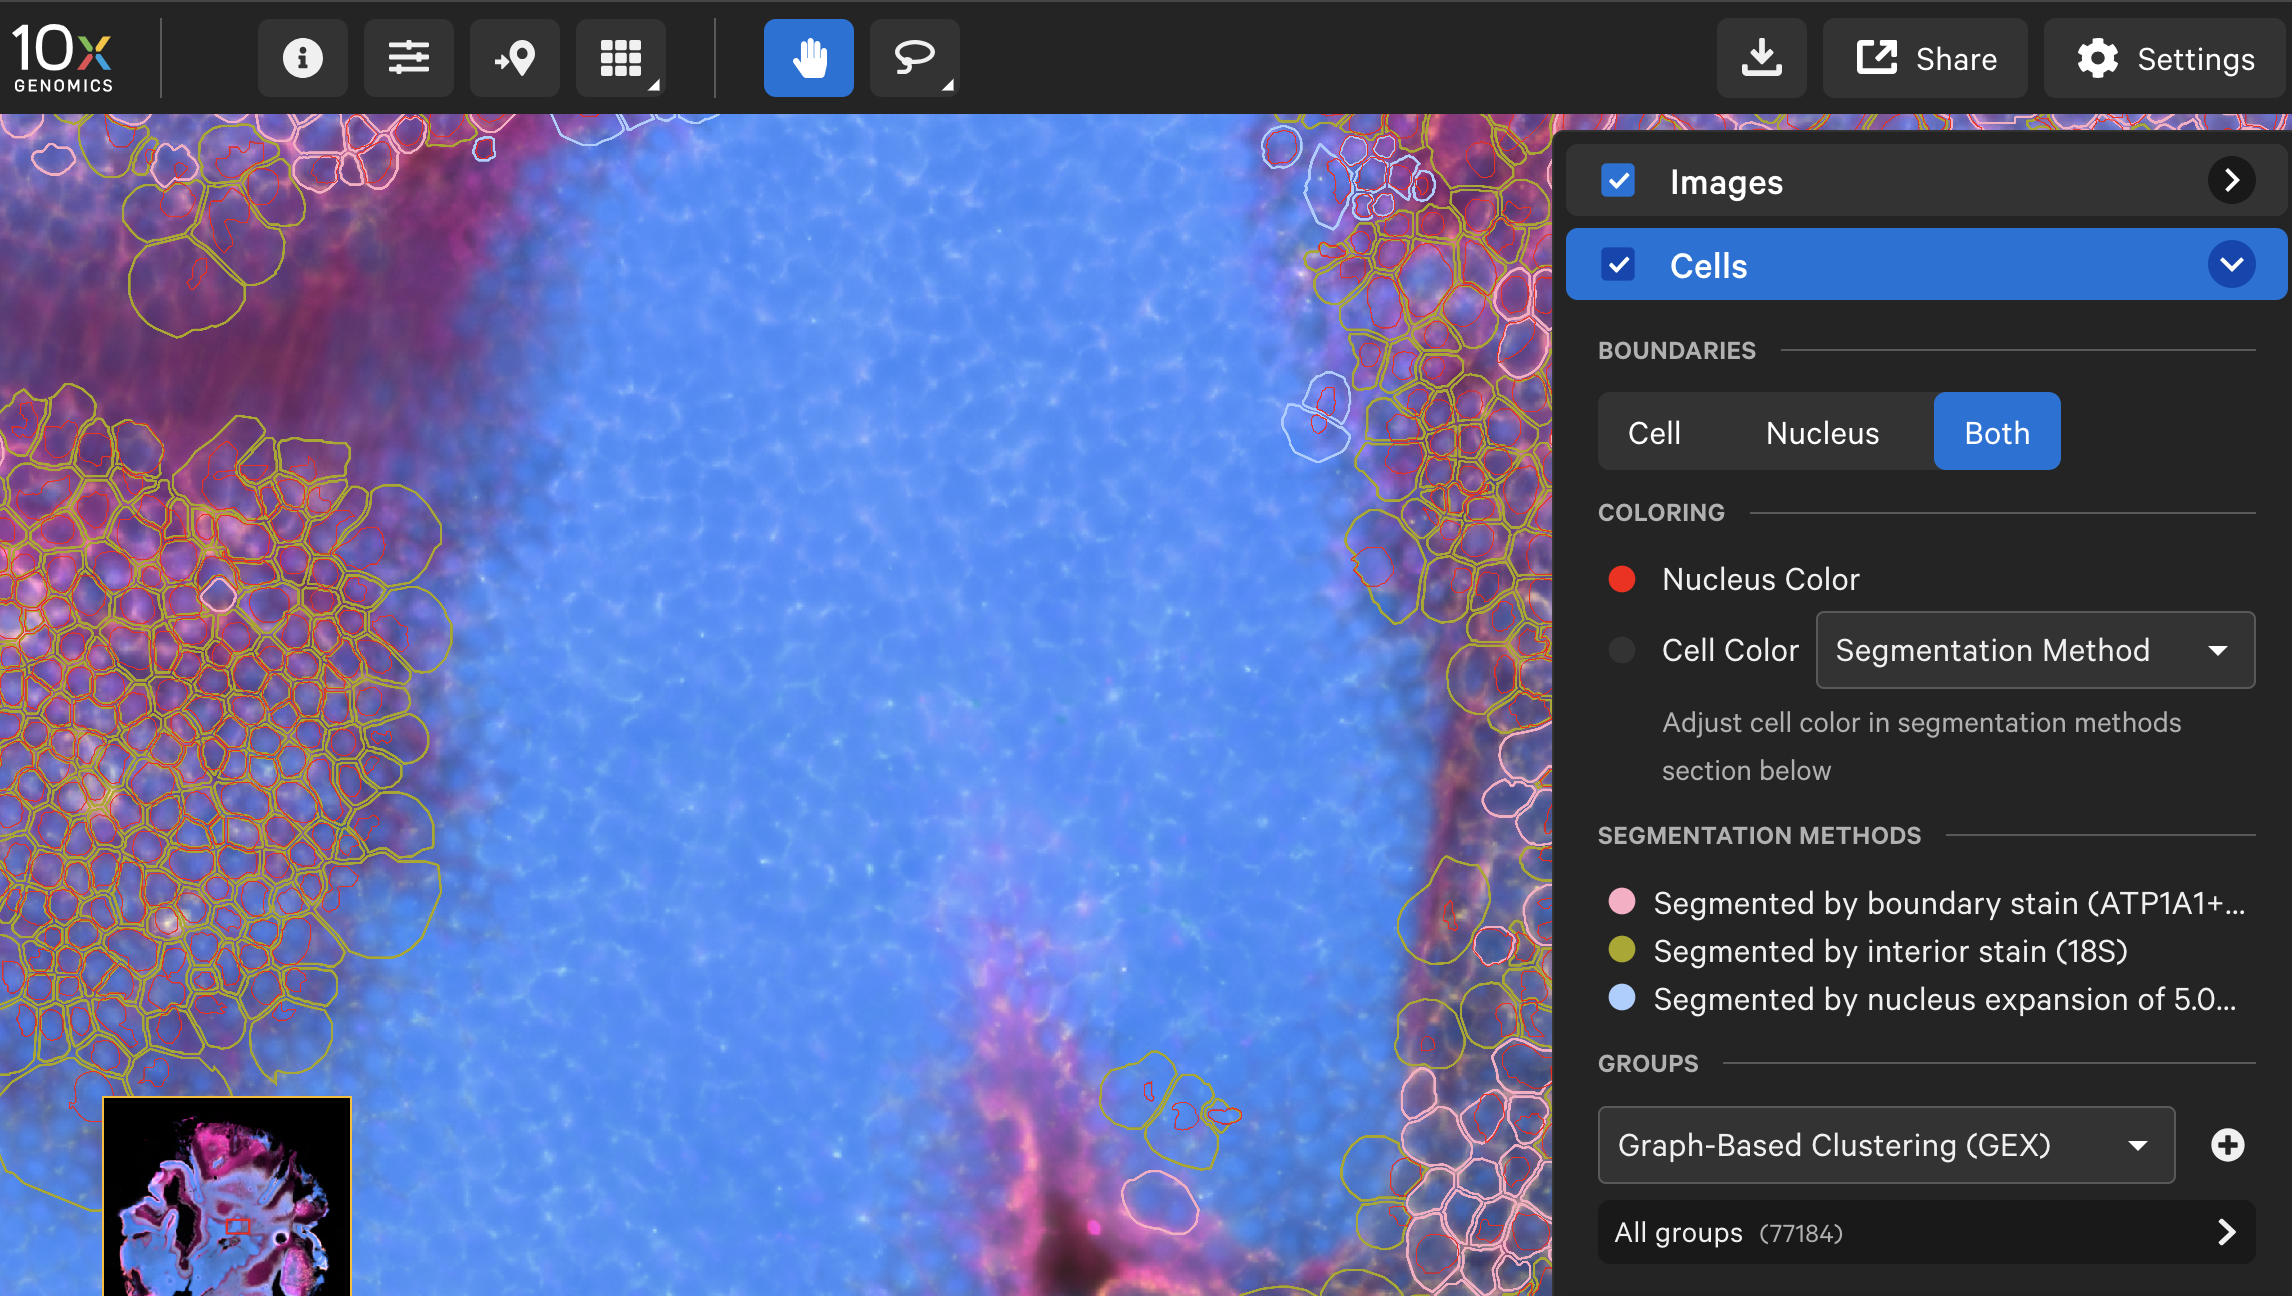 |
| XOA v4.0 nucleus segmentation algorithm | 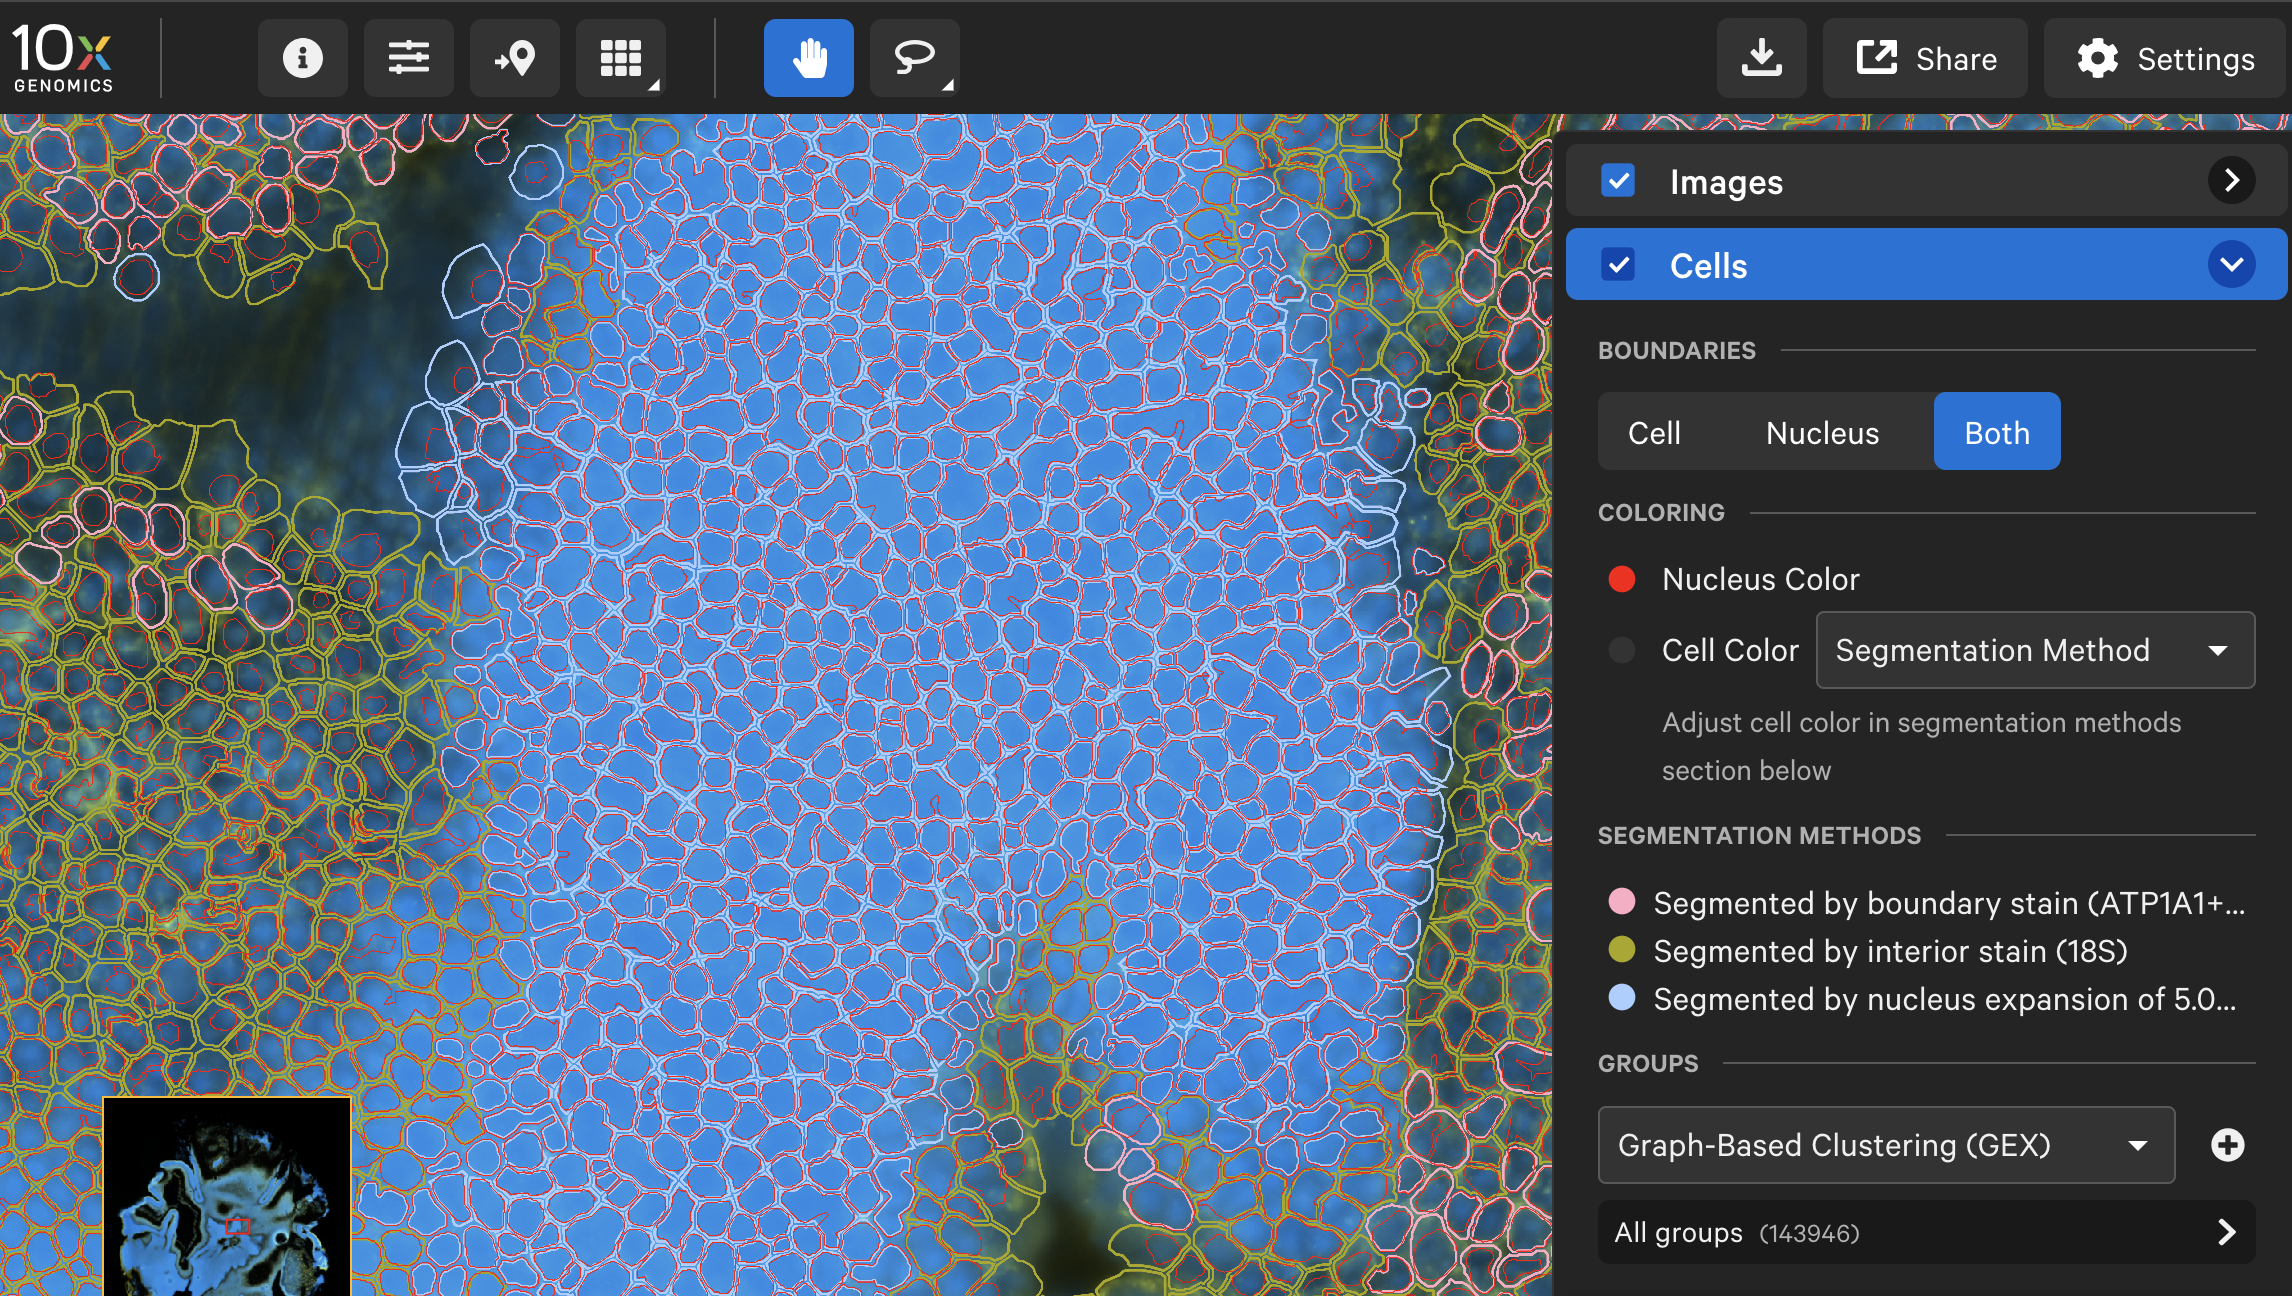 |
† Mouse retina tissue dataset provided by Mi-Hyun Nam, Alon Poleg-Polsky, and Samuel Budoff. Retinal tissue preparation detailed in Budoff S and Poleg-Polsky A. En face Cryosectioning of Mouse Retina for High-dimensional Spatial Molecular Analysis. JoVE, 2025 and Budoff S and Poleg-Polsky A. A Complete Spatial Map of Mouse Retinal Ganglion Cells Reveals Density and Gene Expression Specializations. Biorxiv, 2025.
This algorithm step is only compatible for tissues prepared with the Multi-Tissue Stain Mix following the Cell Segmentation Staining workflow (see CG000749, CG000760, or CG000819). Read the Xenium In Situ Multimodal Cell Segmentation: Workflow and Data Highlights Technical Note to learn about assay performance.
The multimodal cell segmentation algorithm uses custom deep learning models to analyze the multi-channel stain images. The models are trained on 10x Genomics Xenium In Situ data, which include a range of tissue types and preparations (fresh frozen, FFPE). Starting in XOA v4.0, cell segmentation is performed on the deconvolved, global focus map images (described in Image Processing Algorithms).
After nucleus segmentation with DAPI, the algorithm uses three methods to segment cells.
The segmentation results are prioritized in this order for each cell:
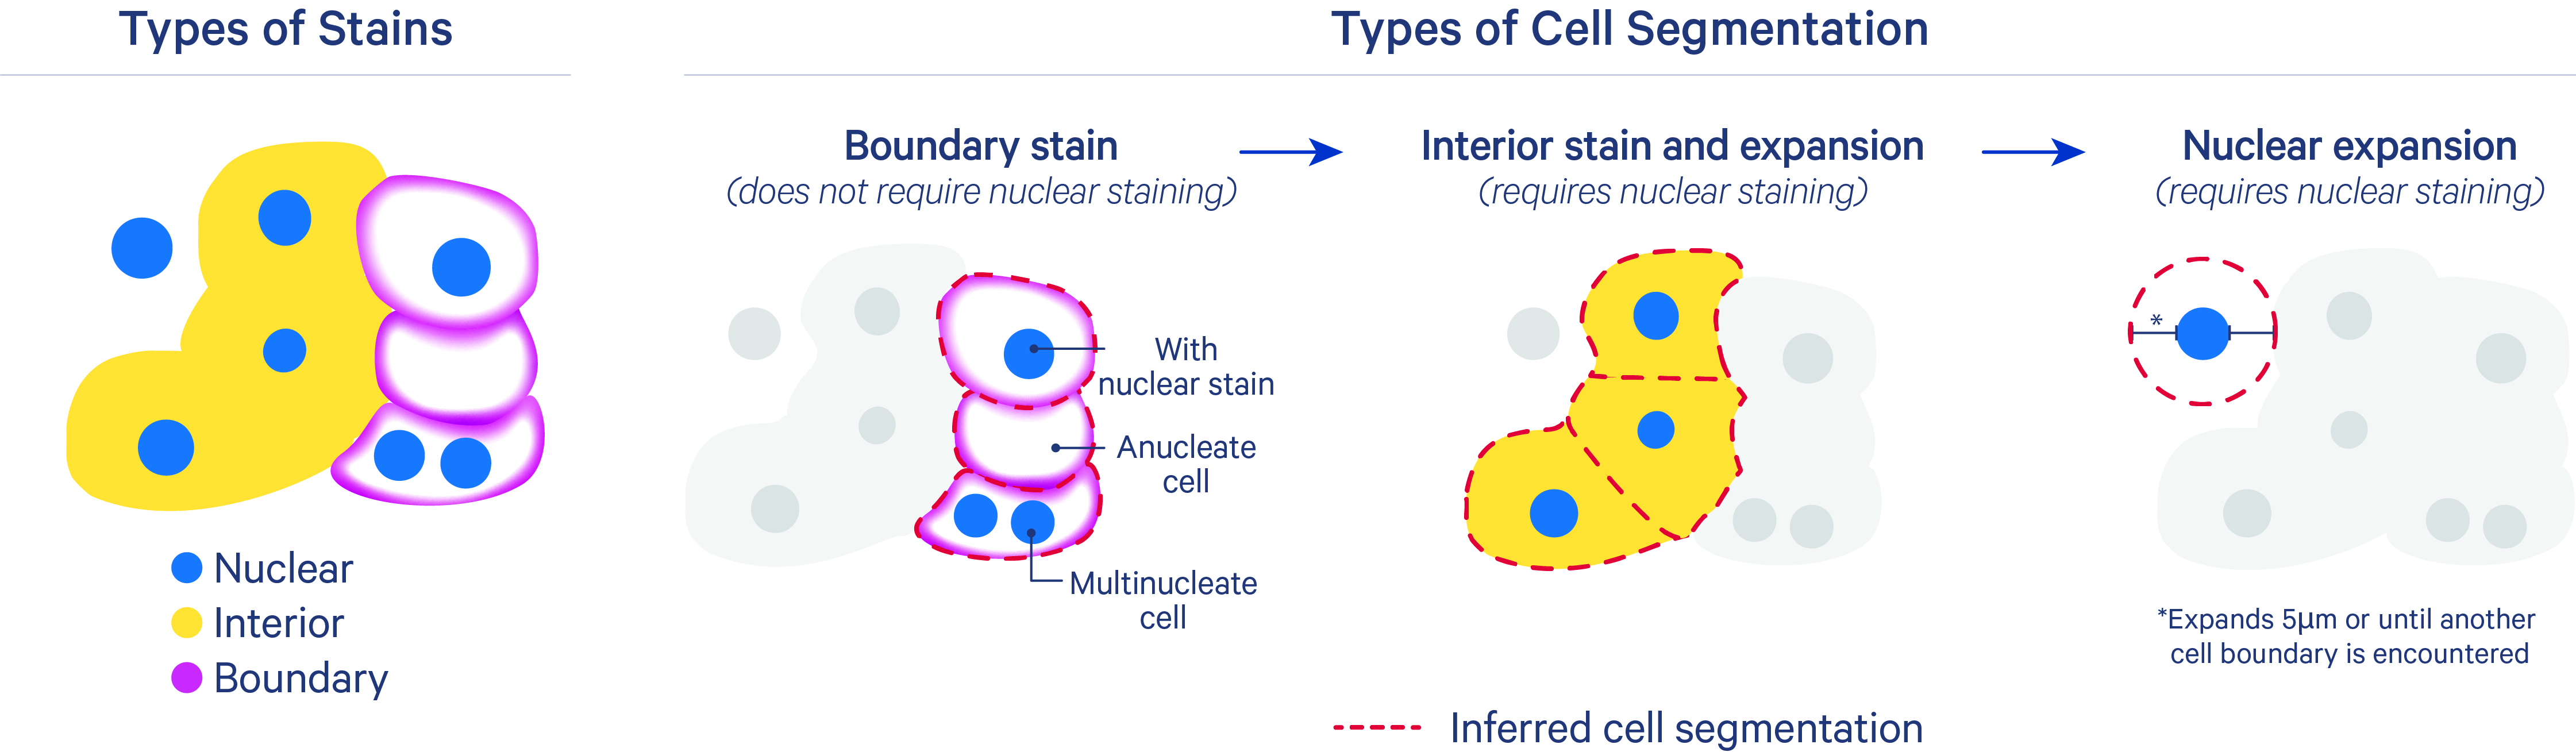
- Segment cells based on their cell boundary stain: The inferred segmentation from this method should be closest to the true cell membrane boundary. It uses cell-surface marker antibodies to target epithelial markers (ATP1A1, E-Cadherin) and immune markers (pan-lymphocyte: CD45). This method can split nuclei, define cells missing a nucleus, and identify multinucleate cells. Nuclei that overlap with anucleate cells are assigned to the cell.
- Segment cells based on expansion from the nucleus to the cell interior stain edge: This method includes both a deep learning model and a nuclear expansion method using the interior stain to infer cell boundaries. It uses the interior stain (18S rRNA marker) and the DAPI stain for nuclei. The XOA cell segmentation algorithm does not currently use the interior protein stain (alphaSMA/Vimentin), as the 18S marker has been sufficient for most tissue types. The inferred cell outline may look irregular in cases where boundaries between cell interior stains are challenging to identify (i.e., for dense tissue types).
- Nuclear expansion: For cases where cells that do not have boundary or interior stains, segment cells with a nuclear (DAPI) expansion distance of 5 µm or until another cell boundary is encountered (described more below).
The analysis_summary.html and metrics_summary.csv outputs will provide metrics for the proportion of cells segmented with each method (described here).
This algorithm step is used in DAPI-only workflows or for cells that do not have boundary or interior stains (see algorithm order in section above).
Once the locations of nuclei in the sample have been identified by the model, a heuristic cell boundary expansion step is performed. The nucleus boundaries are expanded by 5 µm or until they encounter another cell boundary in X-Y. If cell boundaries overlap during expansion, they are resolved using an algorithm that is conceptually similar to Voronoi tessellation.
Xenium cell segmentation takes into account the 3D output from the DAPI image processing step for all Z-slices for better accuracy, as well as the 2D focus image outputs if the multimodal cell segmentation workflow is used. The pipeline ultimately produces a flattened 2D segmentation mask for ease of use.
The nuclear boundaries are consolidated to form non-overlapping 2D objects when projected in X-Y. Since the segmentation mask is 2D, transcripts are assigned to 2D shapes based on their X and Y coordinates.
Nucleus and cell boundary polygons are also provided in the outputs. They are approximations of the segmentation masks and are used for efficient visualization of nucleus and cell segmentation in Xenium Explorer and other analysis software. Cell and nucleus mask and polygon data are stored in the cells.zarr.zip output file.
You can also use XOA outputs to explore other segmentation methods developed in the community. Analysis Guides on this topic can be found on the 10x website. These third-party segmentation results can be viewed in Xenium Explorer with updated XOA metrics and outputs using Xenium Ranger's import-segmentation pipeline.