Along with additions to some existing XOA gene expression outputs, XOA v4.0 outputs files that are specific to data generated with the Xenium In Situ Gene and Protein Expression with Cell Segmentation Staining assay (CG000819) (referred to as Xenium Protein assay hereafter).
The following files contain both gene and protein data:
- Analysis summary HTML
- Cell-feature matrix files (MEX, H5, Zarr)
- Secondary analysis files (
analysis/, Zarr)
The following files are only provided in protein datasets:
- 2D morphology focus OME-TIFF protein images
- 2D morphology focus OME-TIFF background images
- Auxiliary output directory with 2nd cycle autofluorescence images
The Summary, Analysis, and Image QC tabs contain additional information for protein datasets; these are described below. The Decoding and Cell Segmentation tabs are the same as described for all Xenium datasets here.
The Protein Panel lists all the protein subpanel(s) selected for the experiment on the Xenium Analyzer instrument. If selected during run setup, multimodal cell segmentation markers can be imaged individually (labeled "Cellular Localization" markers).
Protein datasets include two subtabs on the Analysis tab for secondary analysis results calculated from the transcript data and from the protein data. The Top Features tables for both subtabs are provided to help annotate clusters.
The Gene Expression Analysis subtab displays the same plots and tables as described on the Analysis Summary Overview page, with the addition of a table for relative protein expression for the RNA-only clusters:
- The Top Protein Expression Features by Cluster (Z-score) table shows top proteins expressed based on RNA-only clusters.
- The Top Features by Cluster (Log2 fold-change, p-value) table shows top genes expressed based on RNA-only clusters.
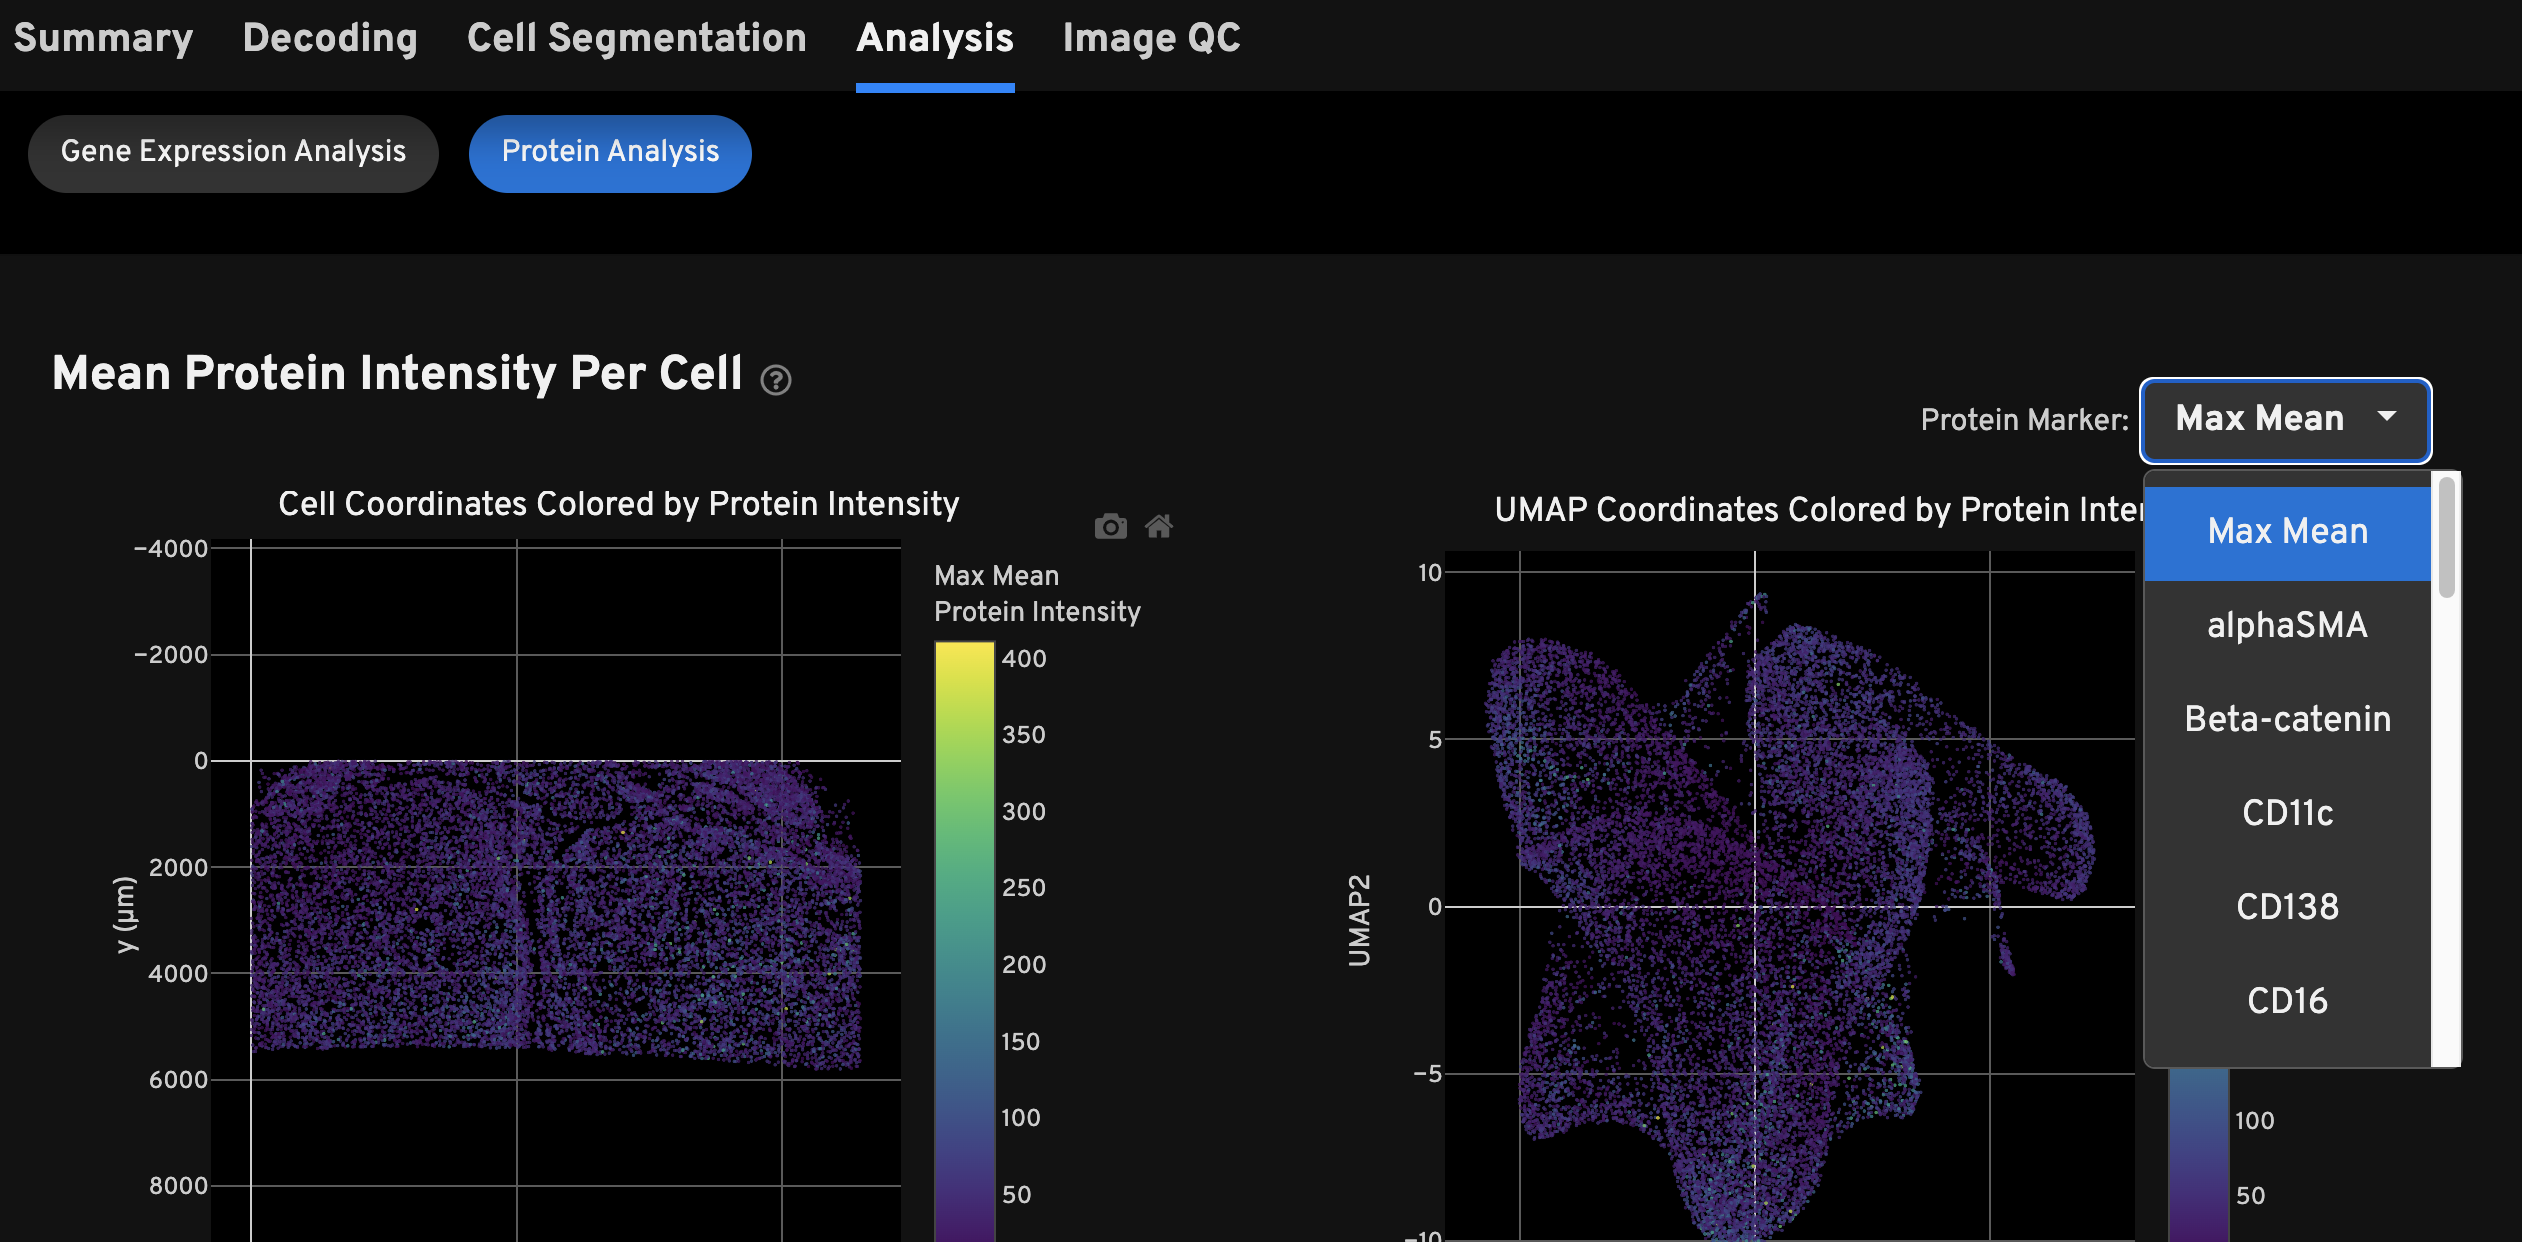
The Protein Analysis subtab displays Mean Protein Intensity Per Cell plots, Clustering plots, Top Feature tables for protein and gene expression, and a Protein Correlations plot. Refer to the help text in the HTML file for detailed plot and table descriptions.
The top feature tables on this view are presented for the protein-only cluster results:
- The Top Protein Expression Features by Cluster (Z-score) table shows top proteins expressed based on protein-only clusters.
- The Top Features by Cluster (Log2 fold-change, p-value) table shows top genes expressed based on protein-only clusters.
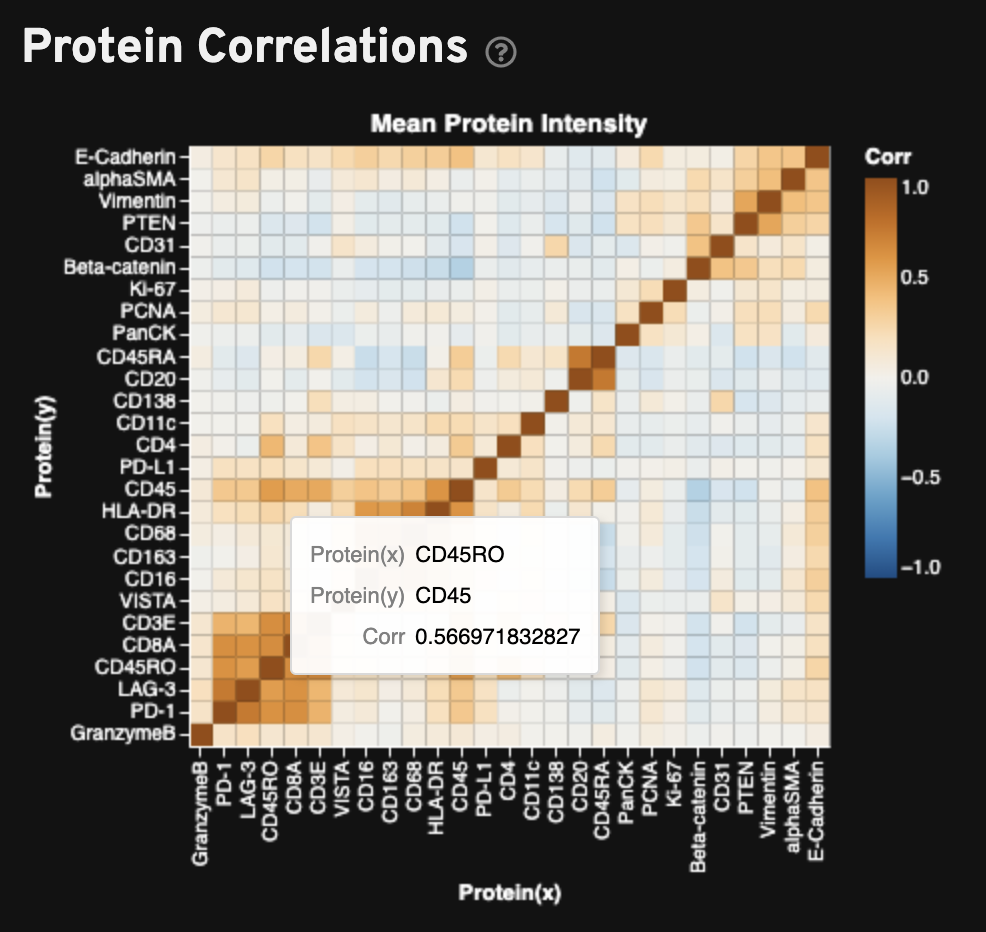
The Protein Correlations plot shows the Pearson correlation matrix of mean fluorescence intensity per cell for all proteins in the sample. Proteins are hierarchically clustered using the correlation structure and then ordered according to this clustering. Proteins that are markers for the same or similar cell types, such as memory T cells, should be clustered together and have high correlation.
Here is an example for investigating the results on the Protein Analysis tab:
- Select a protein or RNA cluster result to investigate and view the cell clusters in the Clustering spatial or UMAP plots.
- Next, look up the proteins that are more expressed in that cluster using the Top Protein Expression Features by Cluster (Z-score) table (median Z-score normalized mean intensity calculation described here).
- Finally, confirm the spatial expression result by viewing cells colored by mean intensity per cell in the spatial or UMAP plot (mean intensity calculation described here).
For the Xenium Protein assay outputs, this tab includes the RNA Decoding Images, Autofluorescence Images (1st cycle), and Cell Segmentation Images described on the Analysis Summary Overview page. In addition, this tab also displays Protein Images and Autofluorescence Images (2nd cycle) to help with QC and troubleshooting of protein data.
Image gallery units: The x- and y-axes are measured in micrometers. The intensity values in all autofluorescence, cell segmentation, and protein images are measured in arbitrary units (a.u.), as the image processing steps transform the original image units (photoelectrons (pe)) units. Interpret data as before by examining images for brightness patterns, however note that brightness is protein marker-specific and is not directly comparable across markers.
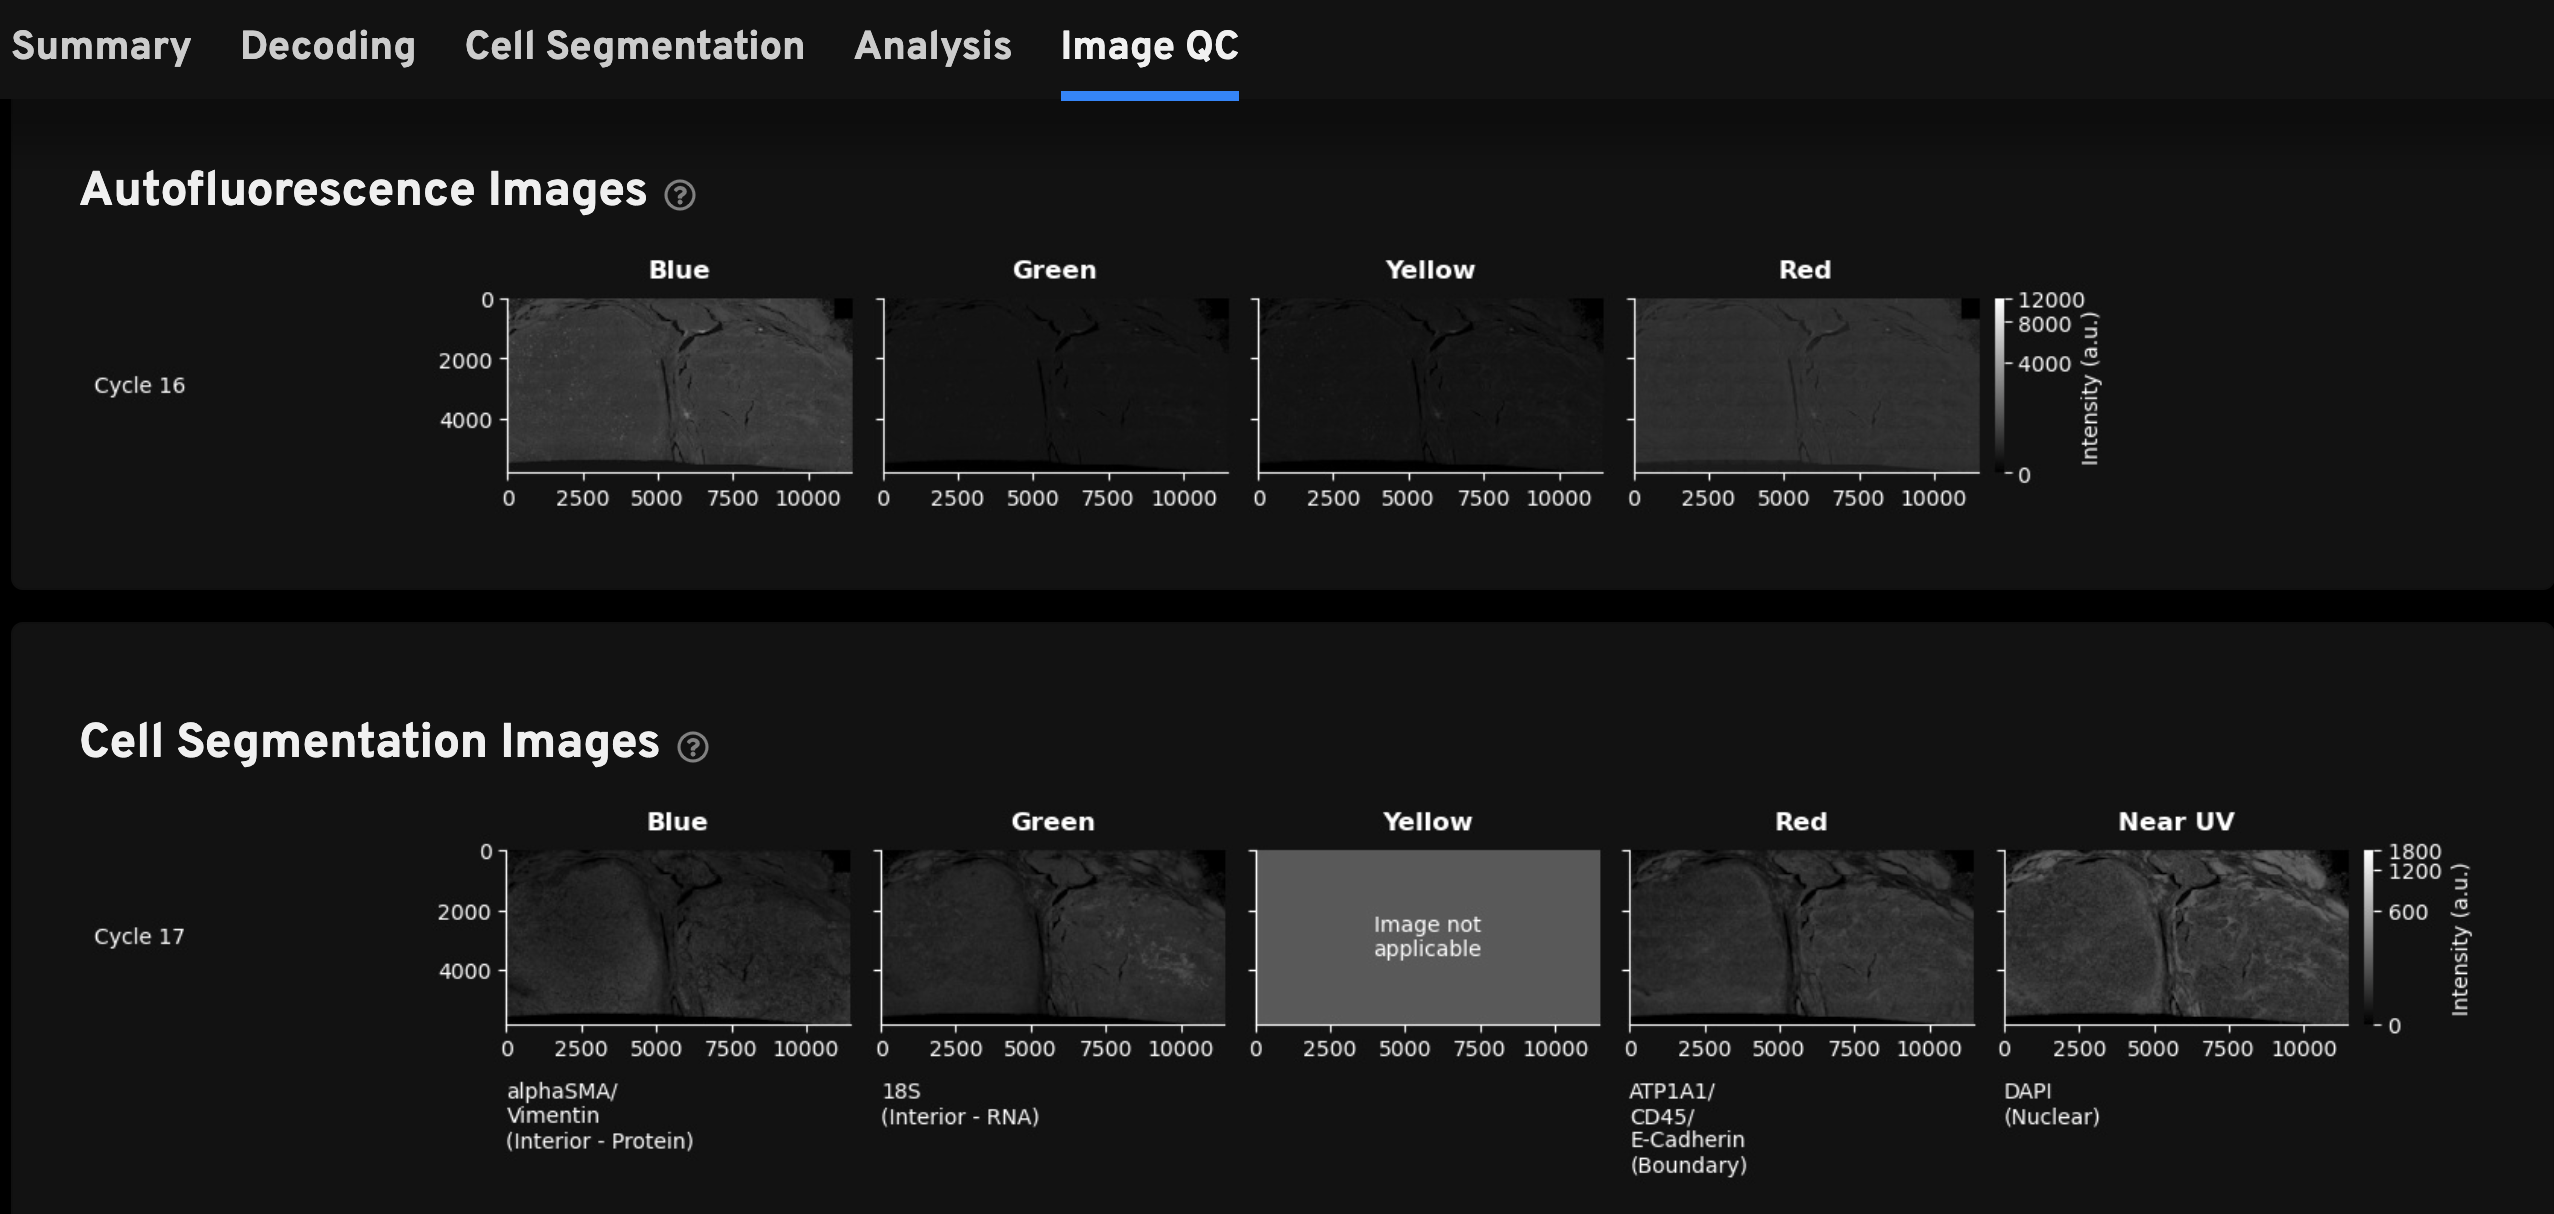
- Autofluorescence Images (1st cycle): For Xenium Protein assay instrument runs, background images are acquired for the blue, green, yellow, and red channels.
- Cell Segmentation Images: Cell segmentation staining images are acquired in the blue, green, red, and near UV channels. Note that the blank yellow channel is displayed to maintain the same order of channels presented in all sections of the Image QC gallery as you review the images vertically.
Protein Images: Thumbnail plots of the autofocused, downsampled, and processed morphology images. The protein stain images in this gallery have undergone deconvolution, background subtraction, masking, crosstalk correction, and stitching (described in the protein imaging algorithms page). Image features will appear sharper and fluorescence intensity values lower as a result of image deconvolution. These images can be used to check for large-scale issues like debris or detect patterns across imaging cycles. Any staining or image quality concerns should be verified by looking at the full resolution morphology_focus images in Xenium Explorer.
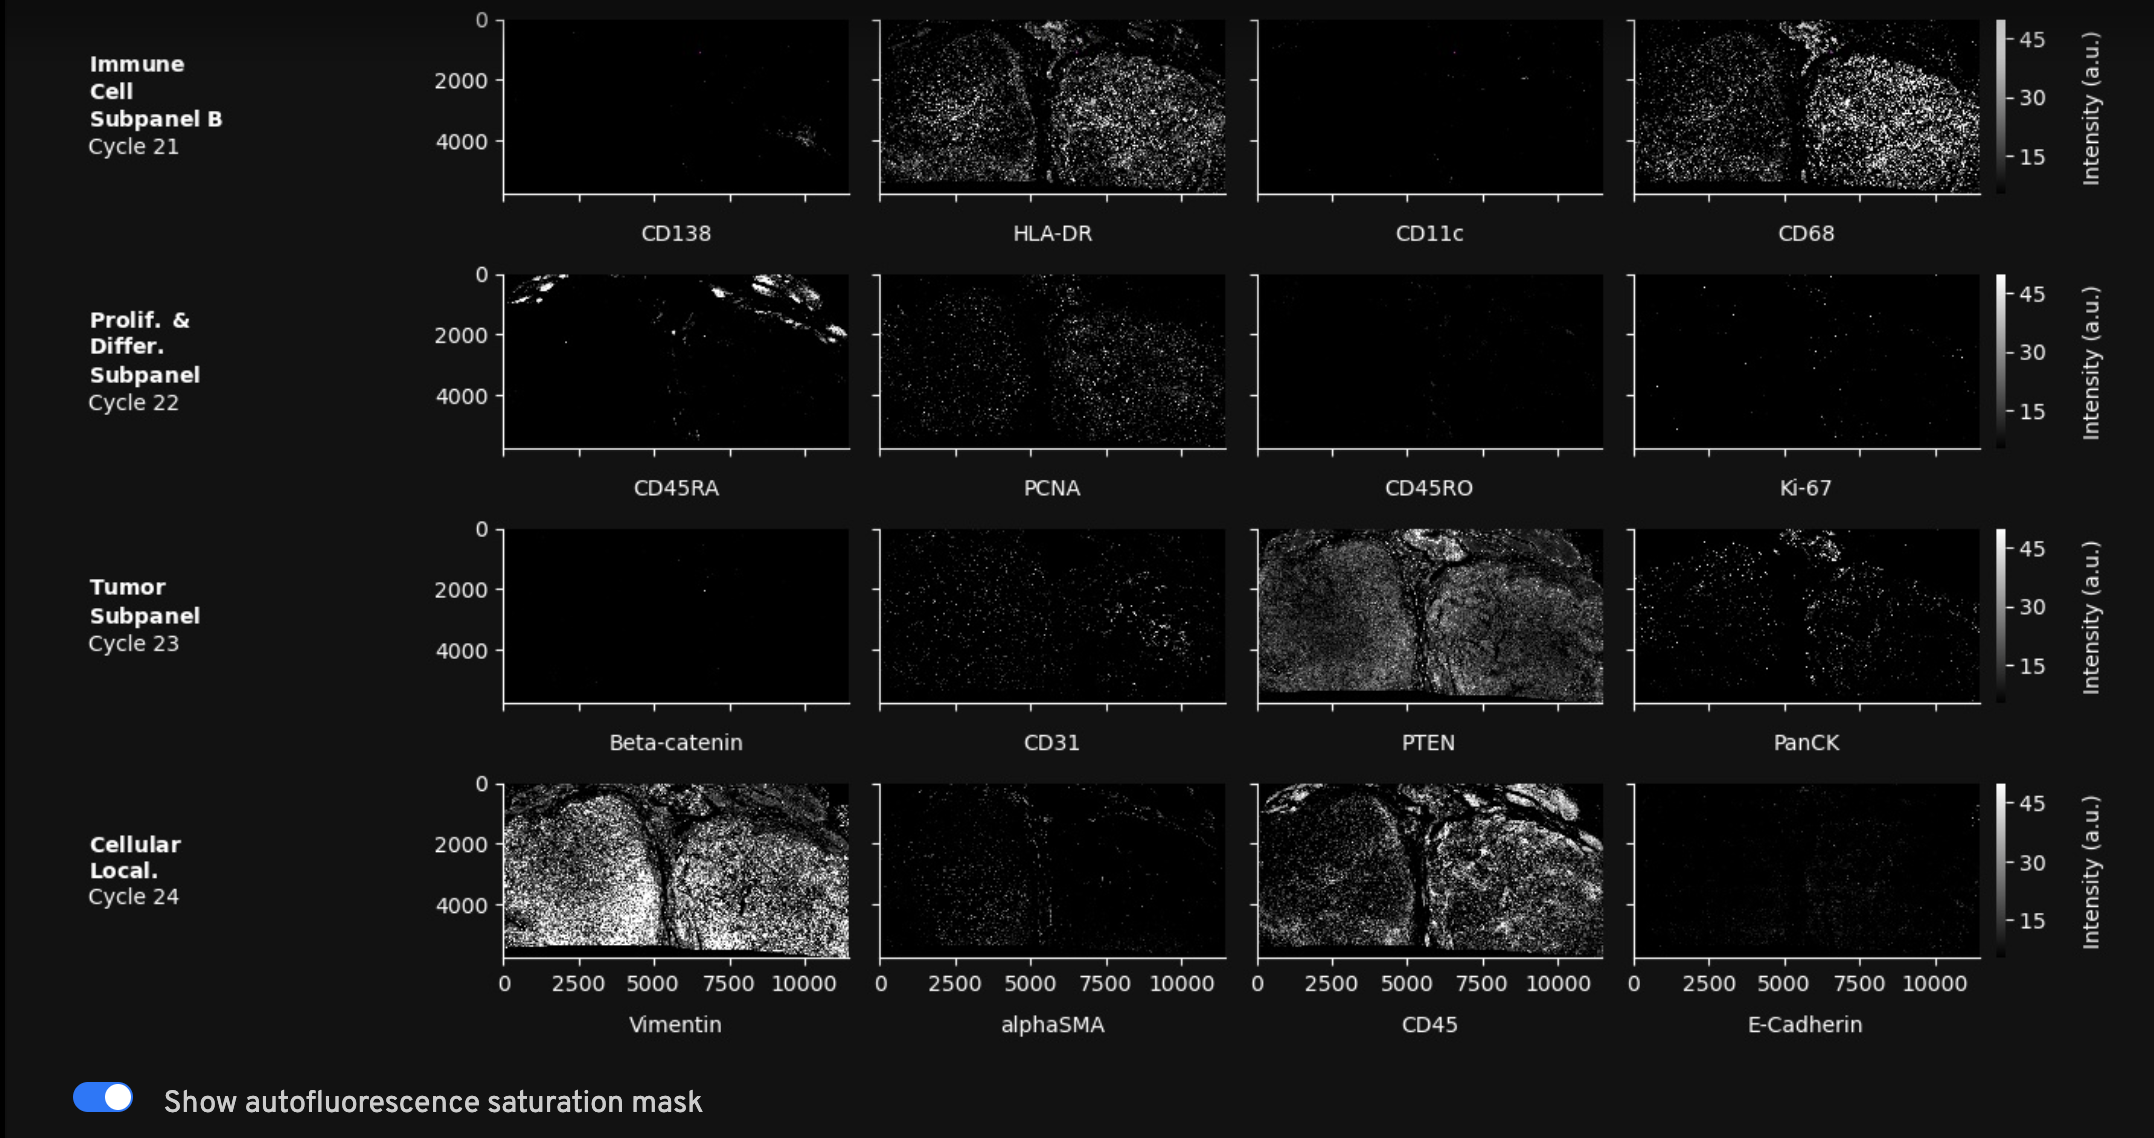
Use the toggle to overlay saturation QC masks over their corresponding protein images. Areas highlighted in magenta have saturated pixels in the exposure-adjusted background used for background subtraction or in at least one of the channels of a cycle, thus affecting crosstalk correction (described in the protein image algorithms page). Masked pixels are set to zero in the morphology_focus image and excluded from quantification. The full resolution masks can be found in aux_outputs/morphology_focus_qc_masks and viewed in Xenium Explorer by importing as an additional stack of images.
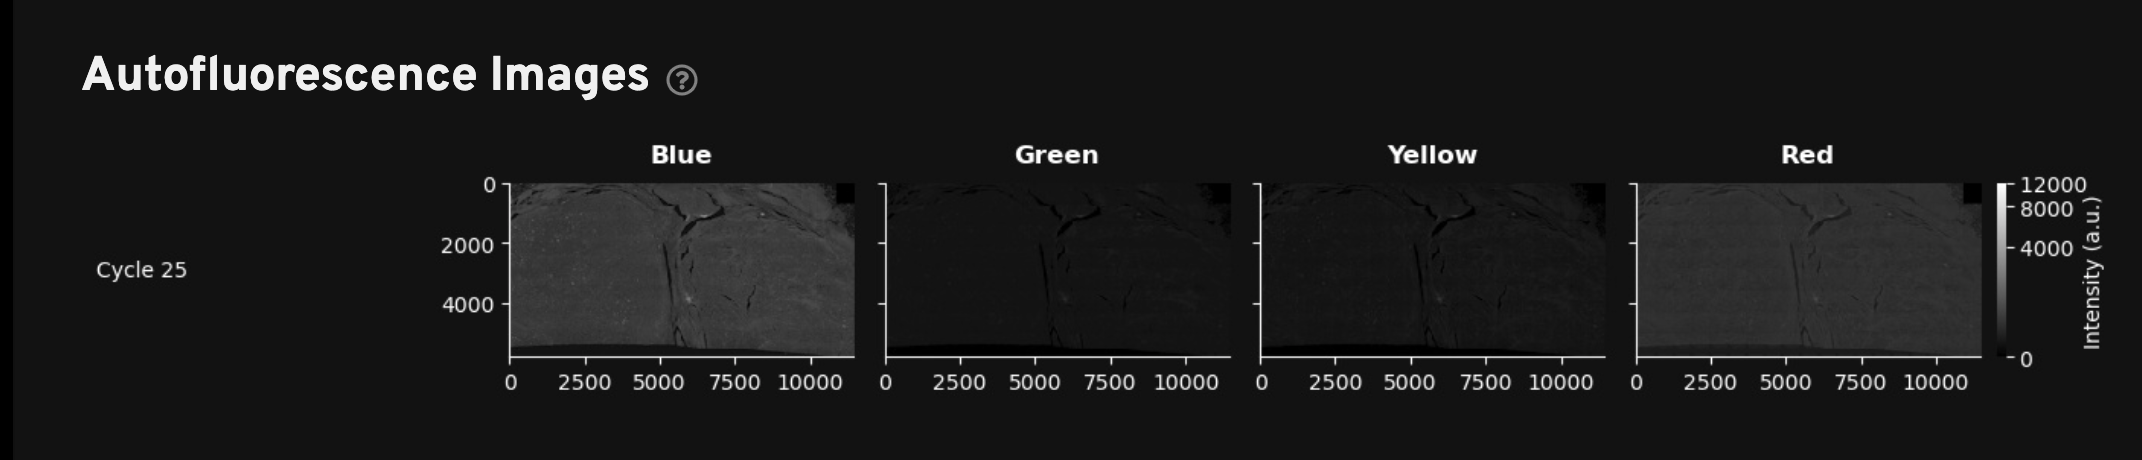
Autofluorescence Images (2nd cycle): Thumbnail plots of the autofluorescence images (maximum intensity projection (MIP) images (not deconvolved). These images are used in background subtraction to produce the autofocused images in the Protein Images gallery. Use these images to review any debris or autofluorescence artifacts that were automatically subtracted during morphology image processing. Downsampled images are available in the aux_outputs/background_qc_images/background_02_[channel].tiff directory.
2D multi-focus fused, deconvolved, background subtracted, masked, and crosstalk corrected protein images are provided in the multi-file OME-TIFF directory (morphology_focus/) that contains nucleus and cell stain segmentation images. In addition, the first cycle of autofluorescence background images, which are fused and deconvolved, will also be included when protein data is present. Learn about protein image process algorithms here.
The files will be ordered and labeled by channel number: DAPI (n=1), cell segmentation images (n=3), autofluorescence images by wavelength (n=4), and protein images in order of selection on instrument (n=up to 27). Protein subpanels are sorted alphabetically, and each protein within a subpanel is sorted by wavelength. If Xenium Multi-Tissue Stain Mix markers are imaged separately as one of the protein cycles, they are listed last and called "Cellular Localization" markers. Learn about protein subpanel markers here.
Example morphology_focus folder with DAPI, cell segmentation images, autofluorescence images, and all protein images:
morphology_focus
├── ch0000_dapi.ome.tif # DAPI image (cycle 17)
├── ch0001_atp1a1_cd45_e-cadherin.ome.tif # Cell segmentation images
├── ch0002_18s.ome.tif
├── ch0003_alphasma_vimentin.ome.tif
├── ch0004_blue_background.ome.tif # 1st cycle autofluorescence images
├── ch0005_green_background.ome.tif
├── ch0006_yellow_background.ome.tif
├── ch0007_red_background.ome.tif
├── ch0008_cd4.ome.tif # Xenium Protein Immune Cell Subpanel A images
├── ch0009_cd20.ome.tif
├── ch0010_cd8a.ome.tif
├── ch0011_cd3e.ome.tif
├── ch0012_cd138.ome.tif # Xenium Protein Immune Cell Subpanel B images
├── ch0013_hla-dr.ome.tif
├── ch0014_cd11c.ome.tif
├── ch0015_cd68.ome.tif
├── ch0016_cd16.ome.tif # Xenium Protein Immune Cell Subpanel C images
├── ch0017_granzymeb.ome.tif
├── ch0018_cd163.ome.tif
├── ch0019_pd-1.ome.tif # Xenium Protein Immune Checkpoint Subpanel images
├── ch0020_vista.ome.tif
├── ch0021_pd-l1.ome.tif
├── ch0022_lag-3.ome.tif
├── ch0023_cd45ra.ome.tif # Xenium Protein Proliferation & Differentiation Subpanel images
├── ch0024_pcna.ome.tif
├── ch0025_cd45ro.ome.tif
├── ch0026_ki-67.ome.tif
├── ch0027_beta-catenin.ome.tif # Xenium Protein Tumor Subpanel images
├── ch0028_cd31.ome.tif
├── ch0029_pten.ome.tif
├── ch0030_panck.ome.tif
├── ch0031_vimentin.ome.tif # Cellular Localization marker images
├── ch0032_alphasma.ome.tif
├── ch0033_cd45.ome.tif
└── ch0034_e-cadherin.ome.tif
Programmatic examples for viewing these files is provided below.
The output bundle contains the same cell_feature_matrix files (MEX, HDF5, and Zarr formats) as for gene expression datasets, and adds a Protein Expression feature type.
The cell_feature_matrix includes scaled mean protein intensity values (see calculation), 10x Genomics Xenium Protein marker IDs (TXP), and protein marker abbreviations.
Example of protein features in the cell_feature_matrix/features.tsv file:
TXP000019 PD-1 Protein Expression
TXP000023 VISTA Protein Expression
TXP000029 PD-L1 Protein Expression
TXP000016 LAG-3 Protein Expression
Example hierarchy of the cell_feature_matrix.h5 file:
h5dump -n ./cell_feature_matrix.h5
HDF5 "./cell_feature_matrix.h5" {
FILE_CONTENTS {
group /
group /matrix
dataset /matrix/barcodes
dataset /matrix/data
group /matrix/features
dataset /matrix/features/_all_tag_keys
dataset /matrix/features/feature_type
dataset /matrix/features/genome
dataset /matrix/features/id
dataset /matrix/features/name
dataset /matrix/indices
dataset /matrix/indptr
dataset /matrix/shape
}
}
# The scaling factor value is stored in the H5 file:
h5dump --attribute=protein_scaling_factor cell_feature_matrix.h5
HDF5 "cell_feature_matrix.h5" {
ATTRIBUTE "protein_scaling_factor" {
DATATYPE H5T_STD_I64LE
DATASPACE SCALAR
DATA {
(0): 10
}
}
}
The 10x Genomics Xenium IDs per protein in each subpanel are:
| Subpanel | Protein Marker ID | Protein Marker Name |
|---|---|---|
| Xenium Protein Immune Cell Subpanel A | TXP000007 | CD4 |
| TXP000004 | CD20 | |
| TXP000011 | CD8A | |
| TXP000005 | CD3E | |
| Xenium Protein Immune Cell Subpanel B | TXP000003 | CD138 |
| TXP000015 | HLA-DR | |
| TXP000002 | CD11c | |
| TXP000010 | CD68 | |
| Xenium Protein Immune Cell Subpanel C | TXP000044 | CD16 |
| TXP000013 | GranzymeB | |
| TXP000034 | CD163 | |
| Xenium Protein Immune Checkpoint Subpanel | TXP000019 | PD-1 |
| TXP000023 | VISTA | |
| TXP000029 | PD-L1 | |
| TXP000016 | LAG-3 | |
| Xenium Protein Proliferation & Differentiation Subpanel | TXP000008 | CD45RA |
| TXP000018 | PCNA | |
| TXP000009 | CD45RO | |
| TXP000030 | Ki-67 | |
| Xenium Protein Tumor Subpanel | TXP000035 | Beta-catenin |
| TXP000006 | CD31 | |
| TXP000021 | PTEN | |
| TXP000017 | PanCK | |
| Xenium Cellular Localization markers (if Xenium Multi-Tissue Stain Mix markers are imaged individually on-instrument) | TXP000022 | Vimentin |
| TXP000001 | alphaSMA | |
| TXP000024 | CD45 | |
| TXP000025 | E-Cadherin |
The output bundle contains secondary analysis files (CSV and Zarr formats) for gene data (prefix gene_expression_) and protein data (prefix protein_expression_). These results can be used for data QC and provide a starting point for downstream analyses.
Directory structure example:
└─ analysis
├── clustering
├── diffexp
├── pca
├── protexp
└── umap
For differential expression (analysis/diffexp) results, a table is produced for each protein-only and RNA-only clustering result that shows differentially expressed RNA features in each cluster relative to all other clusters. This allows the user to annotate cell types of each cluster using gene expression data. These are the same outputs shown in the analysis summary Analysis tab's Top Gene Expression Features by Cluster (Log2 fold-change, p-value) tables:
- Gene Expression Analysis:
analysis/diffexp/gene_expression_[clustering method]/differential_expression.csv - Protein Analysis:
analysis/diffexp/protein_expression_[clustering method]/differential_expression.csv
A new analysis output is added for Xenium Protein assay data (analysis/protexp) to enable users to annotate cell types of each cluster using protein data. For each protein-only and RNA-only clustering result, a table is produced that shows the z-score standardized protein quantities in each cluster relative to all other clusters. These are the same outputs shown in the analysis summary Analysis tab’s Top Protein Expression Features by Cluster (Z-score):
- Gene Expression Analysis:
analysis/protexp/gene_expression_[clustering method]/protein_expression.csv - Protein Analysis:
analysis/protexp/protein_expression_[clustering method]/protein_expression.csv
Example:
head -5 gene_expression_kmeans_2_clusters/protein_expression.csv
Feature ID,Feature Name,1 Z Score,2 Z Score
TXP000019,PD-1,0.0,0.0
TXP000023,VISTA,0.0015787856530881013,-0.00016779365755827146
TXP000029,PD-L1,0.0,0.0
TXP000016,LAG-3,0.0,0.0
head -n 5 protein_expression_kmeans_2_clusters/protein_expression.csv
Feature ID,Feature Name,1 Z Score,2 Z Score
TXP000019,PD-1,0.0,0.0
TXP000023,VISTA,-0.0021058823637482237,0.0009362350496005511
TXP000029,PD-L1,0.0,0.0
TXP000016,LAG-3,0.0,0.0
In addition to the files described here, the aux_outputs/ directory includes additional background_qc_images/ image outputs for the Xenium Protein assay.
The background_qc_images/ directory also contains the 2nd cycle autofluorescence images (downsampled, TIFF format) acquired after protein image cycles, which are subtracted from the raw morphology stain images to produce the autofocused images (morphology_focus/) if the Xenium Protein protocol is used. These files have _02 in the file name to differentiate from the background images (_01) acquired after the RNA cycles.
Example:
├── background_qc_images
│ ├── background_01_blu.tiff
│ ├── background_01_grn.tiff
│ ├── background_01_nuv.tiff
│ ├── background_01_red.tiff
│ ├── background_01_yel.tiff
│ ├── background_02_blu.tiff
│ ├── background_02_grn.tiff
│ ├── background_02_nuv.tiff
│ ├── background_02_red.tiff
│ └── background_02_yel.tiff
Saturation QC masks are provided for all datasets starting in XOA v4.0, but are most useful for protein image data QC.
The morphology focus QC masks, also known as saturation QC masks, are binary images used to label saturated pixels that are masked in output protein images (located in morphology_focus/). The masking step ensures that invalid pixels are excluded from downstream analysis and visualization. Read the protein algorithms page to learn how the masking algorithm works. The QC masks can be imported into Xenium Explorer for data QC.
The protein_panel.json file specifies the protein targets that correspond to each imaging cycle-channel. It is generated when you select protein targets on the Xenium Analyzer UI during run set up, and included in the output bundle.