Decoding the 99%: understanding noncoding regulatory variation in Alzheimer’s and Parkinson’s disease

Our understanding of the underlying genetic dysregulation contributing to neurodegenerative diseases is still evolving. The task is made more complex when the putative genetic errors driving disease are in noncoding sequences of the genome. Researchers from Stanford University are now using single cell ATAC-seq to search through these mysterious sequences and learn how the regulatory elements they contain contribute to Alzheimer’s and Parkinson’s disease.

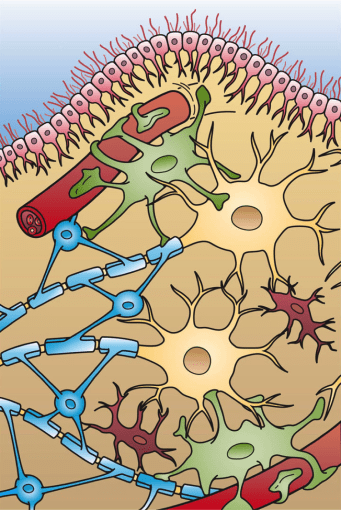
Pioneer of modern neuroscience and Nobel Prize winner, Dr. Santiago Ramón y Cajal, said in his 1906 Nobel Lecture, “Unfortunately, nature seems unaware of our intellectual need for convenience and unity, and very often takes delight in complication and diversity” (1). Describing the diverse neural populations and interconnected organization of the healthy central nervous system, Dr. Ramón y Cajal’s words are equally true in the case of neuropathology. Alzheimer’s disease (AD) and Parkinson’s disease (PD) are primary examples. These neurodegenerative diseases can be caused by the combination of environmental factors, lifestyle, and multiple genetic variations—including changes that occur outside of traditionally defined genes—that remain mostly uncharacterized.
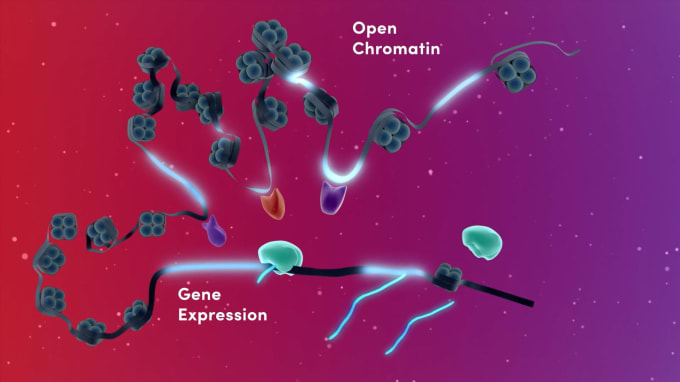
As scientists look to decipher the complex genetic landscape of neurodegenerative disease, they must grapple with the impact of genetic variation that occurs in these mysterious noncoding areas of the genome. The human genome is 3 billion base pairs long and contains over 20,000 functional genes. However, as much as 99% of the genome is composed of "noncoding sequences," meaning they do not yield functional protein when expressed. But don’t count out these mysterious sequences yet. Noncoding areas of the genome contain important regulatory elements, including enhancers and promoters, regions of DNA that provide binding sites for the proteins that carry out transcription and control gene expression patterns in different cell populations. These patterns drive cellular differentiation and influence the normal operation of a cell or biological system, or result in disease when dysregulated.
Elucidating Alzheimer’s and Parkinson’s disease risk loci in noncoding sequences
Deciphering the role of these noncoding regions in disease is crucial to not only understanding the mechanisms of disease but also to pinpointing potential therapeutic targets. In a recent study from Stanford University, scientists led by Dr. M. Ryan Corces and Dr. Thomas Montine, in collaboration with Dr. Howard Chang, sought to understand the contributions of noncoding regulatory variation to neurodegenerative diseases, including AD and PD. Large genome-wide association studies (GWAS), used to examine the association of instances of variation in the genome (single nucleotide polymorphisms, or SNPs) with the manifestation of AD or PD, had already indicated a number of risk loci. However, many of these loci were in noncoding areas of the genome, leaving their true functions unclear. For example, SNPs in these noncoding sequences might suggest the nearest gene, with respect to physical proximity, is a potential disease driver. Alternatively, noncoding sequences could contain regulatory elements that alter the expression of other genes in such a way that produces disease features (2). Moreover, because these genetic variations are present in all cells’ genomes, it’s challenging to determine which specific cell populations utilize a given noncoding region for executing possible gene regulatory programs.
To resolve the functional role of noncoding variation in AD and PD, the research team sought to identify functional noncoding regulatory elements that may be impacted by disease-associated genetic variation previously identified through genome-wide association studies. First, using bulk ATAC-seq (Assay for Transposase Accessible Chromatin), they profiled the chromatin accessibility landscape of 7 different brain regions, across 39 cognitively healthy donors, representing diverse areas of brain function and cell composition that are relevant to neurodegenerative diseases. This identified 186,559 areas of chromatin accessibility, indicating prospective regulatory elements, across the genomes of the sampled brain cells. The team found evidence against a regional effect involving all or most cell types in a particular area of the brain, highlighting the likelihood of involvement of specific cell types in specific regions of the brain. This led the authors to refine their analysis with single cell resolution.
Unraveling the mystery of noncoding regulatory variation with single cell ATAC-seq
Leveraging single cell ATAC-seq (scATAC-seq), they profiled 10 additional samples across 4 different brain regions, totaling 70,631 individual cells. This identified 24 cell clusters, which were assigned to known brain cell types based on the unique activation of key lineage-defining genes observed in the chromatin accessibility data for each cluster. Importantly, 89% of bulk ATAC-seq peaks were also identified through the scATAC-seq analysis, while only 34% of the scATAC-seq peaks were overlapped by a peak from the bulk ATAC-seq data set. This demonstrated the utility of single cell analysis in situations where cell type–specific peaks are difficult to identify from bulk tissues containing many different cell populations. Another key finding was that 48% of the peaks called in the single cell ATAC-seq data were specific to a single cell type and included peaks from typically less abundant cell types. Overall, this data provided a powerful reference map for the regulatory elements that drive adult brain cell identity, from oligodendrocytes, to microglia, to neurons.
Additionally, these insights into cell type–specific regulatory programs supported the refined annotation of neuronal subpopulations. From their original 24 clusters, the authors performed analysis to extract all cells labeled as neurons, then further subdivided them into 30 distinct neuronal clusters, representing a unique cell type or state, once again on the basis of prospective lineage-defining gene activity observed in the single cell ATAC data. This allowed not only granular classification of neurons from the same brain regions, including striatopallidal and striatonigral medium spiny neurons that project to different brain areas, but also revealed neuronal cell class–specific peaks, genes, and transcription factor activity. Thus, the rich insights learned from scATAC data can support highly granular cell-type annotation through the interrogation of epigenomic features, and further study of their impact on gene expression in the same single cells.
Finally, the Stanford team returned to neurodegeneration-related GWAS SNPs, looking to determine if these spots of genetic variation overlapped with any chromatin accessibility peaks identified with the addition of scATAC data and what specific cell types and genes they may affect. Leveraging a machine learning approach, they scored AD– and PD–associated SNPs according to their overlap of areas of chromatin accessibility; their putative effect on predicted enhancer–promoter interactions, previously identified via the combination of Hi-C library preparation and chromatin immunoprecipitation techniques (HiChIP) and scATAC-seq; and their putative effect on transcription factor binding ability. This would, in turn, reveal possible genes and molecular processes disrupted by the presence of SNPs and so implicated in AD and PD. Significantly, their approach revealed the specific causative SNPs involved in a number of AD–associated genes. For example, the SLC24A4 locus contains 46 SNPs, but through this study, one SNP was shown to occur within a microglia-specific peak that disrupts an SPI1 motif and communicates specifically with the promoter of the RIN3 gene, known to be active in the early endocytic pathway that is crucial for microglial function.
Additionally, their study showed promise to reveal the role of noncoding polymorphisms in genes previously unassociated with PD. They keyed in on the ITIH1 GWAS locus which contains 317 SNPs. One SNP occurred within a putative microglia-specific intronic regulatory element of the STAB1 gene, which encodes a transmembrane receptor protein essential for lymphocyte homing and endocytosis of ligands like low-density lipoprotein. The SNP in question was predicted to disrupt the KLF4 transcription factor binding site within this regulatory element, which would in turn disrupt STAB1 gene expression. Together, these findings point to dysregulated STAB1 expression in microglia as a potential contributor to disease.
Bringing clarity to the role of noncoding regulatory variation in disease
The functional contributions of noncoding sequences to health and disease may not be so mysterious anymore. As this study of AD– and PD–associated GWAS SNPs demonstrates, the ability to measure chromatin accessibility at single cell resolution provides a window into previously obscured noncoding regulatory elements controlling gene expression and, ultimately, the manifestation of disease in specific cell populations. Further, confirmation of the functionality of the transcription factors involved in these putative enhancer–promoter interactions, including the direct linkage of their activity on gene expression patterns in the same cells, can expand the therapeutic target options to treat AD, PD, and other complex diseases similarly affected by noncoding variation.
To learn more about this study, read the published paper here.
For more information about solutions from 10x Genomics that enable integrated analysis of single cell ATAC-seq and gene expression data, explore these resources.
References
- S Ramón y Cajal. The structure and connexions of neurons. Nobel Lecture. (1906). https://www.nobelprize.org/uploads/2018/06/cajal-lecture.pdf.
- MR Corces et al., Single-cell epigenomic analyses implicate candidate causal variants at inherited risk loci for Alzheimer’s and Parkinson’s diseases. Nat Gen. 52, 1158–1168 (2020).