Plotting the course of multiple sclerosis lesions with single cell spatial imaging

*Impact at a glance: Explore the power of the Xenium In Situ platform to characterize the cellular landscape of diseased tissue and bolster traditional pathology. In a study of two human multiple sclerosis lesions, researchers leveraged Xenium to characterize cellular changes indicative of pathology and demyelination that had been missed by histopathological analysis.*
Get a cup of coffee. Read this article. Have a snack. Check your email. By the time you’ve done these things, another person—one of 200 every week—will have been diagnosed with multiple sclerosis (MS).
That person will learn that the pain, tingling, fatigue, numbness, vision problems, and mood or memory changes place them in the company of 2.8 million other people worldwide. They will wonder whether, and how quickly, their symptoms will worsen. And they will be faced with the challenge of accepting this as their new normal because there is no known cure.
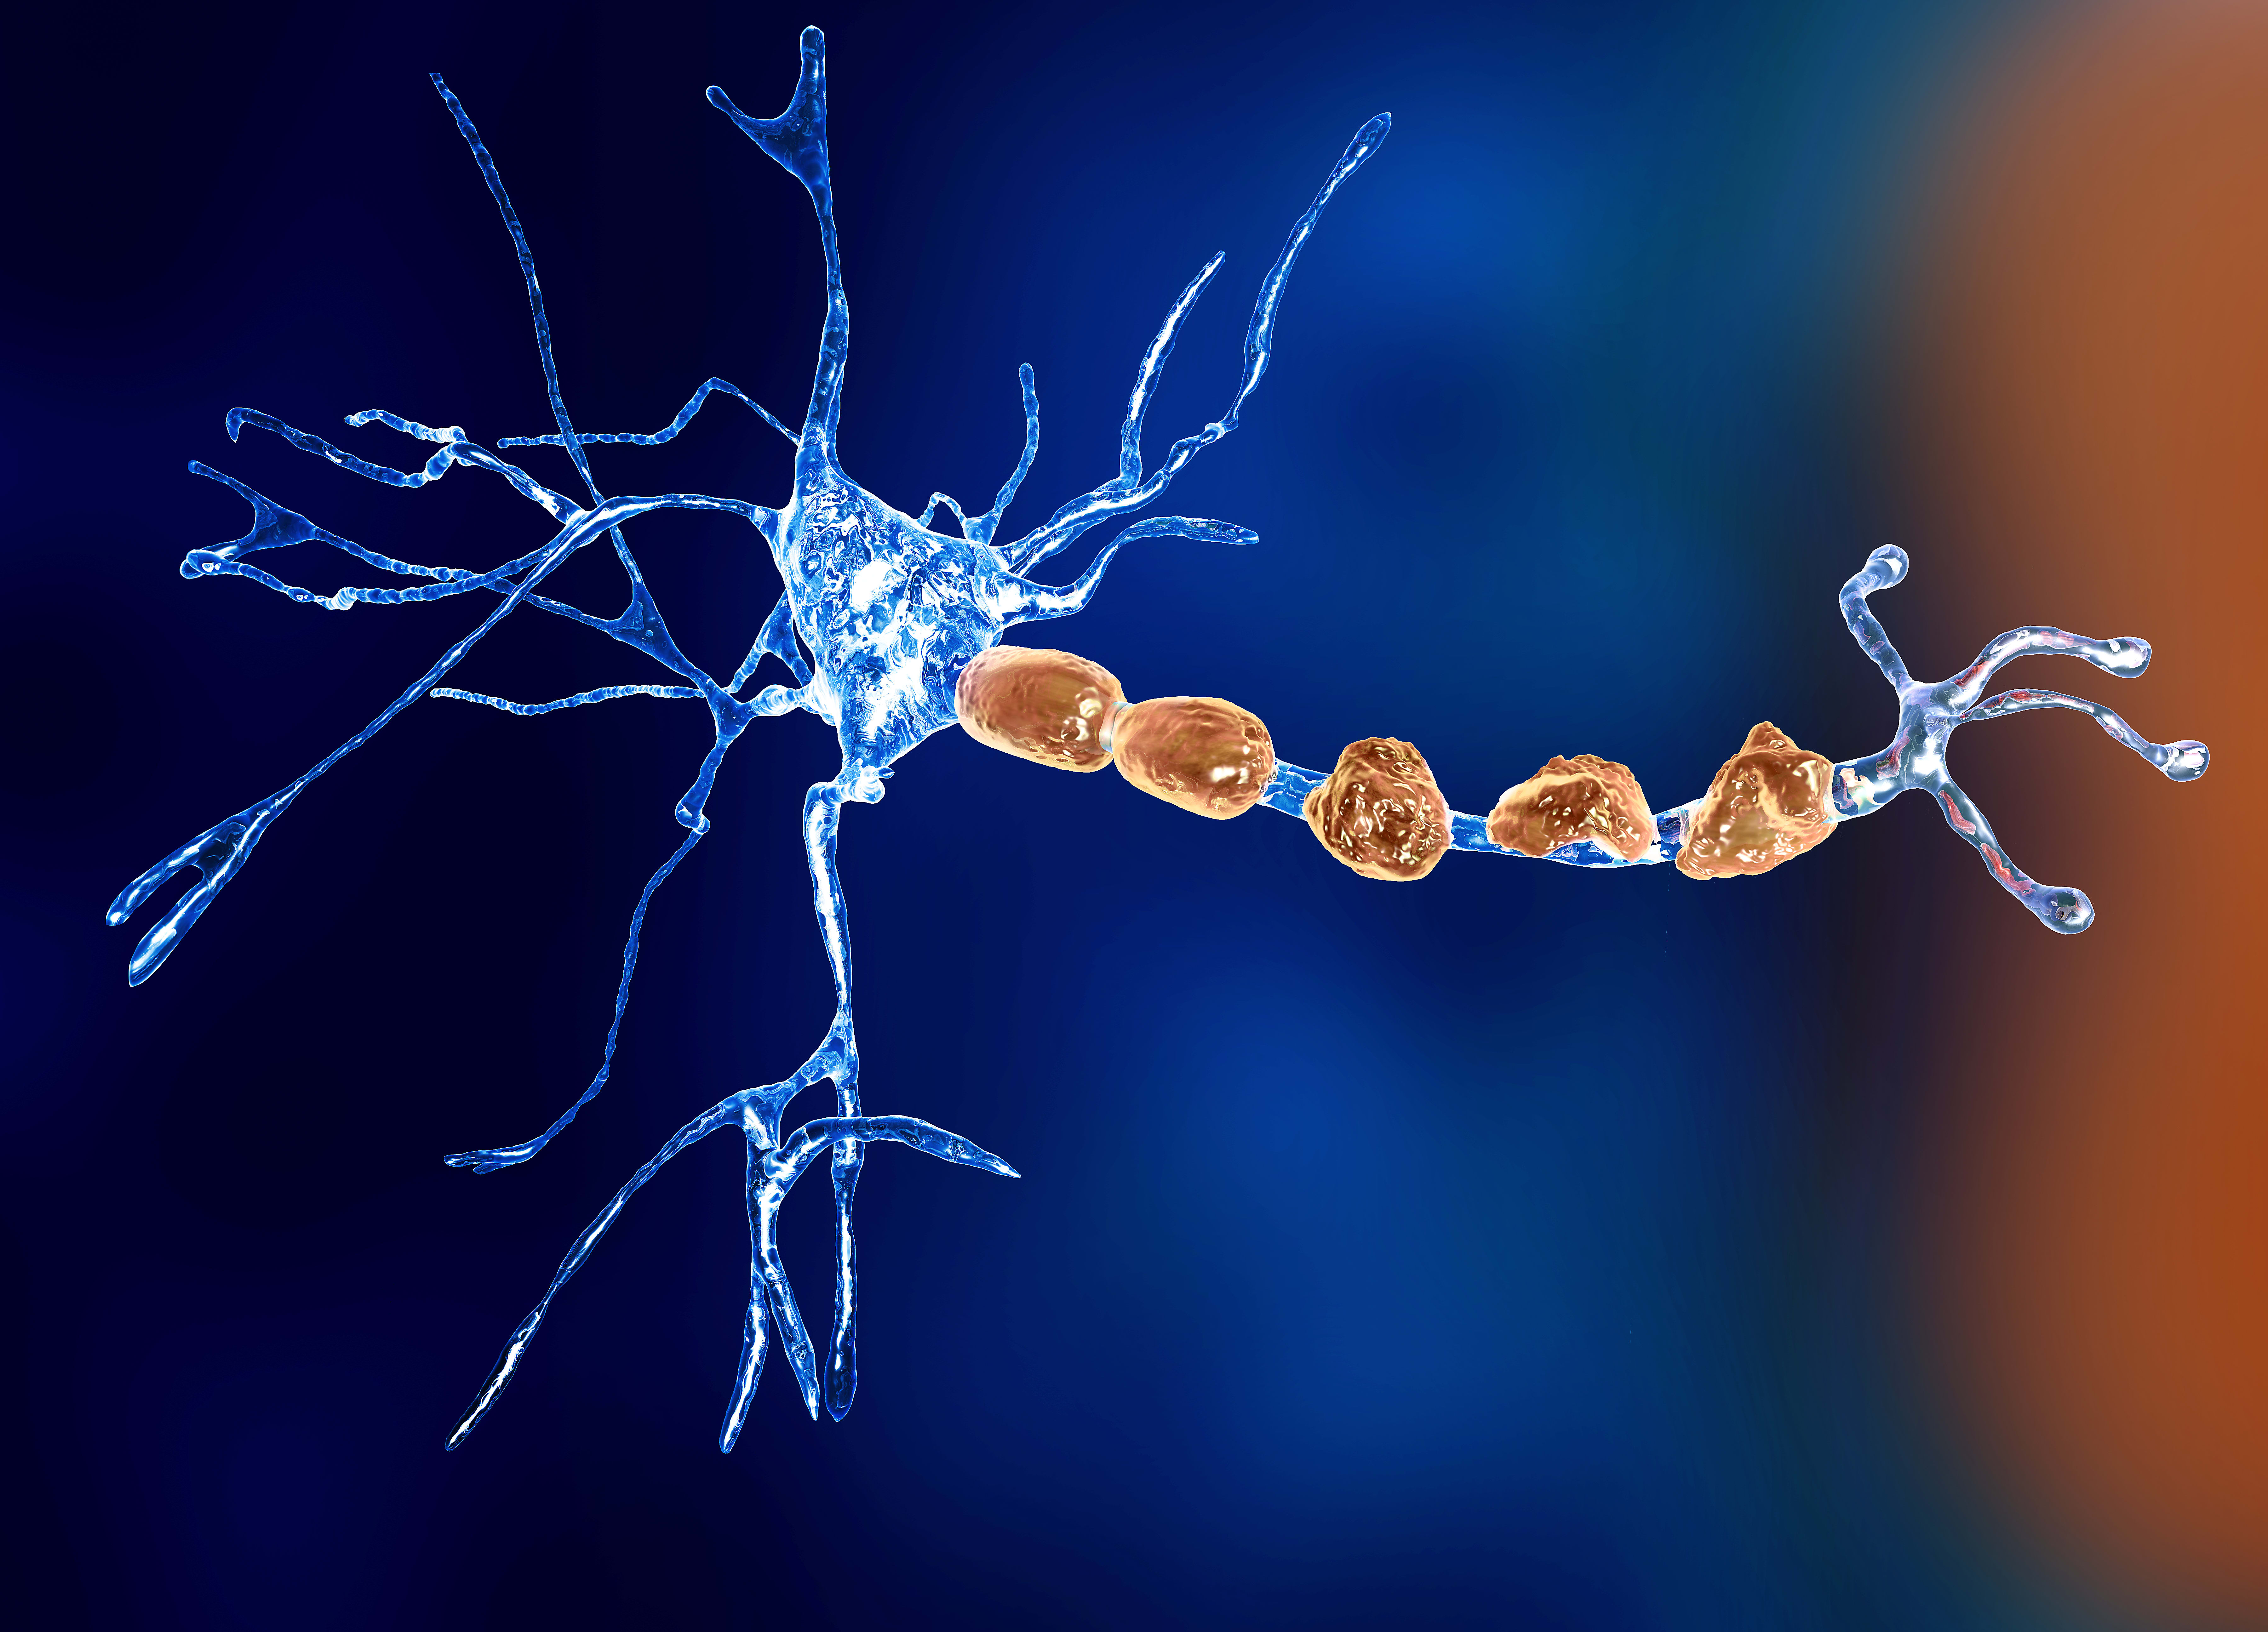
While efforts are underway to develop a cure, understanding MS is complicated by the anatomical, spatial, and cellular heterogeneity of the central nervous system (CNS) lesions that drive it. While new lesions can develop anywhere in the CNS, in some patients they seem to form in very specific area(s). Lesions may be inactive, actively demyelinating tissue, a mixture of active and inactive, or may even remyelinate tissue. Single cell technologies have provided insights into what cell types are involved in these lesions, but where these cells are located in the lesions—and whether they are performing harmful or helpful functions—remains an open question.
To shed light on this important question, researchers recently dug into the spatial dynamics of MS, using novel single cell spatial imaging technologies to get a high-resolution look at the cellular landscape of these lesion microenvironments and how they may drive disease (1).
Testing the waters: Characterizing the cellular landscape of MS-like lesions
“Disease-associated glia were the most abundant within the spinal cords at peak EAE. Importantly, they were also detected within the brain and the late-stage spinal cords, suggesting both early induction and persistence of DA-glia cell states along the EAE disease course.” –Langseth et al.
Leveraging the experimental autoimmune encephalomyelitis (EAE) mouse model of MS and a 239-gene panel guided by single cell studies of MS and known disease-associated cell markers, researchers employed CartaNA in situ* to plot out the cellular landscape of lesions with both spatial and temporal context in MS-like pathology.
Analyzing coronal brain, cervical, thoracic, and lumbar tissue across various time points of disease, the group identified a total of 41 unique cell populations, including all major homeostatic CNS cell types. While these homeostatic cell types were seen in both EAE and control mice, EAE mice exhibited a sharp increase in disease-associated cell types, including microglial and astrocytic subtypes, as well as T-cell populations (which were specific to EAE mice).
These cell types also exhibited a strong spatial dependency, with densities of infiltrating immune cells decreasing along the spinal cord moving closer to the brain (matching the temporal pattern of lesion formation in EAE mice). Intriguingly, while the EAE model does not develop lesions in the brain, researchers found EAE-enriched immune cell populations in both the ventricle and medial corpus callosum, indicating a spatial component to inflammation and lesion formation in this MS-like pathology.
*CartaNA is now part of 10x Genomics.
Plotting the course of MS pathology and progression with single cell spatial imaging
“With increased immune infiltration and proliferation within the spinal cord, lesions compartmentalise and undergo a concentric centrifugal expansion.” –Langseth et al.
Distinguishing lesions in EAE using histology is straightforward but limits our classification of the tissue of interest to the binary of “lesion” or “not lesion.” To develop a better way of characterizing these lesions, the researchers leveraged their in situ data to characterize cellular “neighborhoods.”
Using this approach, they were able to distinguish not just defined anatomical regions in both spinal cord and brain, but five transcriptionally distinct subregions (termed “compartments”) in lesions. One sub-compartment was specific to the corpus callosum in the brain. Another compartment exhibited both spatial (lumbar spinal cord) and temporal (late EAE) specificity. Finally, the remaining three compartments were widespread in the spinal cord at the “peak EAE” time point.
Their distribution, however, was not equal—and the group made an interesting discovery when overlaying these sub-compartments on complex and simple lesions in peak EAE. Complex lesions furthest from the brain (e.g., more likely to be the oldest lesions) consisted of all three compartments: the lesion core compartment (LCC), the lesion rim compartment (LRC), and the peri-lesion compartment (PLC) (closest to furthest from the core, respectively).
The researchers then discovered that the simplest lesions closer to the brain with one compartment were composed of the PLC, while those with two compartments had the LRC rim compartment at their core with PLC at the edge. Combined, both the anatomical distribution and in situ data are consistent with the notion that lesions start in a PLC state, and, as the lesion spreads, the core changes into the LRC rim compartment and then the LCC core compartment, providing a framework for lesion initiation and evolution.
Charting connections between cells with spatial context
“We observed a segregation of monocytes, dendritic cells and T-cells from other cell types, consistent with the formation of lesion core compartments (LCC).” –Langseth et al.
While single cell transcriptomics technologies revolutionized how we analyze cell–cell interactions, the answers they provide can be limited due to the lack of spatial context. Using the CartaNA single cell spatial imaging technology, however, researchers were able to combine transcriptomic data with spatial information for a more accurate view of cell interactions in MS-like pathology.
While distinct modules were seen in both anatomically and temporally distinct niches, researchers found a unique hub consisting of monocytes, T cells, and other cell types in the spinal cord of late EAE. Unlike modules observed in the brain, disease-associated oligodendrocytes preferentially interacted with other disease-associated glia (astrocytes and microglia) rather than T cells, consistent with the idea that this module may not be induced by immune cell interactions.
Using these prospective cell interactions as a guide, the group next sought to find ligand–receptor interactions that could act as triggers for disease-associated cell states. Pairing single cell RNA-seq data with their single cell spatial imaging approach, they uncovered a host of potential mechanistic interactions between damage-associated oligodendrocytes, homeostatic oligodendrocytes, and disease-associated microglia, including members of the complement family and myelination-modulating complexes.
A new horizon: Bringing better tools to human pathology
“The newly identified lesion and pathological sub-compartments highlight the power of [this method] to identify pathological changes not uncovered by histopathological analysis.” –Langseth et al.
To determine whether these findings reflected changes in human MS, the researchers turned to single cell spatial imaging with Xenium In Situ. Using this technology, they analyzed two human spinal cord samples that presented with both active and inactive lesions, and had been previously pathologically annotated to serve as a comparison with their Xenium data.
Echoing their earlier successes, the researchers transcriptionally identified 38 distinct cell types and used them to characterize neuroanatomically distinct regions. They then applied these clusters to characterizing lesions, identifying 9 unique compartments encompassing both active and inactive lesions in their human MS patient samples.
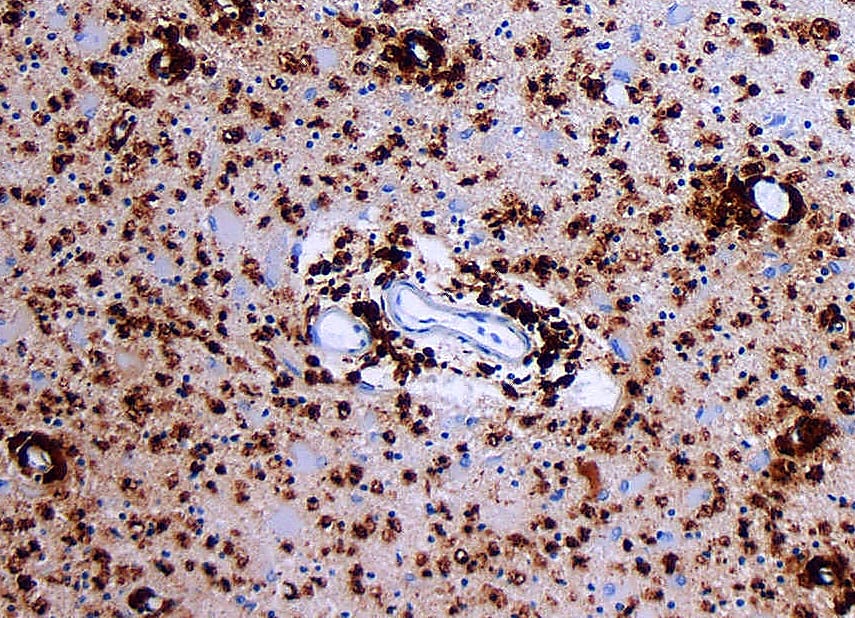
Applying these findings highlighted the power of Xenium to bolster traditional pathology. In one instance, a lesion was neuropathologically annotated as non-demyelinating. The researchers, however, noted reductions in oligodendrocytes as well as myelin markers, consistent with reduced myelin and pathological changes.
The second instance was even more exciting: in one of the human samples, only one lesion had been annotated neuropathologically. Xenium analysis revealed two more areas on that same slide that exhibited similar compartmental composition to the annotated lesion, representing an area of interest that had not been identified by traditional neuropathological methods.
10x marks the spot: Digging down into single cell spatial
The work highlighted in this article offers not only an unprecedented look into the architecture and evolution of MS pathology, but also the ways that new tools can drive science forward. Combining single cell resolution with spatial imaging enabled this group to identify cellular interactions, dig into potential mechanisms of pathological states, and expand on traditional pathology for a clearer view of the underlying biology of disease.
Get the full picture by reading their preprint, or learn more about how Xenium can help you glean greater insights into the biology of disease here.
References:
- Langseth CM, et al. Single cell-resolution in situ sequencing elucidates spatial dynamics of multiple sclerosis lesion and disease evolution. bioRxiv (2023). doi: 10.1101/2023.06.29.547074