More than a Software Package: Exploring Data Analysis and Visualization for the Visium Spatial Gene Expression Solution (Part 3)

Explore how raw sequencing data becomes spatial gene expression data through our Space Ranger analysis pipeline in this final part of our three-part series following the experiment designed by Spatial Challenge Winner Dr. Christoph Kuppe, a member of the Kramman Lab at Germany’s RWTH Aachen University.
Please read Part 1 and Part 2 if you haven’t yet!
The final output of all wet lab steps from the Visium Spatial Gene Expression Solution is a small tube of prepared cDNA ready for Next-Generation Sequencing. This cDNA library contains spatially barcoded molecules which represent what genes were expressed, how much those genes were expressed, and where they were expressed within the tissue sections placed on the capture areas of the Visium Spatial Gene Expression slides. The following experimental steps, including sequencing and data analysis using Space Ranger and Loupe Browser, enable scientists to uncover spatial gene expression patterning, visualize and interact with the data, and leverage it to address their research questions.
How are cDNA libraries sequenced?
10x Scientists used a standard short-read sequencer, in this case an Illumina NovaSeq 6000, to analyze the prepared cDNA library derived from human heart tissue affected by myocardial infarction. If necessary, researchers can give their cDNA libraries to their university or organizational sequencing facility, or work with 10x Genomics’ Certified Service Providers to perform this step in the experimental workflow.
For more information about sequencing, visit our support website.
How Raw Sequencing Data Becomes Spatial Gene Expression Data
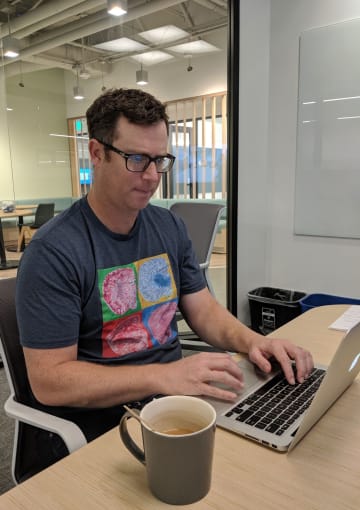
Stephen Williams, Senior Computational Biologist at 10x Genomics, explained how the subsequent steps unfold in the Space Ranger analysis pipeline.
The output of sequencing is a FastQ file, containing sequencing data. This data includes base calls (A, C, T, G and N) with a quality score indicating the probability of error for each base call. These files are then put into the Space Ranger analysis pipeline, which aligns sequencing reads to the genome and provides a matrix.
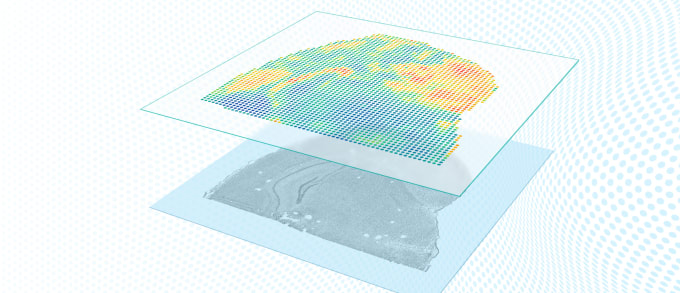
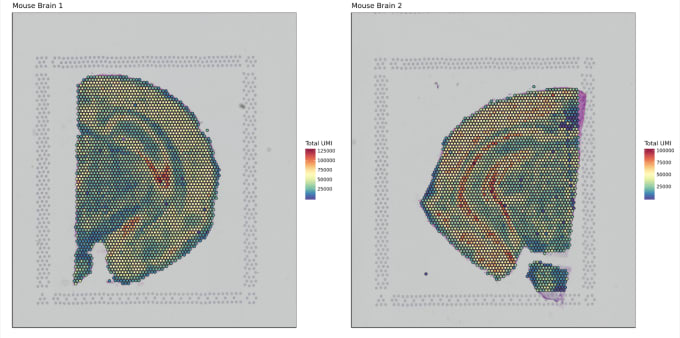
What is the matrix? Simply, it’s a file that contains information about the raw levels of gene expression in the tissue. Space Ranger produces the matrix file using unique molecular identifiers (UMIs) to count the molecules of a certain gene detected in a particular spot within the tissue. In essence, the matrix yields biologically meaningful data about what genes are expressed, where they’re expressed, and to what quantitative degree.
Preliminary analysis using Space Ranger revealed some important quality metrics for the heart tissue provided by Dr. Kuppe. 10x Scientists observed approximately 3,000 genes per barcoded spot. They also saw between 3,000 and 12,000 UMIs per spot, noting that lower UMI counts were typically seen in highly necrotic tissue affected by myocardial infarction.
What is it really like to use Space Ranger?
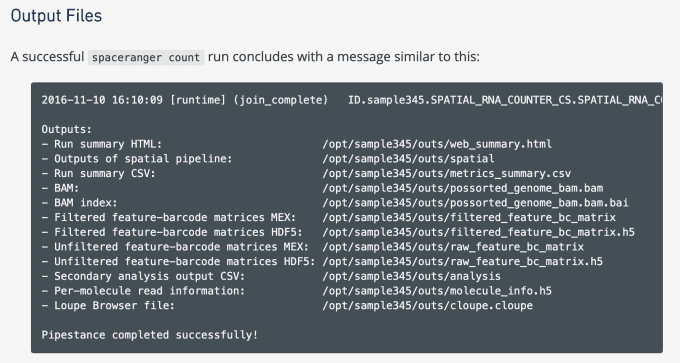
At first glance, this is a complex software, and a potentially daunting tool for scientists who are new to sequencing. However, what you might not know is that Space Ranger is highly automated. Stephen explained that the files and algorithms that make Space Ranger work are self contained in the software. All a researcher needs to do is feed Space Ranger their FastQ files with sequencing data and a high resolution image of their tissue sections. Space Ranger will take care of the rest.
From a computation and storage perspective, Space Ranger is also quite accessible. It runs on computer clusters that are available at most universities, while the gene expression matrix and associated image are easily stored and leveraged on a personal laptop. As Stephen explained, the matrix is only about 10 MB, easily shared via email.
This means that a standard pathology lab might already have all of the tools it needs to begin using the Visium Spatial Gene Expression Solution. Indeed, this solution is available to a wide audience of researchers. This includes those who might not have experience with sequencing or coding, as well as those who have already been using single cell sequencing solutions, considering the analysis pipelines and output for Cell Ranger and Space Ranger are so similar.
How to Visualize Spatial Gene Expression Data
Following preliminary analysis by Space Ranger, data from 16 heart tissue samples were returned to Dr. Kuppe for further study, including visualization of the spatial gene expression data.
With these samples, Dr. Kuppe received an example R notebook, created by the Computational Biology team at 10x. This notebook enabled visualization of spatial gene expression data without Loupe Browser, which at the time, was not yet released to 10x customers. Stephen emphasized one pro-tip regarding R notebooks:
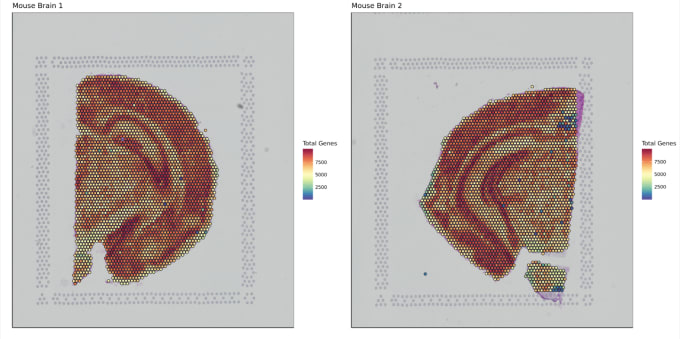
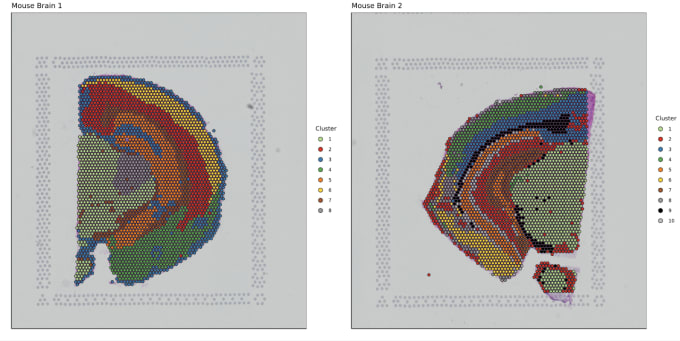
Pro-Tip #1. Loupe Browser is now available for customers to use, but they can still access R notebooks on our support website. R notebooks enable researchers to perform deep analysis on their samples, including viewing multiple genes, samples, or features - like genes, UMIs and clusters - at once. This may be particularly helpful if a researcher wants to examine samples with different characteristics or under unique experimental conditions: for example, a wild type, diseased and treated sample. Additionally, R enables development of plots and figures using spatial gene expression data.
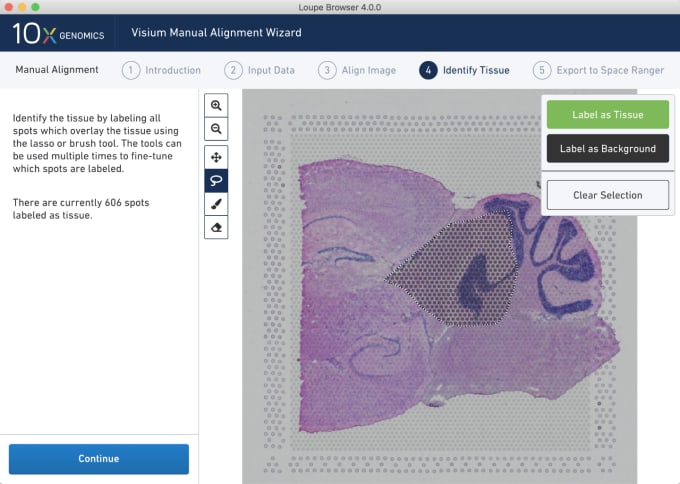
Stephen also described some of the functions of Loupe Browser. Though Space Ranger uses automatic image detection algorithms, there are certain cases where a manual annotation path becomes necessary:
Pro-Tip #2. Use Loupe Browser’s manual functionality to annotate atypical images. For example, tissue sections may fall outside the capture area boundaries and obscure the fiducial border. Or, tissue sections may have holes that require fine-tuning to avoid incorporating background spots in downstream analysis. In these cases, the lasso function allows you to draw edges around the tissue, redefining its borders.
You can explore more of the dynamic visualization capabilities of Loupe Browser on our support website.
That’s it for Part 3! Many thanks to Stephen Williams for teaching us how to enter the matrix, and to our Software Team, Technical Writing Team and Support Scientists, who make using 10x tools possible. And a final congratulations to our Spatial Challenge Winner, Dr. Christophe Kuppe! We look forward to seeing what you will discover about myocardial infarction.
If you’re interested in learning more about the Visium Spatial Gene Expression Solution, please feel free to explore these additional resources:
-
Learn how to perform multi-sample comparative analysis and integrate single cell data with spatial gene expression data in a recent tutorial from the Satija Lab. Explore →
-
How does the Visium Solution work? Read more →
-
How do I get started with spatial gene expression experiments, and perform data analysis? View our webinars →
-
Looking for the demonstrated protocols? Visit our Support Website →