5k Human A0201 | B0702 PBMCs (BEAM-T)
Universal 5' dataset analyzed using Cell Ranger 7.1.0

Learn about Chromium Analysis
Peripheral blood mononuclear cells (PBMCs) from a HLA-A*02:01 | HLA-B*07:02-restricted donor (Cellular Technologies Limited) were enriched via negative isolation and then labeled with a panel of 2 peptides, a HLA-A*02:01 control peptide, and a HLA-B*07:02 control peptide. Then they were sorted for CD8+/PE+ T cells as described in the Sample Prep User Guide for Reagent Assembly, Sample Labeling & Flow Sorting for Barcode Enabled Antigen Mapping (CG000595, Rev A).
Peptides:
- Flu (HLA-A*02:01): GILGFVFTL (BEAM Conjugate 3)
- CMV (HLA-B*07:02) : TPRVTGGGAM (BEAM Conjugate 4)
- HLA-A*02:01 negative control peptide (BEAM Conjugate 5)
- HLA-B*07:02 negative control peptide (BEAM Conjugate 6)
Gene Expression, Antigen Capture (BEAM-T), and VDJ-T amplified libraries were generated from the sorted cells as described in the Chromium Next GEM Single Cell 5' Reagent Kits v2 User Guide (CG000591, Rev A) and sequenced on an Illumina NovaSeq 6000.
Paired-end, dual indexing libraries were sequenced to the following depths:
- GEX: 27,215 mean reads per cell
- Antigen Capture (BEAM-T): 4,574 mean reads per cell
- VDJ-T: 10,041 mean reads per cell
Sequencing read configuration:
- Read 1: 26 cycles (16 bp barcode, 10 bp UMI)
- i5 index: 10 cycles (sample index)
- i7 index: 10 cycles (sample index)
- Read 2: 90 cycles (transcript)
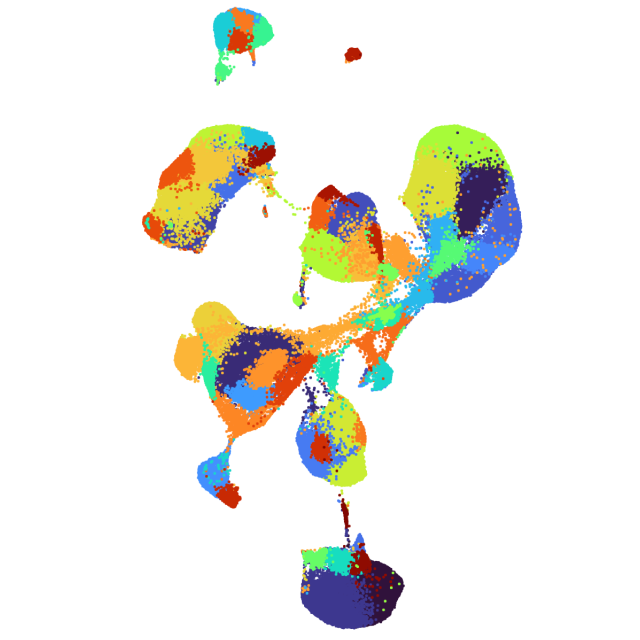
Sequencing data were processed using Cell Ranger v7.1, with web summary and output files available in relevant tabs.
- Cells detected: 3,883
- Median genes per cell: 2,512
- Median UMIs per cell: 5,879
This dataset is licensed under the Creative Commons Attribution 4.0 International (CC BY 4.0) license. 10x citation guidelines available here.