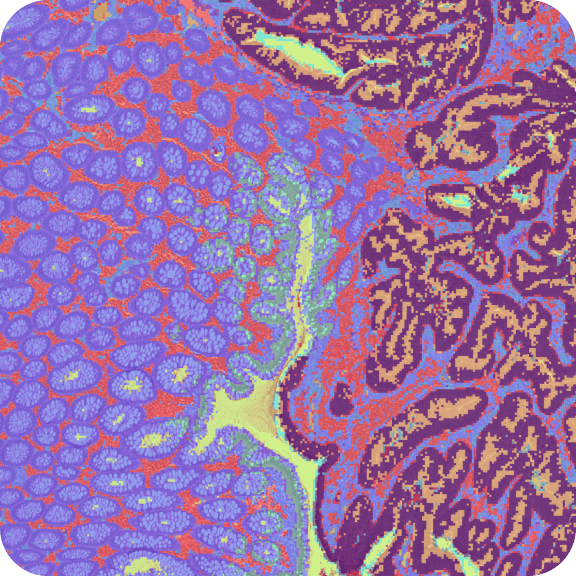
Adult Mouse Brain Section 1 (Coronal). Stains: DAPI, Anti-NeuN
Spatial Gene Expression dataset analyzed using Space Ranger 1.1.0
Learn about Visium Analysis
Adult 10 µm coronal section of mouse brain was obtained from tissue blocks purchased from BioIVT. The section was stained with antibodies and DAPI following following Visium Spatial Protocols Tissue Preparation Guide (CG000240) with Methanol Fixation, Immunofluorescence Staining and Imaging for Visium Spatial Protocols (CG000312).
Samples were stained with antibodies and DAPI as follows:
- 1:200 dilution of Alexa Fluor 488 anti-NeuN (P/N ab190195, Abcam)
- DAPI
Samples were imaged at 20X on a Nikon Eclipse Ti2-E with coverslip down as follows:
- DAPI: Exposure 40 milli sec, Gain 5.1x
- FITC: Exposure 70 milli sec, Gain 6.2x
- TRITC: Exposure 500 milli sec, Gain 17.1x
The cloupe and TIFF files available for download here contain multiple channels or pages respectively. The following table describes the filters and stains corresponding to the channels/pages.
| Channel | Filter | Stain |
|---|---|---|
| 1 | DAPI | DAPI |
| 2 | FITC | NeuN |
| 3 | TRITC | Fiducial Frame |
The Visium Spatial Gene Expression libraries were generated using Visium Spatial Gene Expression Reagent Kits User Guide (CG000239) with Methanol Fixation, Immunofluorescence Staining & Imaging for Visium Spatial Protocols (CG000312). The data was analyzed using Space Ranger 1.1.
- Sequencing instrument: Illumina NovaSeq with NovaSeq S4 Reagent Kit (200 cycles), and Flow Cell ID: HGL22DSXY
- Sequencing depth: 51,648 reads per spot
- Sequencing configuration: Paired-end (28 X 90)
- Sequencing coverage: Read 1: 28bp Read 1 (16bp Visium spatial barcode, 12bp UMI), Read 2: 120bp (transcript), 10bp i7 sample barcode and 10bp i5 sample barcode
- Dual-Index set: T1T2-B8
- Slide: V10M23-089
- Area: C1
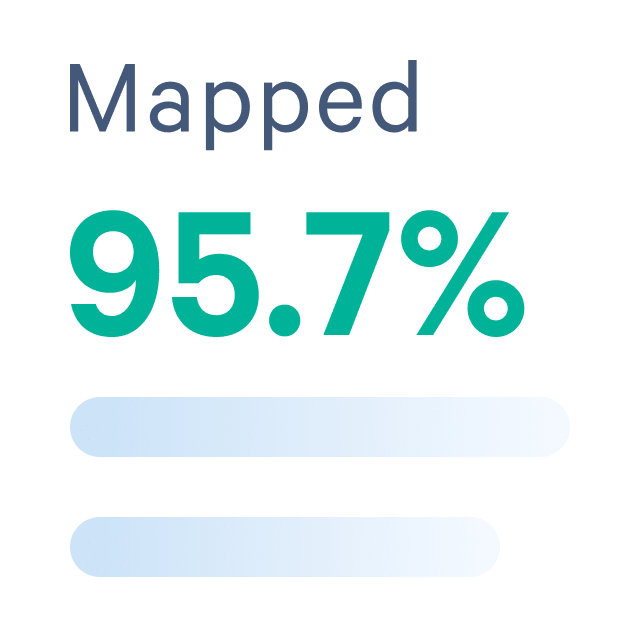
Key metrics were:
- Spots detected under tissue: 2,903
- Median genes per spot: 4,635
- Median UMI counts per spot: 12,911
This dataset is licensed under the Creative Commons Attribution 4.0 International (CC BY 4.0) license. 10x citation guidelines available here.