Open 10x Explorer by double-clicking the application icon.
There are several ways to open datasets in 10x Explorer (see Input Files):
- Navigate to the dataset directory and double-click the manifest file.
- Options from the 10x Explorer All Files window:
- Drag and drop the manifest file over the 10x Explorer application window.
- Click Open New File, or select the dropdown menu to either Select file or Open file from path. If you open a file from path, enter the path to the location where the manifest file is stored on your computer or network drive.
- Load files from your AWS cloud.
The Atera or Xenium Onboard Analysis output files must be in the same directory path as the manifest file (unless you have modified the file paths).
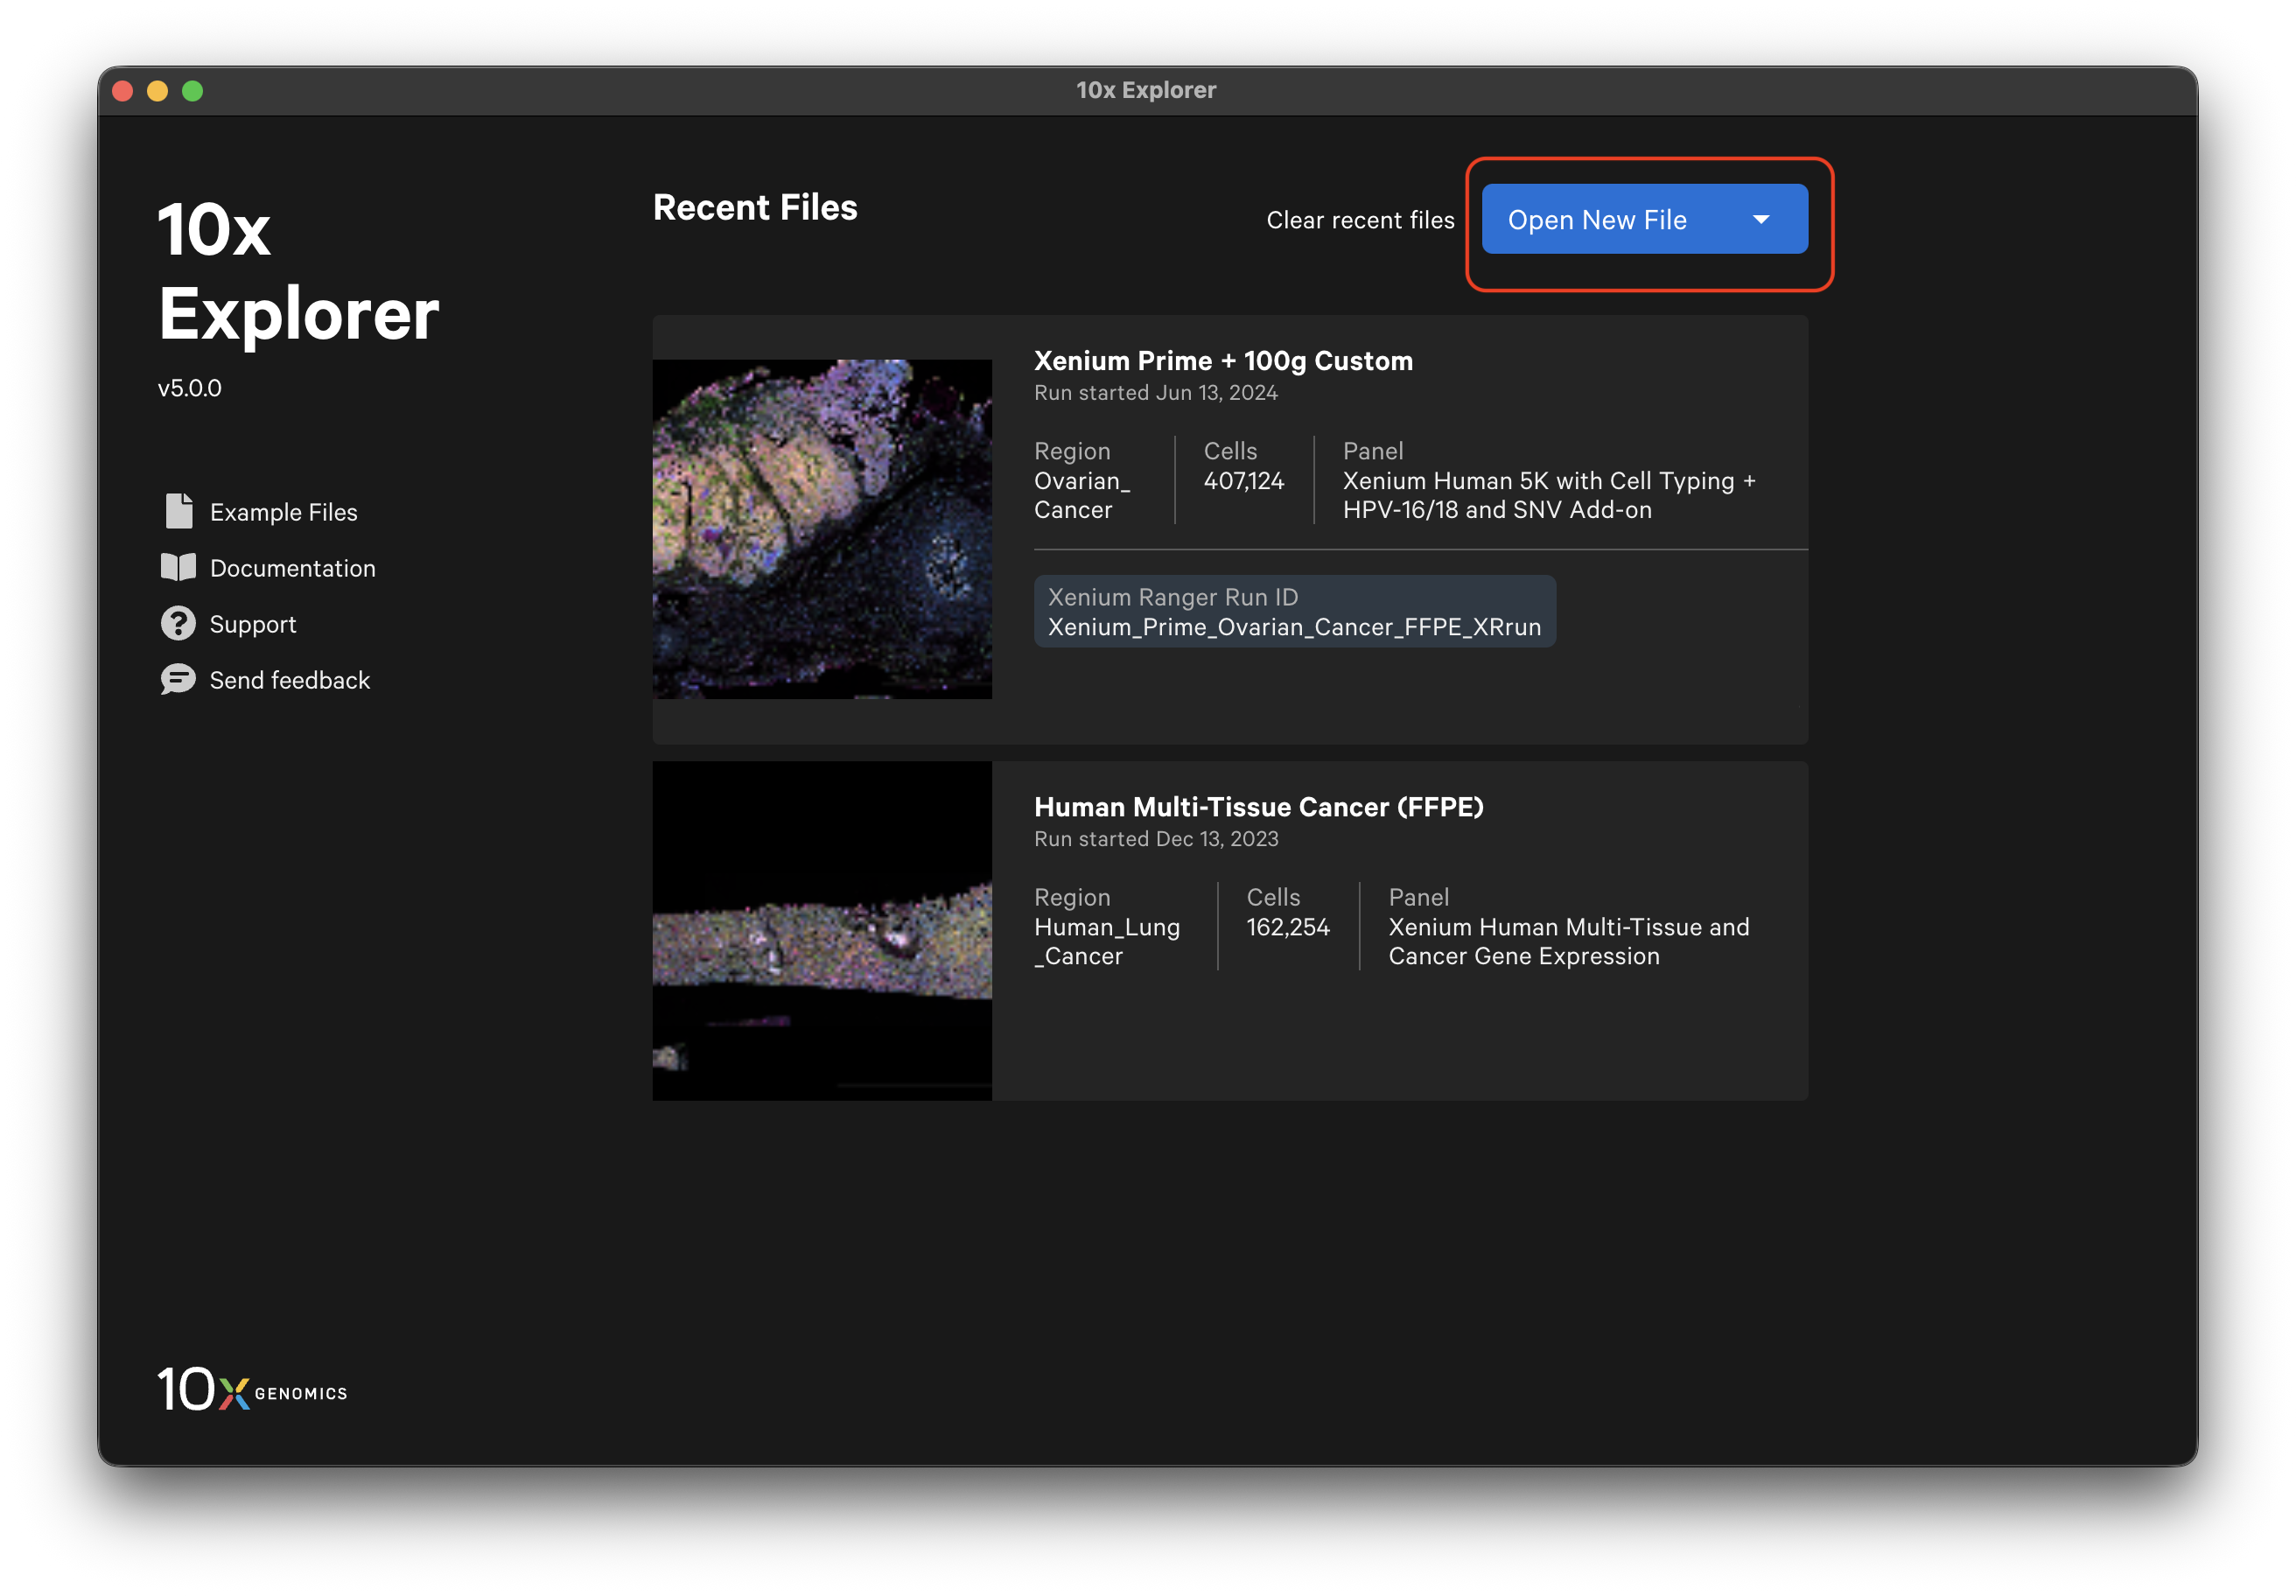
Once you have opened a dataset, the 10x Explorer home page displays options to open or clear recent files. Metadata are shown on the recent file tiles. Up to 100 recent datasets will be displayed.
When you close a dataset, the view settings will be saved automatically as an unnamed saved view (similar to explicitly saving current views). If you open a dataset from the Recent Files menu, 10x Explorer will restore your last view. However, if you open the same dataset from outside the Recent Files menu (drag and drop, double-click the manifest file, or Open New File), 10x Explorer will open with the default initial view (grayscale DAPI image) and the unnamed saved view will be lost. The best way to ensure you can reopen the view state again later is to save your current view before closing 10x Explorer.
After the dataset loads, you should see images of the stained cells and/or nuclei. The following image shows the key components of the 10x Explorer interface. In this UI tutorial, we provide a brief overview of the image, cell, transcript, and annotation features. The Save Current View and Share features are described in the Saving and Sharing Results tutorial.
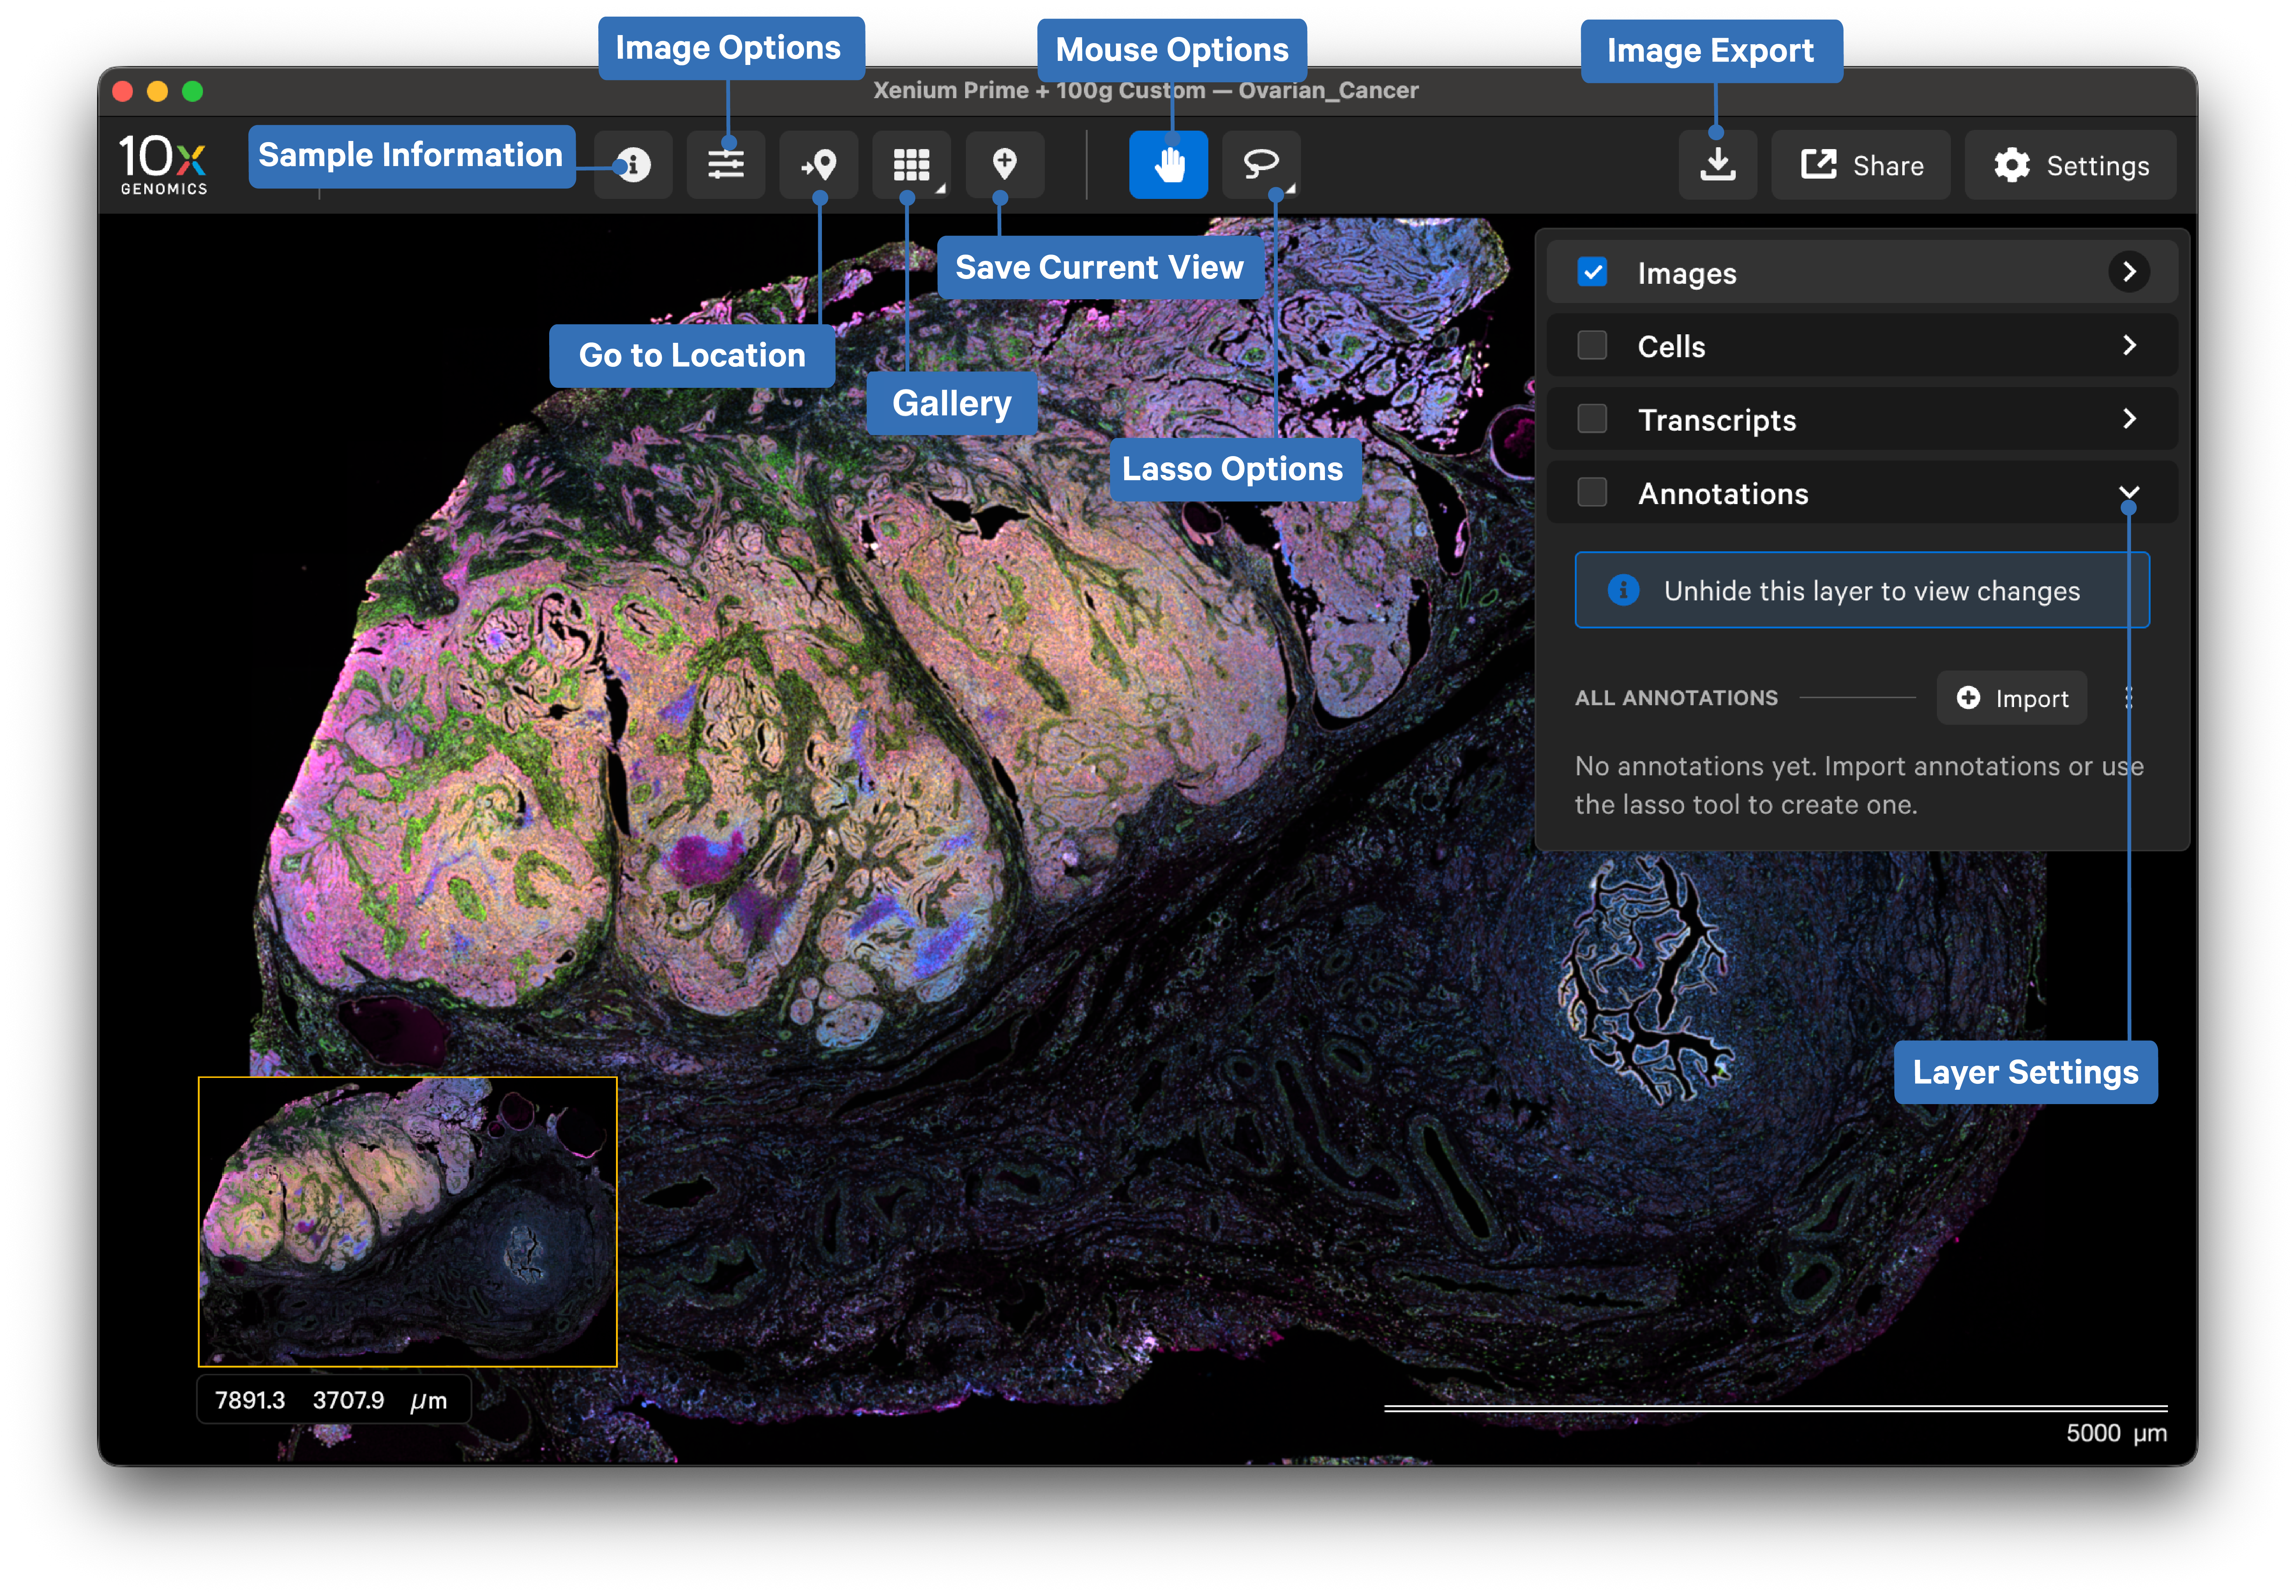
The Sample Information pop-up window displays metadata about the sample run, analysis, and panel. The Run and Panel sections show information entered on the Atera Instrument or Xenium Analyzer instrument during the run set up; they are stored in the manifest file. From the Analysis section, you can open the Onboard Analysis analysis summary HTML file in another 10x Explorer window.
This window also displays the "Panel Design ID" for Gene Expression panels and if used, Xenium Ranger metadata.
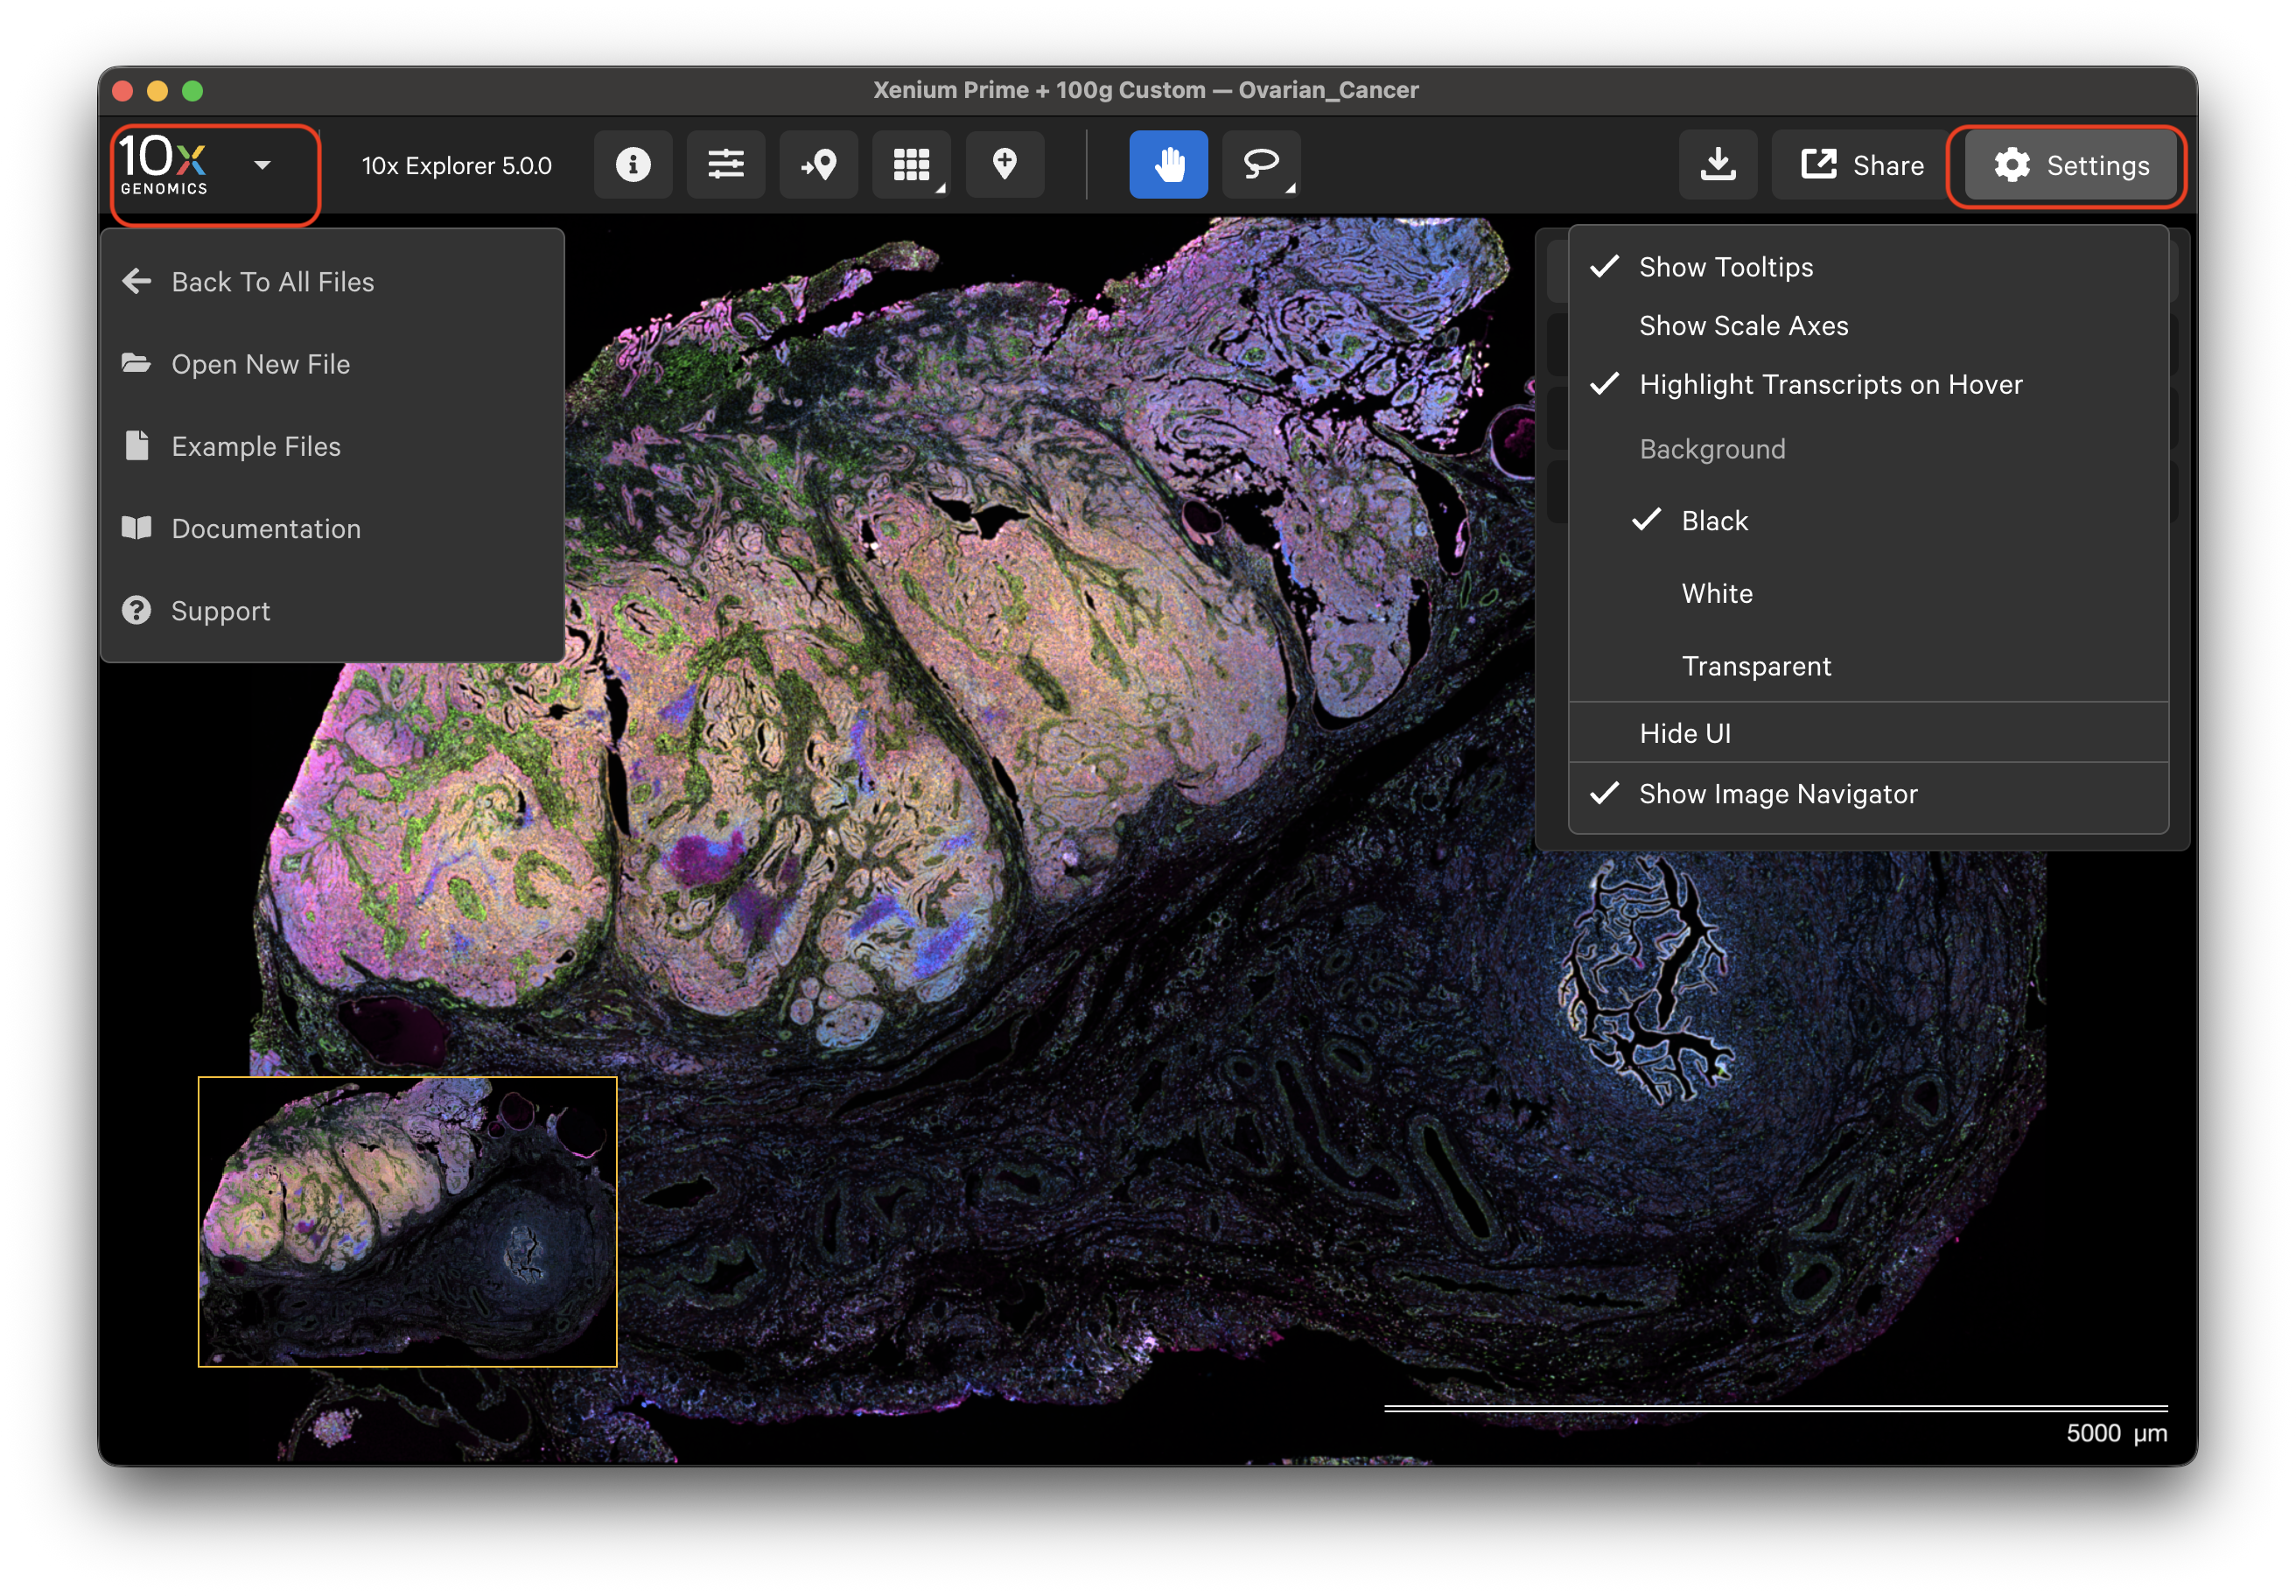
Click the 10x Genomics icon in the top left-hand corner to return to the home screen, open a new dataset, or find support documentation.
The 10x Explorer interface settings are controlled in the Settings menu and with keyboard shortcuts. The Settings menu allows you to show or hide transcript and cell tooltips, image scale axes, the user interface (UI) itself, and the image navigator in the bottom left-hand corner.
Keyboard shortcuts:
| Key | Alternative | Description |
|---|---|---|
| Tab | Settings button | Show/hide UI |
| = (equals key) | Scroll with mouse | Zoom in |
| - (hyphen key) | Scroll with mouse | Zoom out |
| L | Lasso button | Draw a freehand shape with lasso selection tool |
| R | Lasso button | Draw a rectangle with selection tool |
| C | Lasso button | Draw a circle with selection tool |
| P | Pan button | Move the image up and down, or left and right |
Click the download button in the upper right corner to select an image export option. Exported images are saved in PNG format for both options.
Use the Settings options to show or hide the axes (Show Scale Axes) and the picture-in-picture image (Show Image Navigator). The 10x Explorer UI menus are not included in the exported image. You can also change the background to black (default), white, or transparent in the exported image.
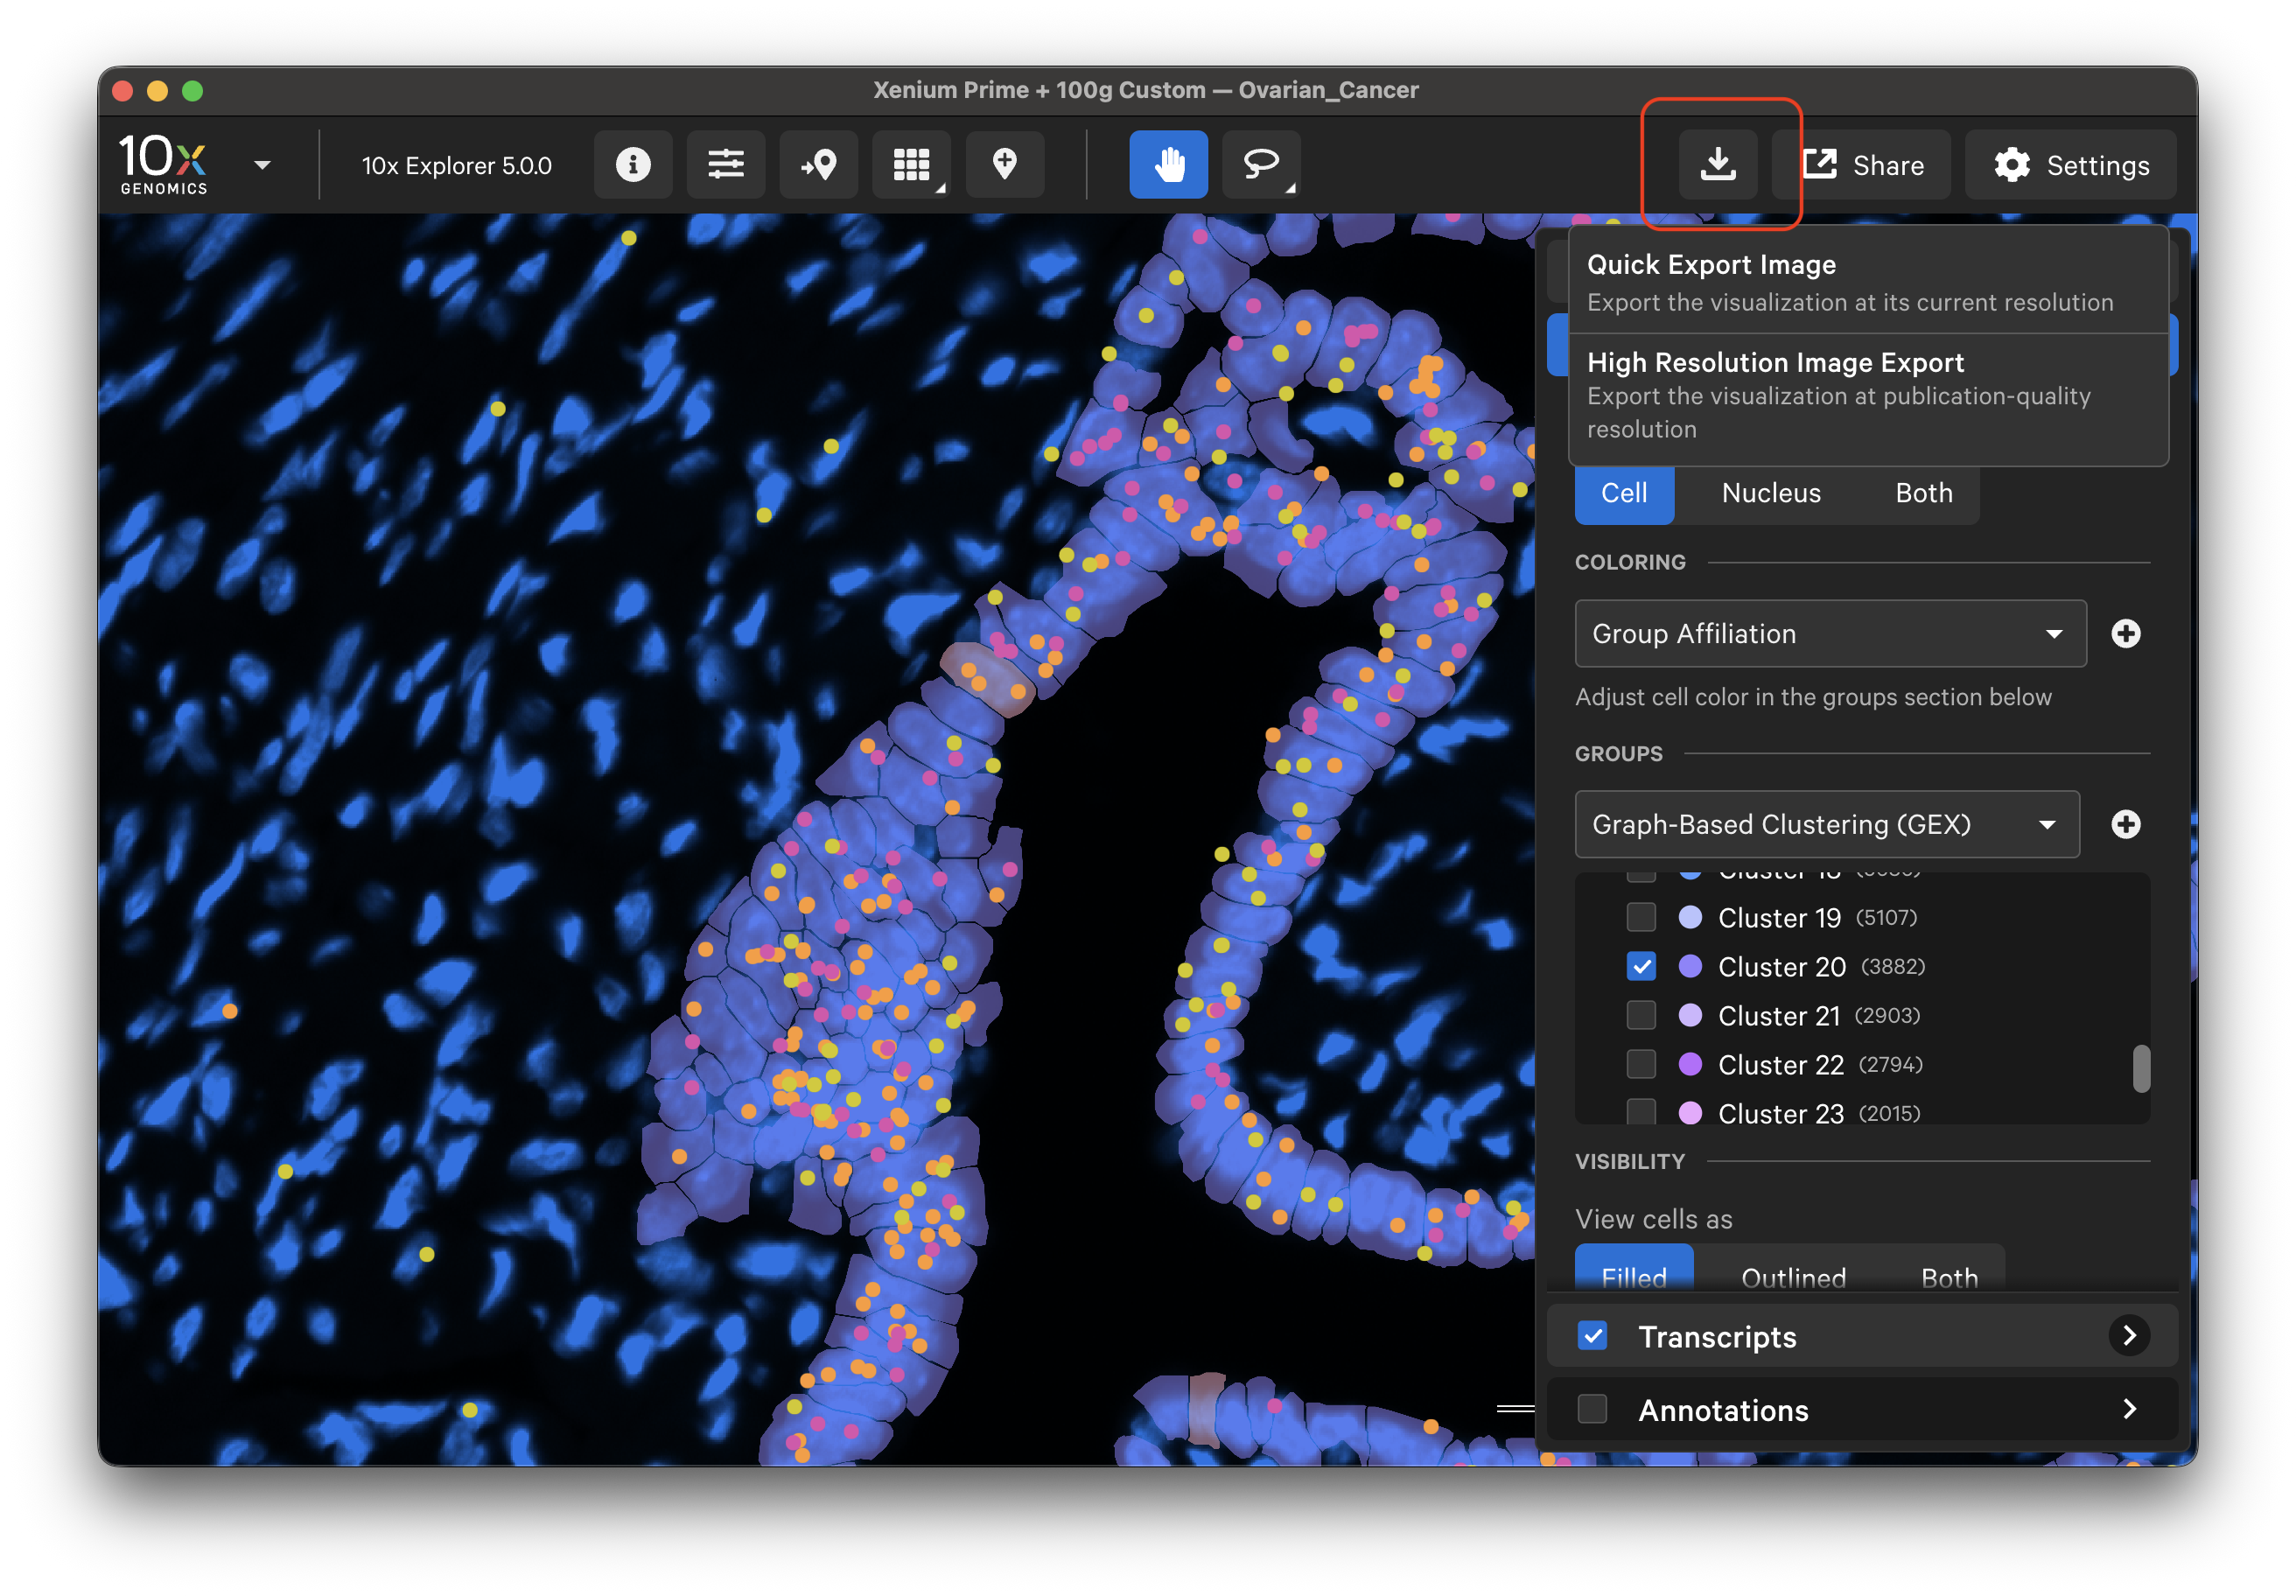
Quick Export Image
Select Quick Export Image to export screenshots of image, cell, and transcript information displayed in the 10x Explorer viewport at their displayed resolution.
High Resolution Image Export
Select High Resolution Image Export. The exported image will match the aspect ratio of the current viewport and include all visible elements of the visualization, without the user interface.
10x Explorer generates the high resolution image by stitching smaller image tiles together, which will appear to flash on-screen as they load. The exported image will include more detail than is currently visible.
- When zoomed in (Image options zoom level >= 0.25), the app zooms in further to the maximum level (8) to capture the image tiles.
- When zoomed out (Image options zoom level < 0.25), the app zooms in further 32x the level of the current image to capture the image tiles.
Transcript points can appear smaller in the exported file than in the app viewport, so we recommend increasing the "Transcript point size scale" to ensure points are visible in the exported file. Depending on the region size, exporting may take a few seconds to several minutes.
The Images, Cells, Transcripts, and Annotations layers allow you to overlay multiple pieces of information in the 10x Explorer viewing area.
The Images layer shows settings to adjust the 3D image stack of the nuclei-stained (DAPI) cells and focus stain image(s). Image import and alignment workflows are also available in this layer. The Image layer is automatically checked when 10x Explorer is opened. Click the links below to learn more.
The Cells layer displays nuclei and cell borders based on cell segmentation results. Check the box next to the layer name to view. Click the link below to learn more.
The Transcript layer displays transcript count data. Check the box next to the layer name to view. Click the link below to learn more.
The Annotations layer displays polygons for selected regions of interest that are both created in 10x Explorer or imported from third-party tools. Check the box next to the layer name to view.
Click the link below to learn more.
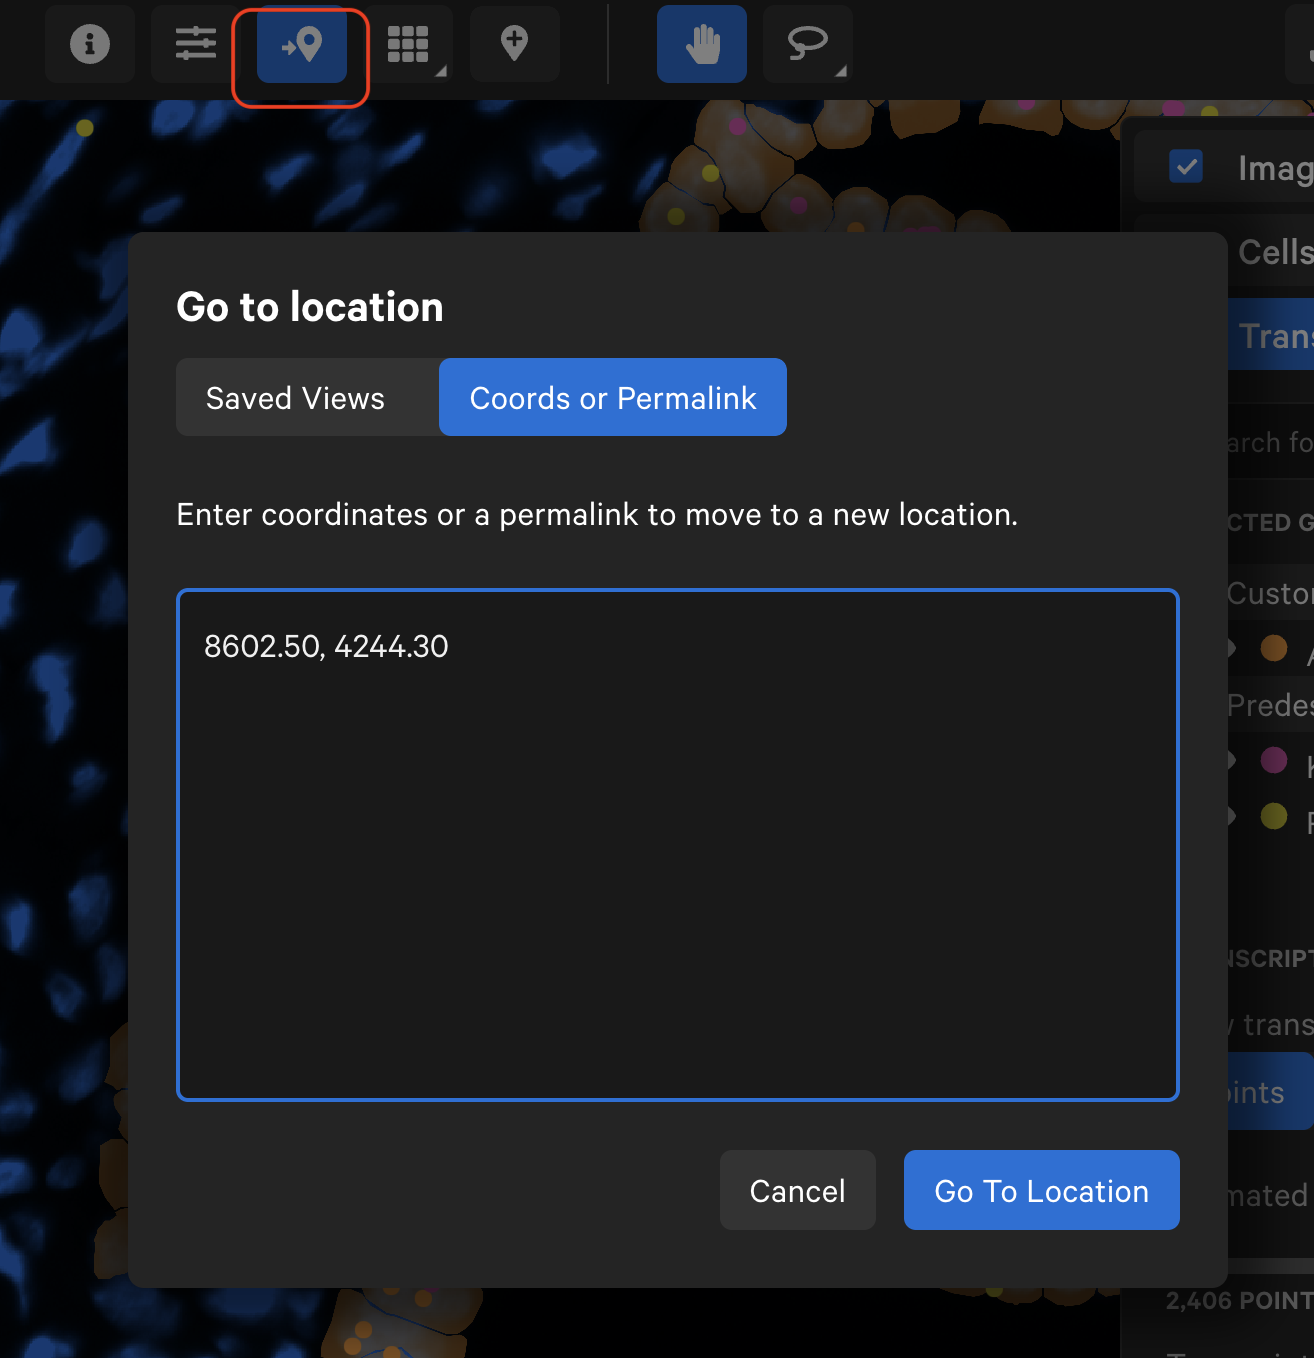
The Go to location button enables you to jump to a specific X-Y coordinate location in the image, open a saved view, or transfer a permalink view from another session. X-Y coordinate values are shown in the lower left-hand corner of the viewing area in µm. The X-Y format must be comma-separated (i.e., 8602.50, 4244.30). Lists of coordinates from selected Regions of Interest or cells should be pasted with the Lasso button’s Paste coordinates feature (see Annotation layer tutorial).
The experiment.spatial or experiment.xenium manifest files contain metadata read by 10x Explorer about the experiment, including the paths to the input files. The file names in the images and either explorer_files or xenium_explorer_files sections use the default output file names from Atera Onboard Analysis and Xenium Onboard Analysis, respectively.
In order to view and interact with custom analysis results in 10x Explorer, you can edit these sections of the manifest file. Because the manifest file is a text file in JSON format, changes can be made in any text editor. The file paths can be absolute or relative. However, relative paths should not use a tilde (~) for home directory path expansion.