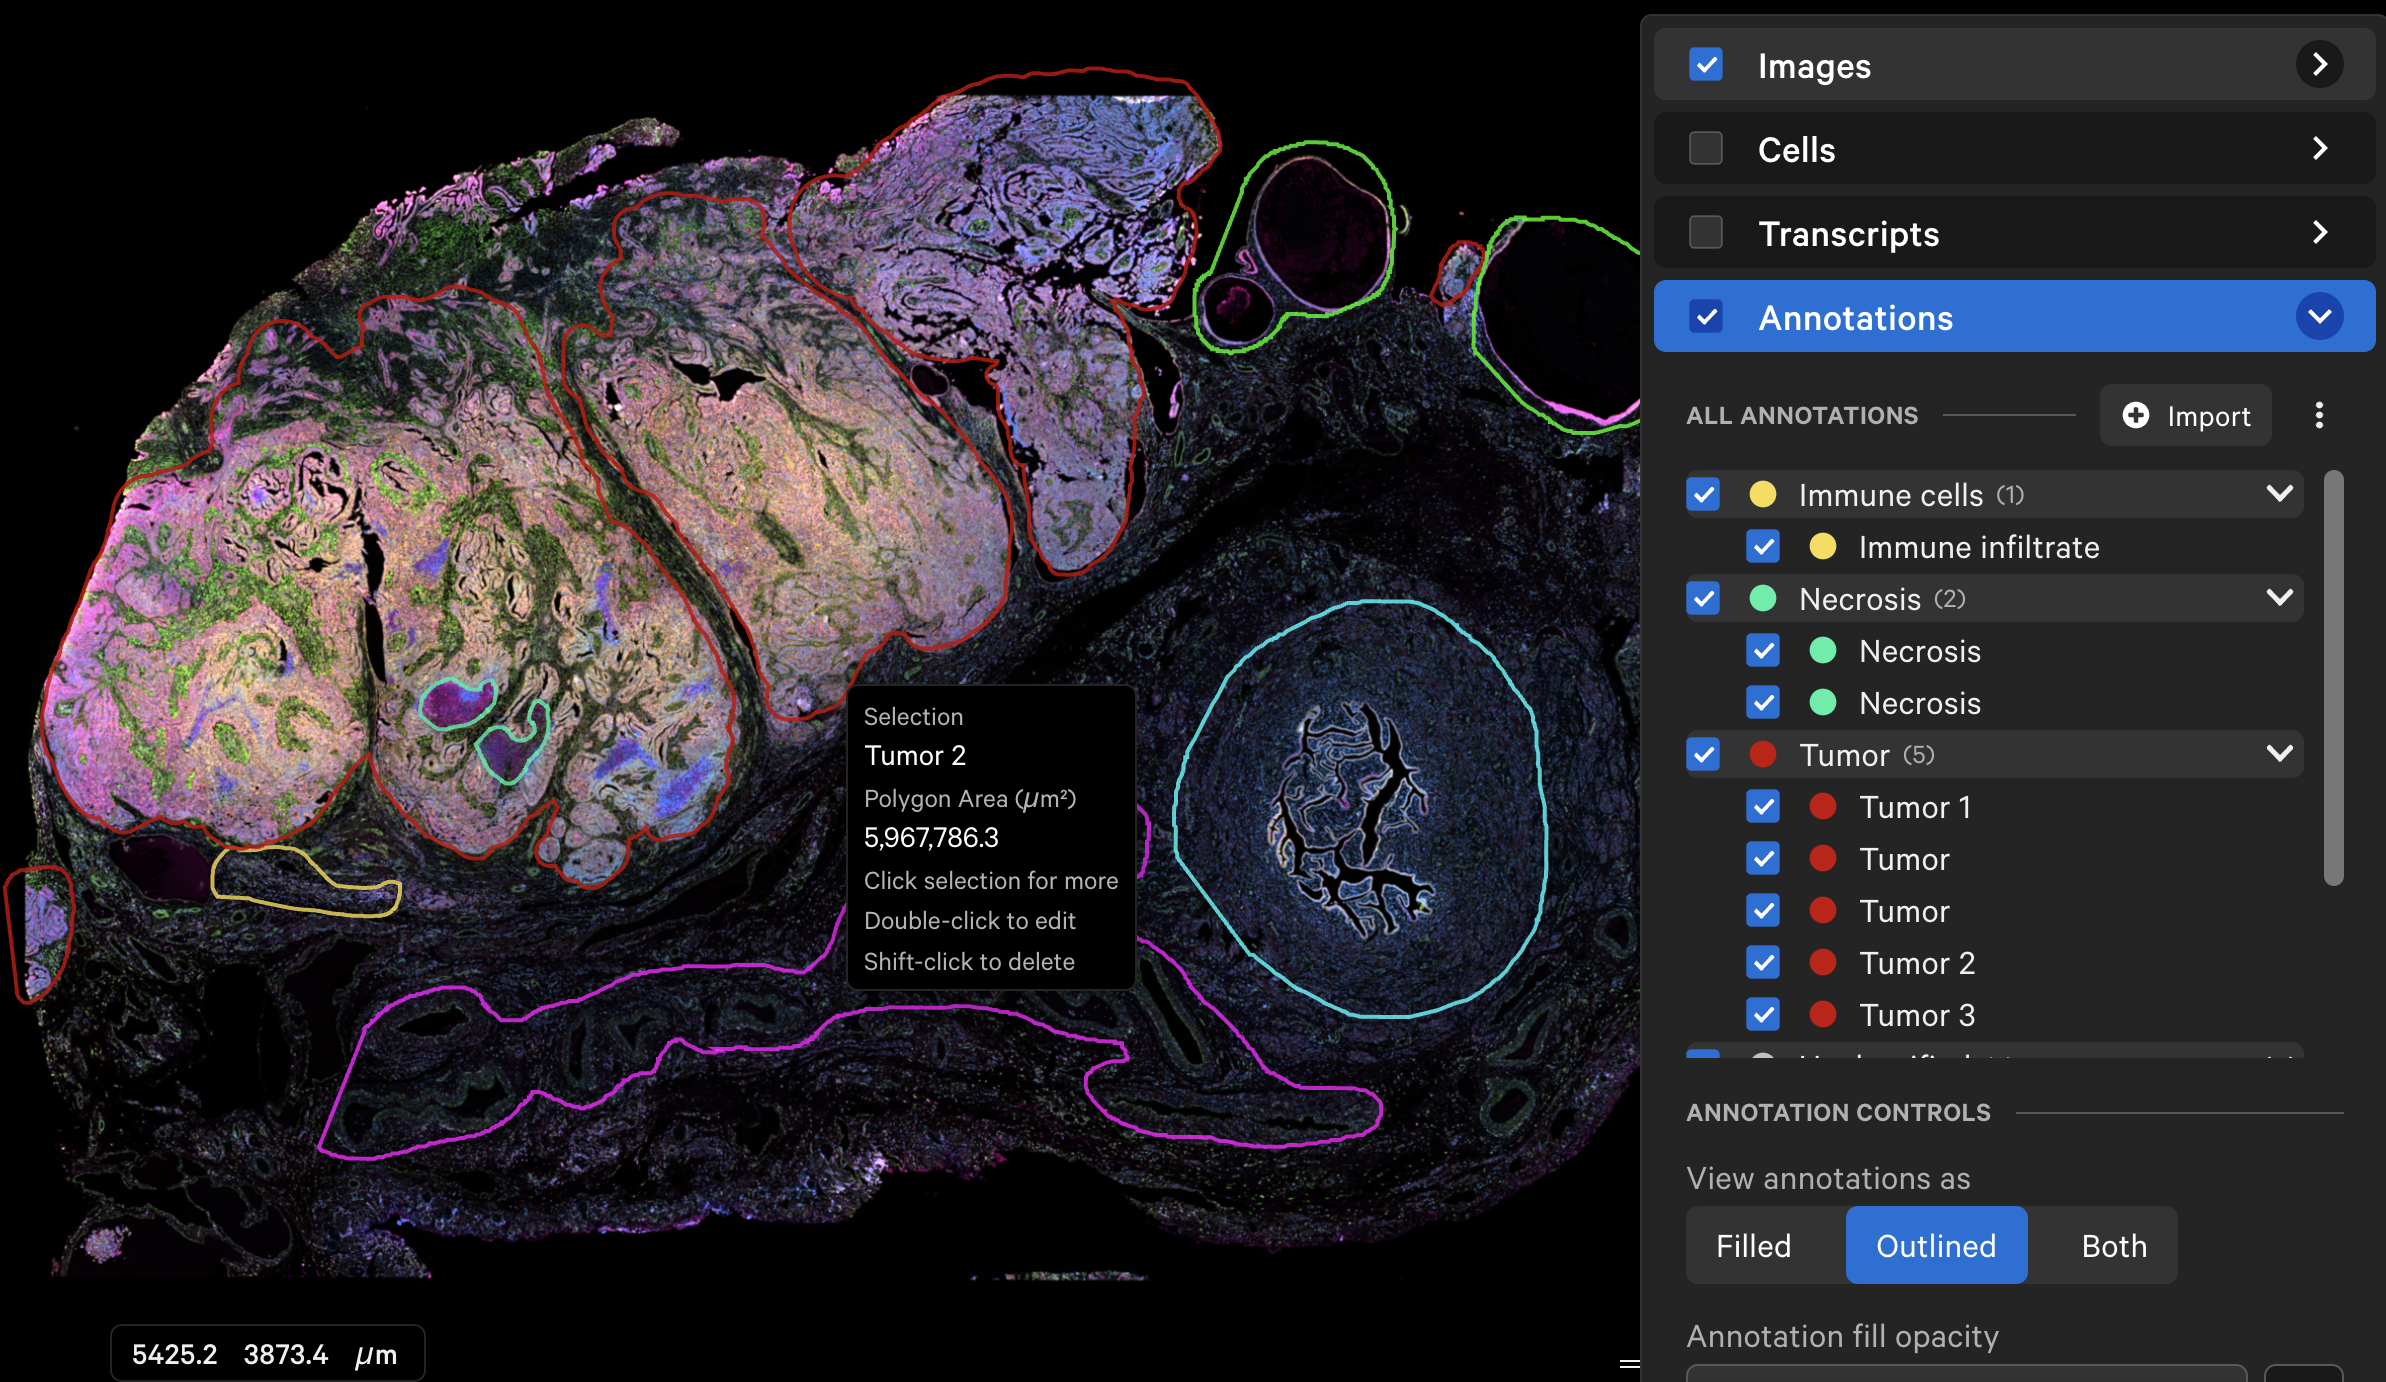
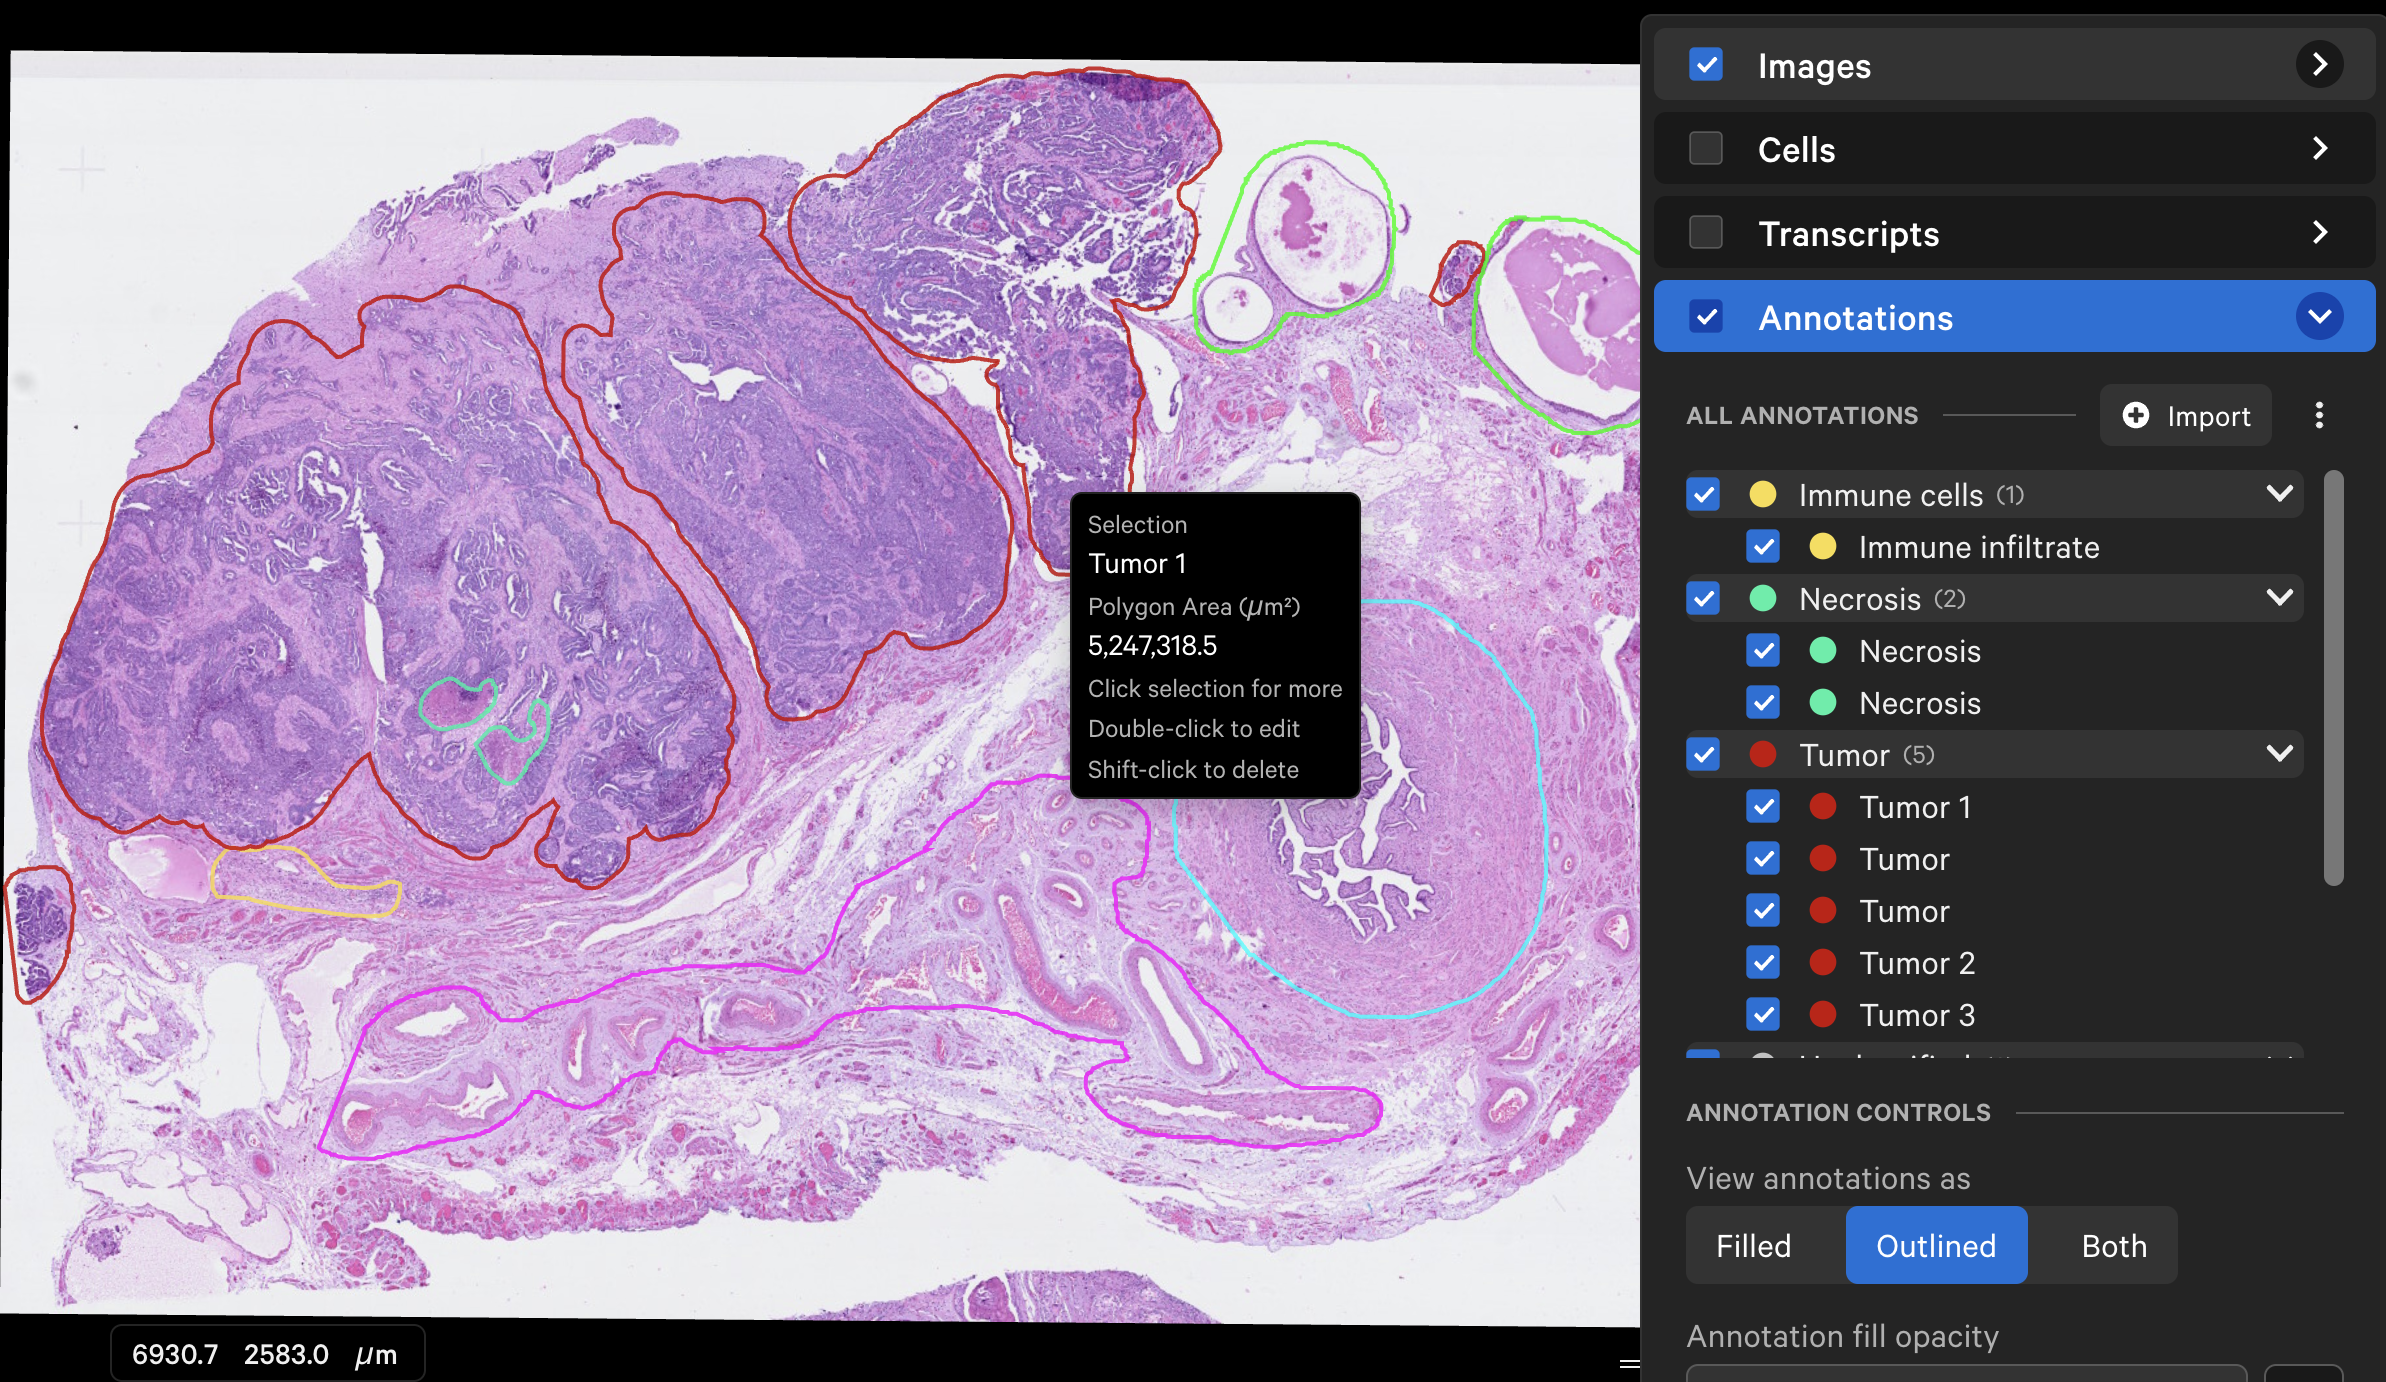
The Annotations layer enables integration of pathology annotations from post-instrument image data with either Atera gene expression or Xenium In Situ gene and protein expression data.
The Annotations layer lists annotated Regions of Interest (ROIs), selected cells, and imported annotations from third-party tools. Tools are provided to create and edit annotations, as well as export information about selected regions.
Here is an example of a human ovary dataset with pathology annotations displayed over either the Xenium In Situ morphology image or post-Xenium H&E image.
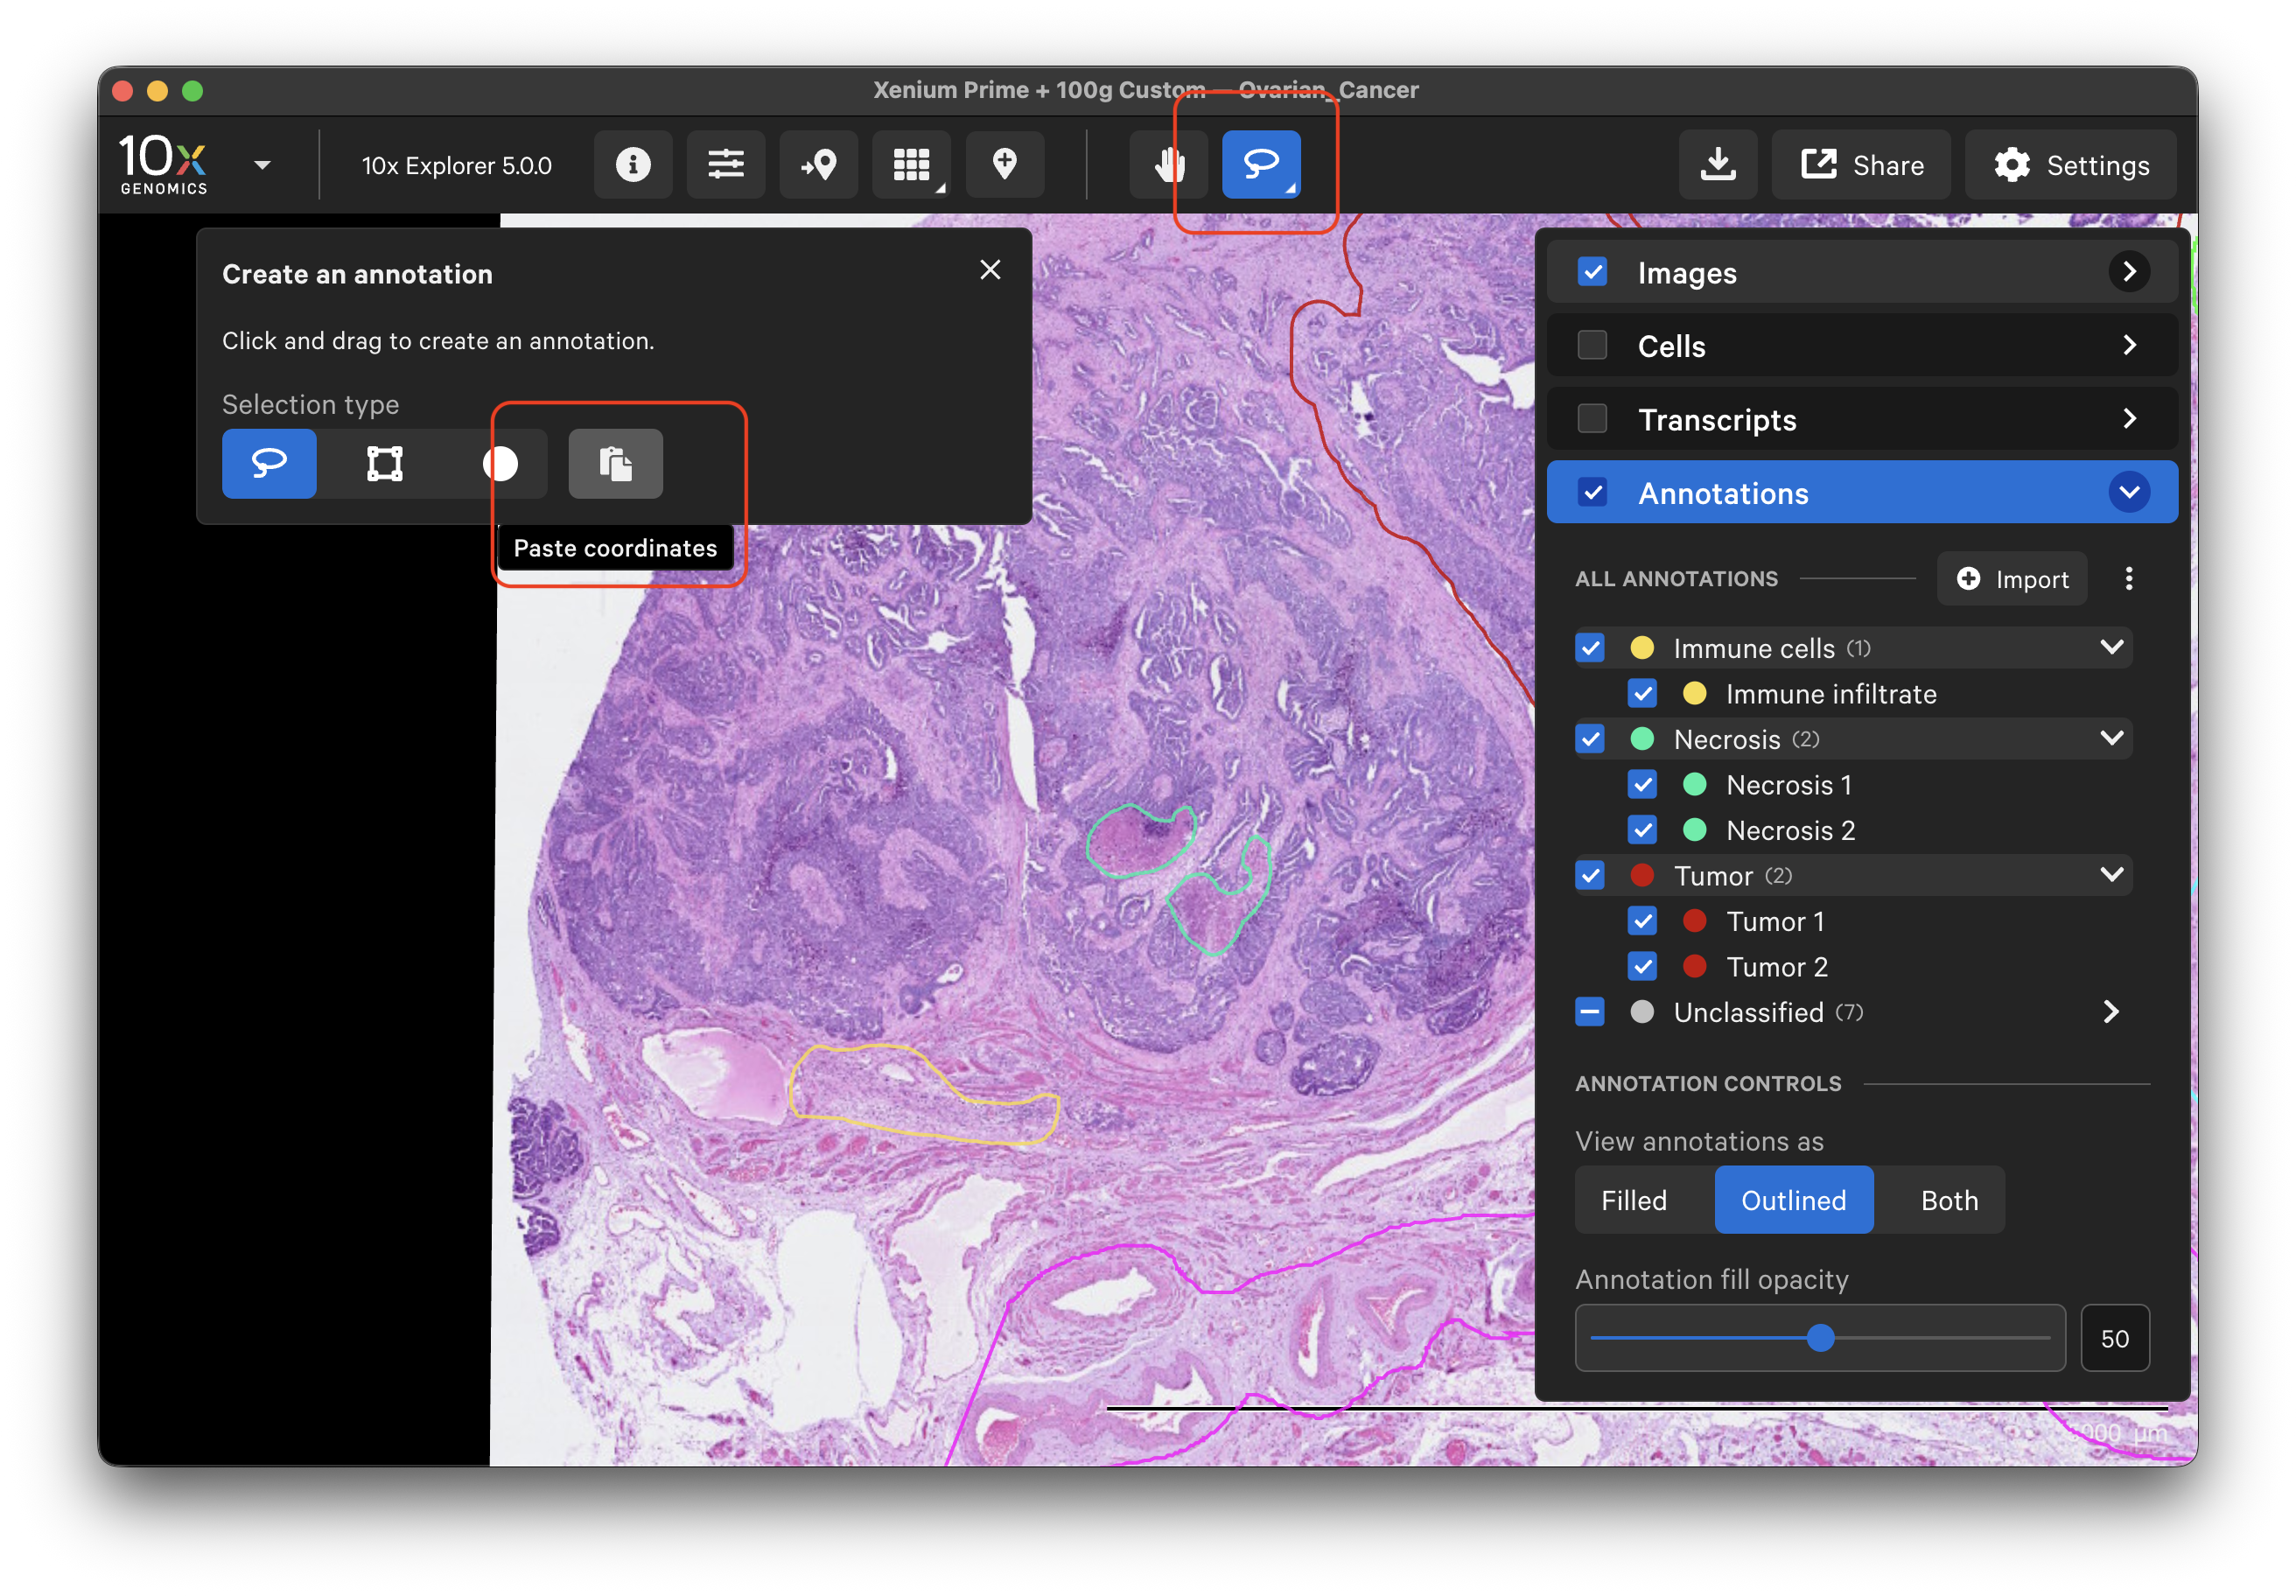
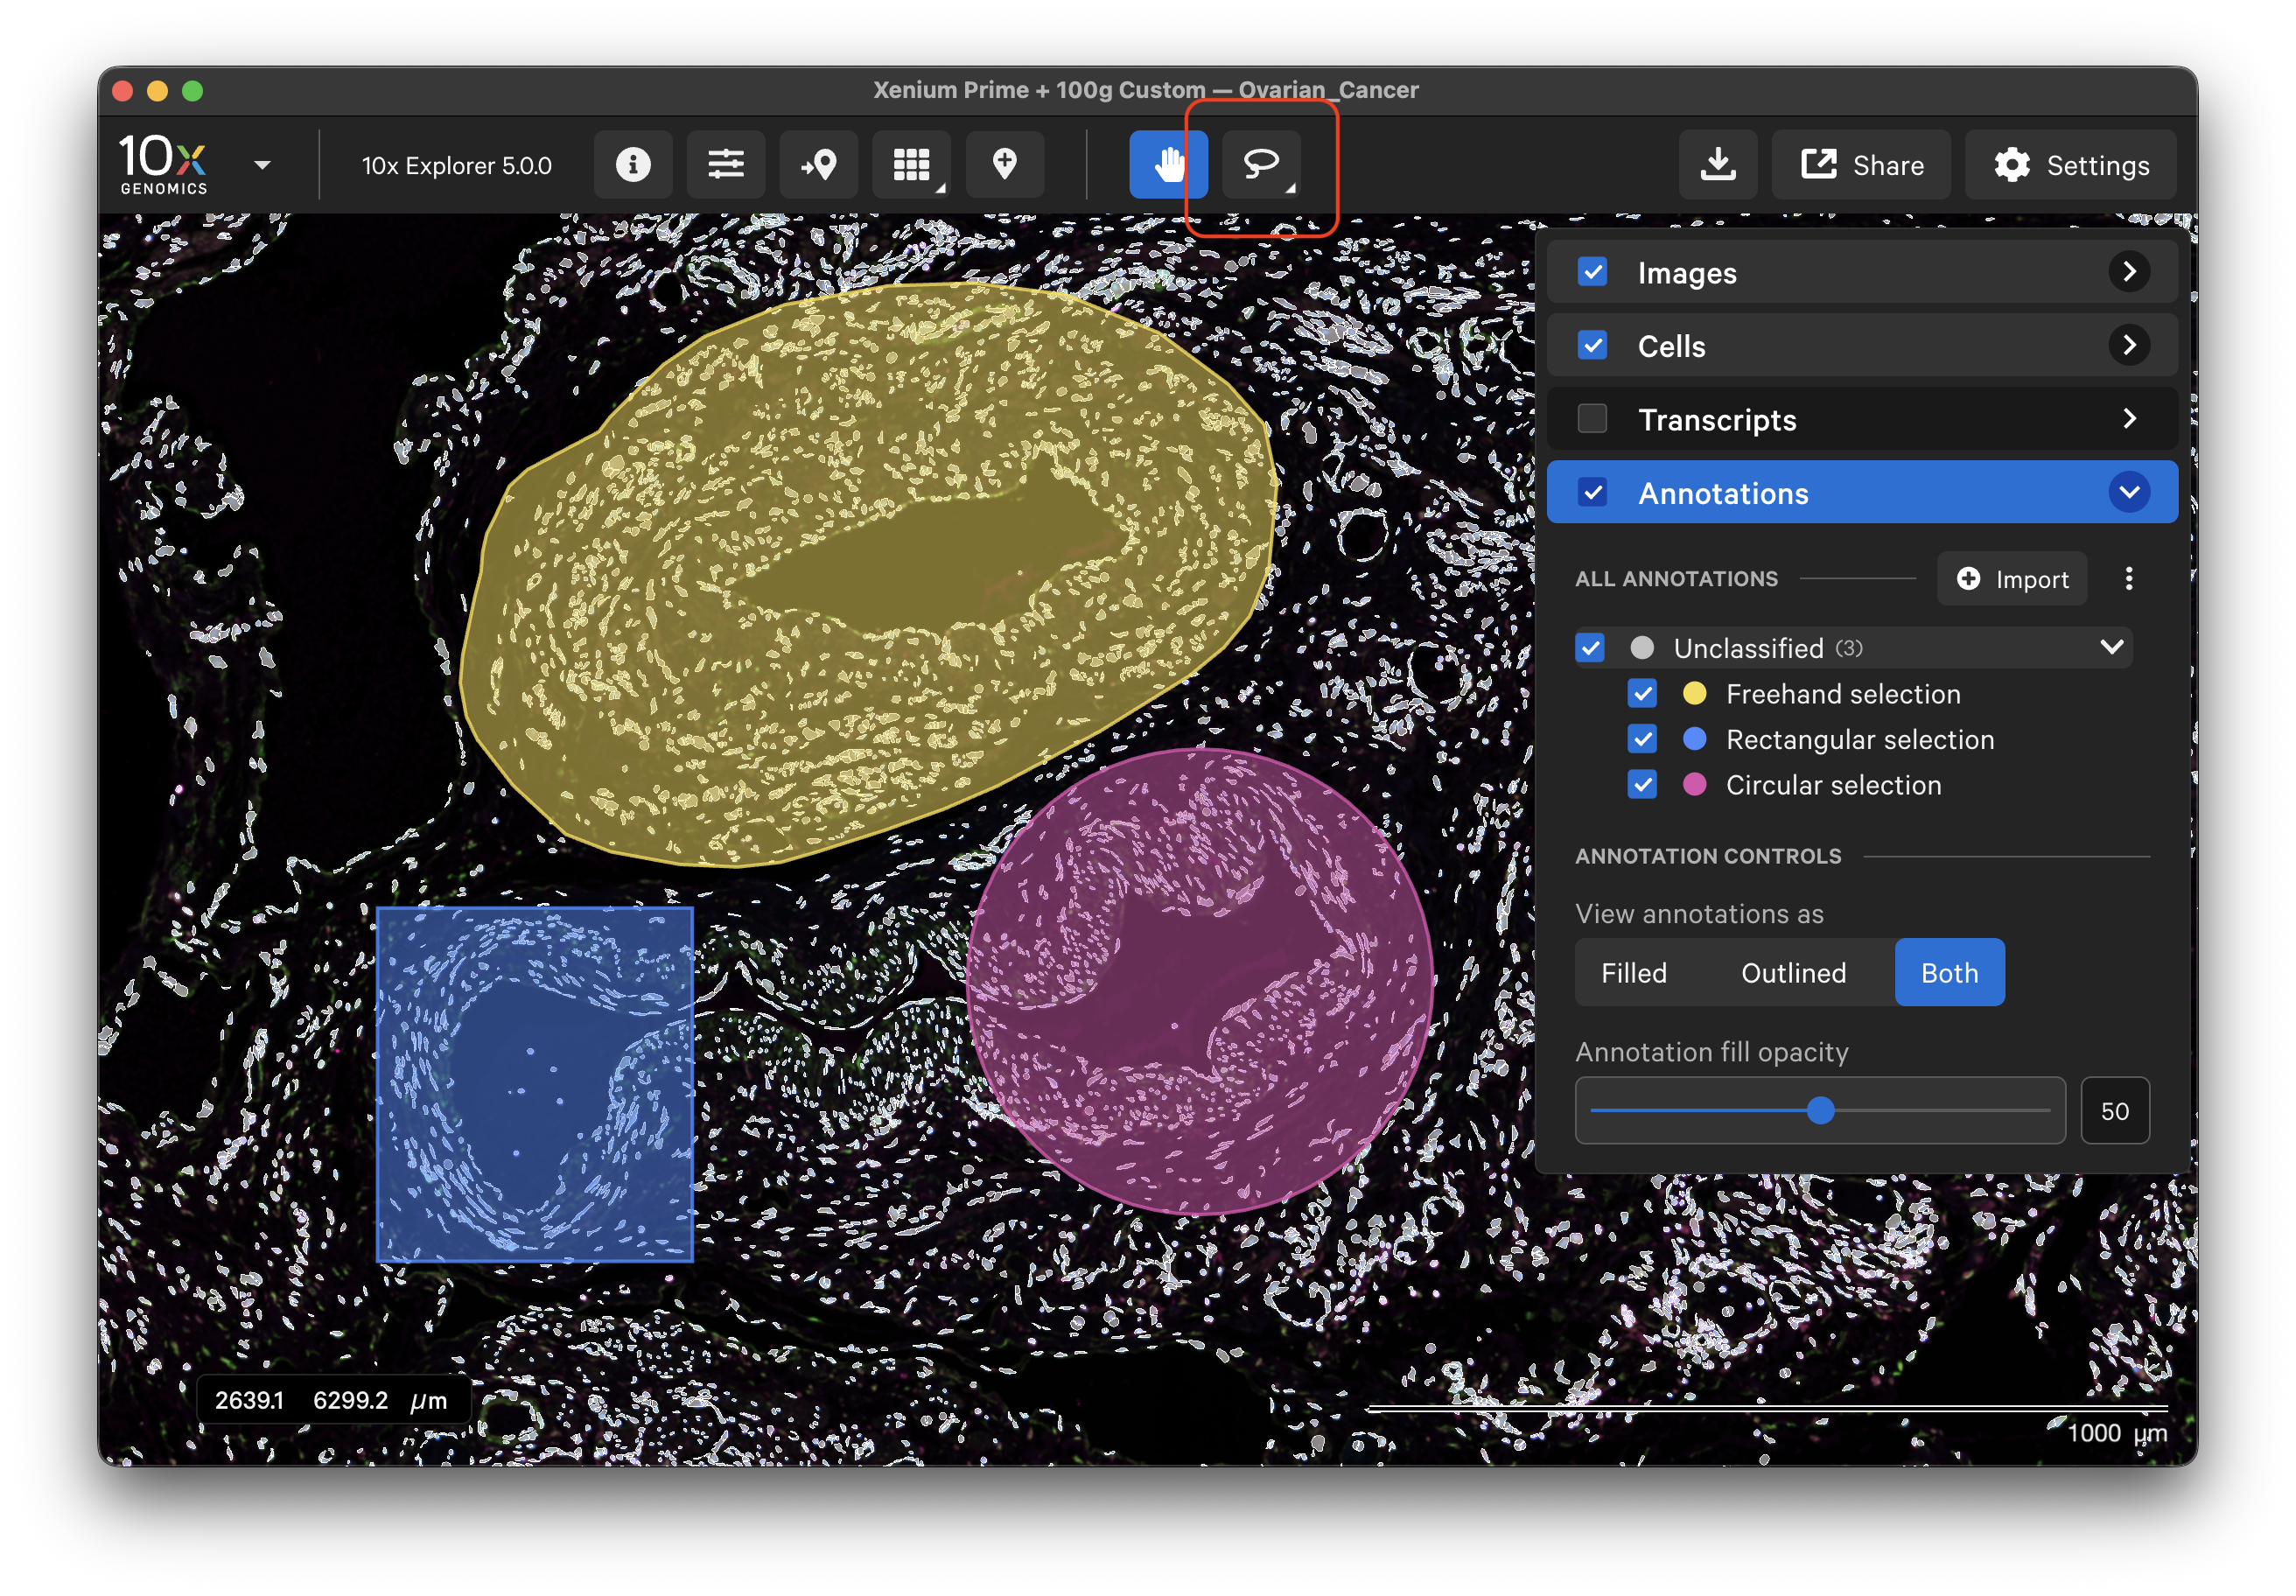
The lasso tool allows you to create multiple ROI annotations with the rectangle, circle, and freehand selection options. You can also make overlapping annotations. To draw a new annotation, click the lasso tool.
To select specific cells, make sure tooltips are turned on (Settings > Show Tooltips). View cells (outlined or filled) and click on the cell of interest. It can be added to the Annotations layer by clicking Add Cell to Annotations.
- If you click on a cell that is completely within an active ROI selection, the selection pop-up will show cell statistics for the cell within the selection instead of adding a new cell ID to the list of Annotations.
- To add the cell as its own cell annotation, uncheck the box next to the selection it overlaps with in the Annotations layer, and reselect the cell.
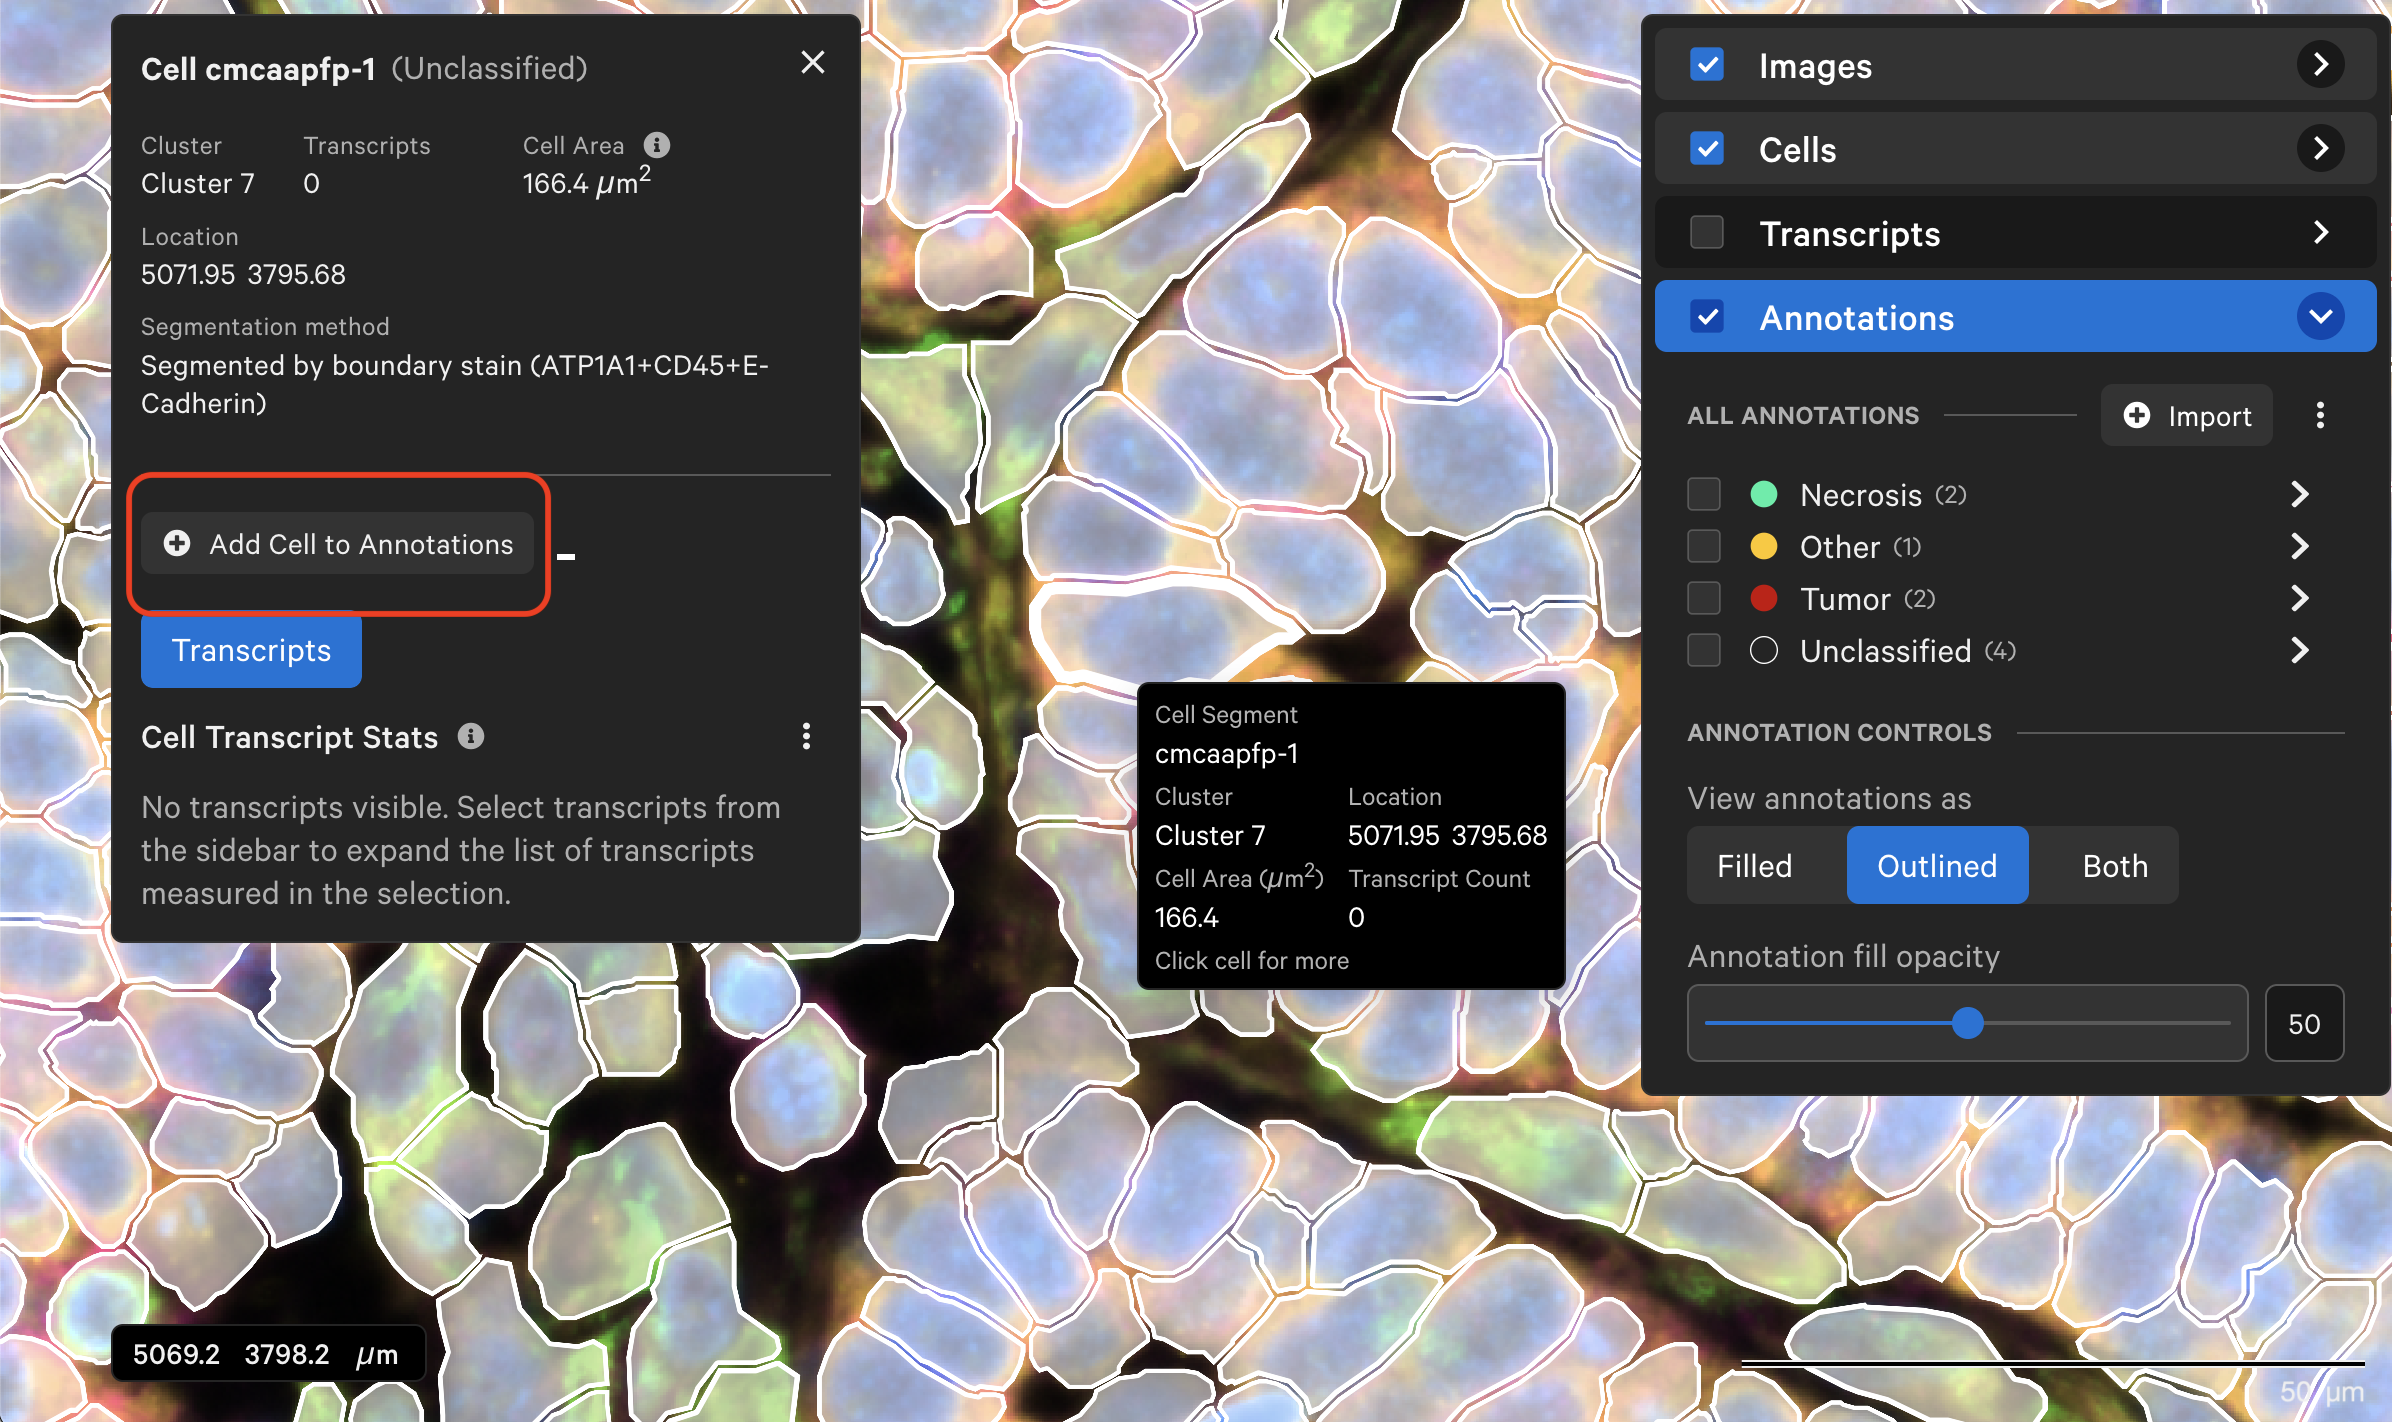
Annotated ROIs and cells are both listed in the Annotations layer. Click on any annotation to switch between them.
The following information is displayed for each annotated region (Cells and/or Transcripts layers must be checked to display this information):
| Tabs | Annotated ROI | Annotated cell |
|---|---|---|
| Info | Polygon area, total transcript count†, total cell count | Cluster assignment from clustering type selected in Cells layer, transcript count†, cell area, X-Y location, segmentation description |
| Transcripts | Count and density per transcript in the selection for genes checked in the Transcripts layer | Count and density per transcript in the cell for genes checked in the Transcripts layer |
| Cells | For cells completely contained in the selection: "By Cell ID" lists cell ID‡ (with links to cell-specific statistics), cell area per cell, cluster assignment, and transcript count; "By Cluster" lists cell count and area | (Not applicable) |
| Protein | For Xenium Protein data, protein name and mean intensity per selection. The Cells tab provides a Protein Summary link to the protein stats per cell within the selected region. | Protein name and mean intensity per cell |
† Transcript counts in selected ROIs are derived from transcript assignments by cell segmentation polygon boundaries, which are used in 10x Explorer as approximations for visualization performance. Transcript counts in selected cells are derived from transcript assignments by cell segmentation masks in the cell-feature matrix.
‡ The cell IDs format was updated in output files generated by Xenium Onboard Analysis v1.3 and later. 10x Explorer will display pre-v1.3 Xenium Onboard Analysis data with the original integer format.
There are two supported file formats for importing annotated region coordinates:
| Use case | Import GeoJSON option | Import CSV option |
|---|---|---|
| Import annotations from third-party tool (e.g., QuPath) | Use Import button. | Not supported |
| Import annotations previously created in 10x Explorer (e.g., in bulk or per annotation) | Use Import button. | Use Import All from CSV option to import annotation coordinates. |
For example, you can export annotation polygons in GeoJSON format from QuPath and view them in 10x Explorer. Refer to the QuPath export annotations documentation. After drawing annotations in QuPath, click File > Export objects as GeoJSON:
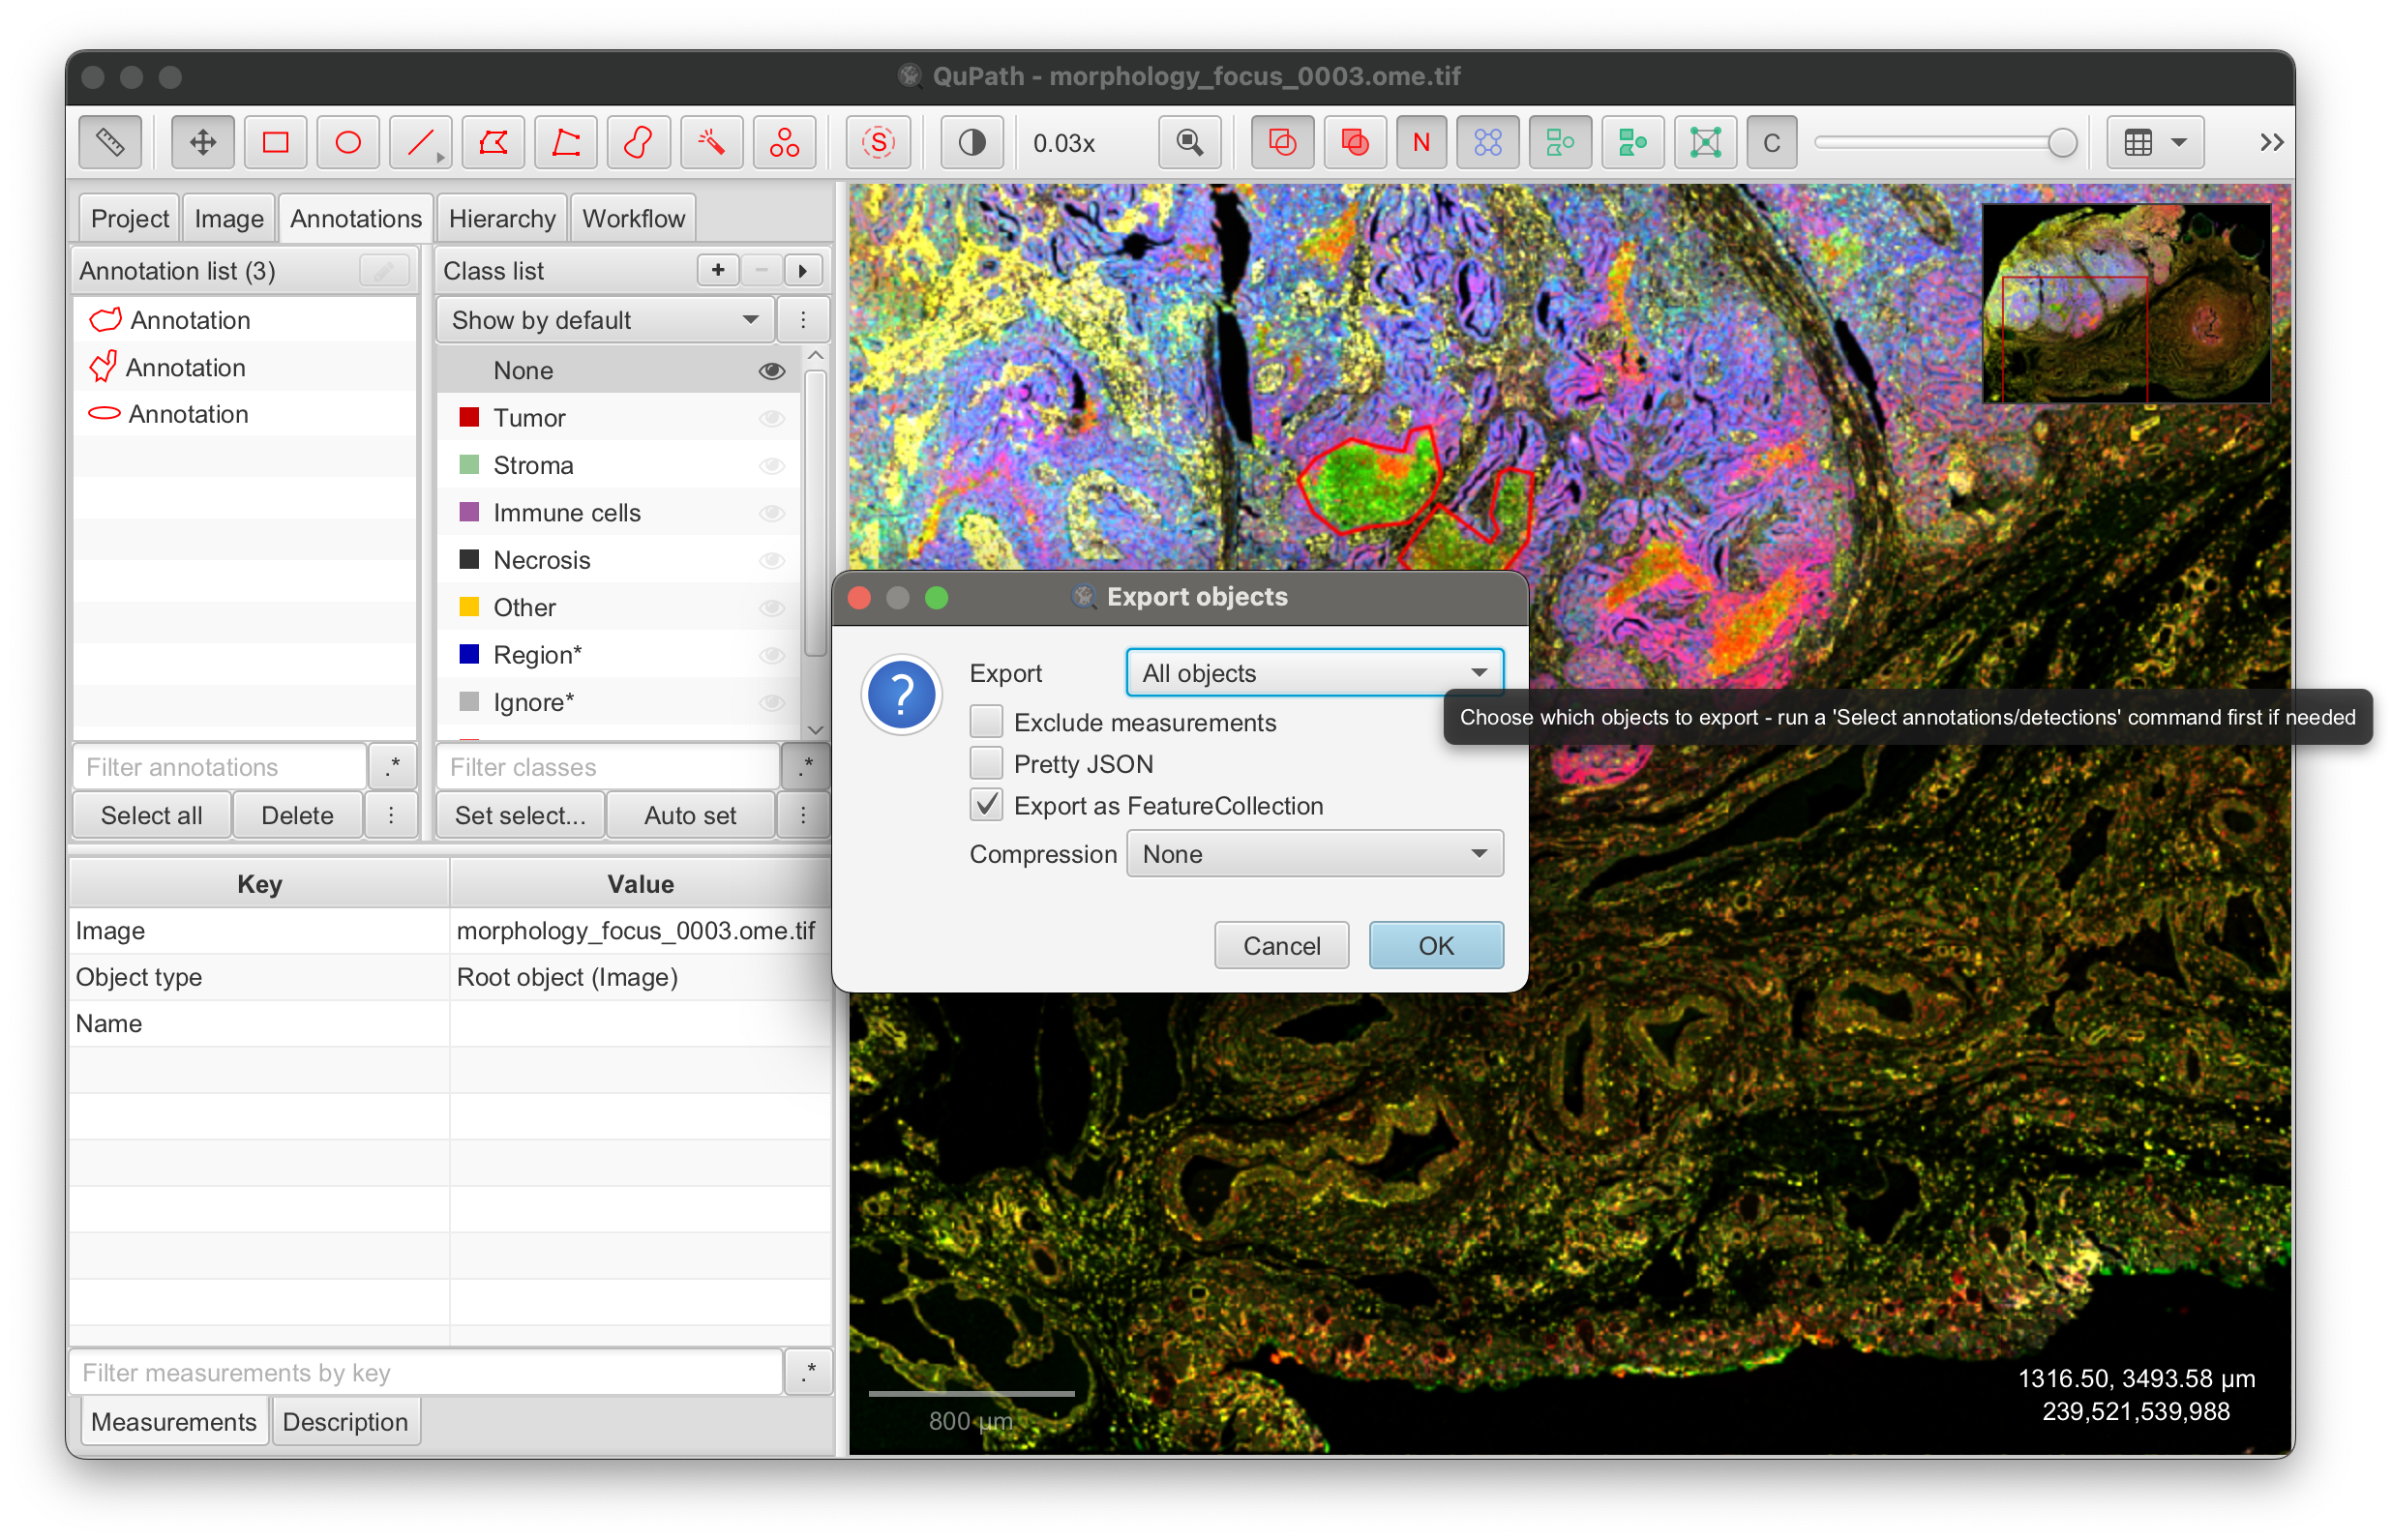
The polygon GeoJSON file should be exported as a FeatureCollection, with geometry "type": "Polygon" and "objectType": "annotation". The name of the classification field will be used for display in the Annotations layer of 10x Explorer. The format should look similar to this example, shown below in QuPath's output format (the coordinates are truncated for this example):
{
"type": "FeatureCollection",
"features": [
{
"type": "Feature",
"id": "13a496e3-0f3e-4d6c-9898-45048b0374db",
"geometry": {
"type": "Polygon",
"coordinates": [
[
[32798, 50889],
[32798, 50932],
[32798, 50974],
...
[32841, 50591],
[32841, 50633],
[32841, 50804],
[32841, 50846],
[32798, 50889]
]
]
},
"properties": {
"objectType": "annotation",
"classification": {
"name": "Tumor",
"color": [204, 204, 51]
}
}
},
...
]
}
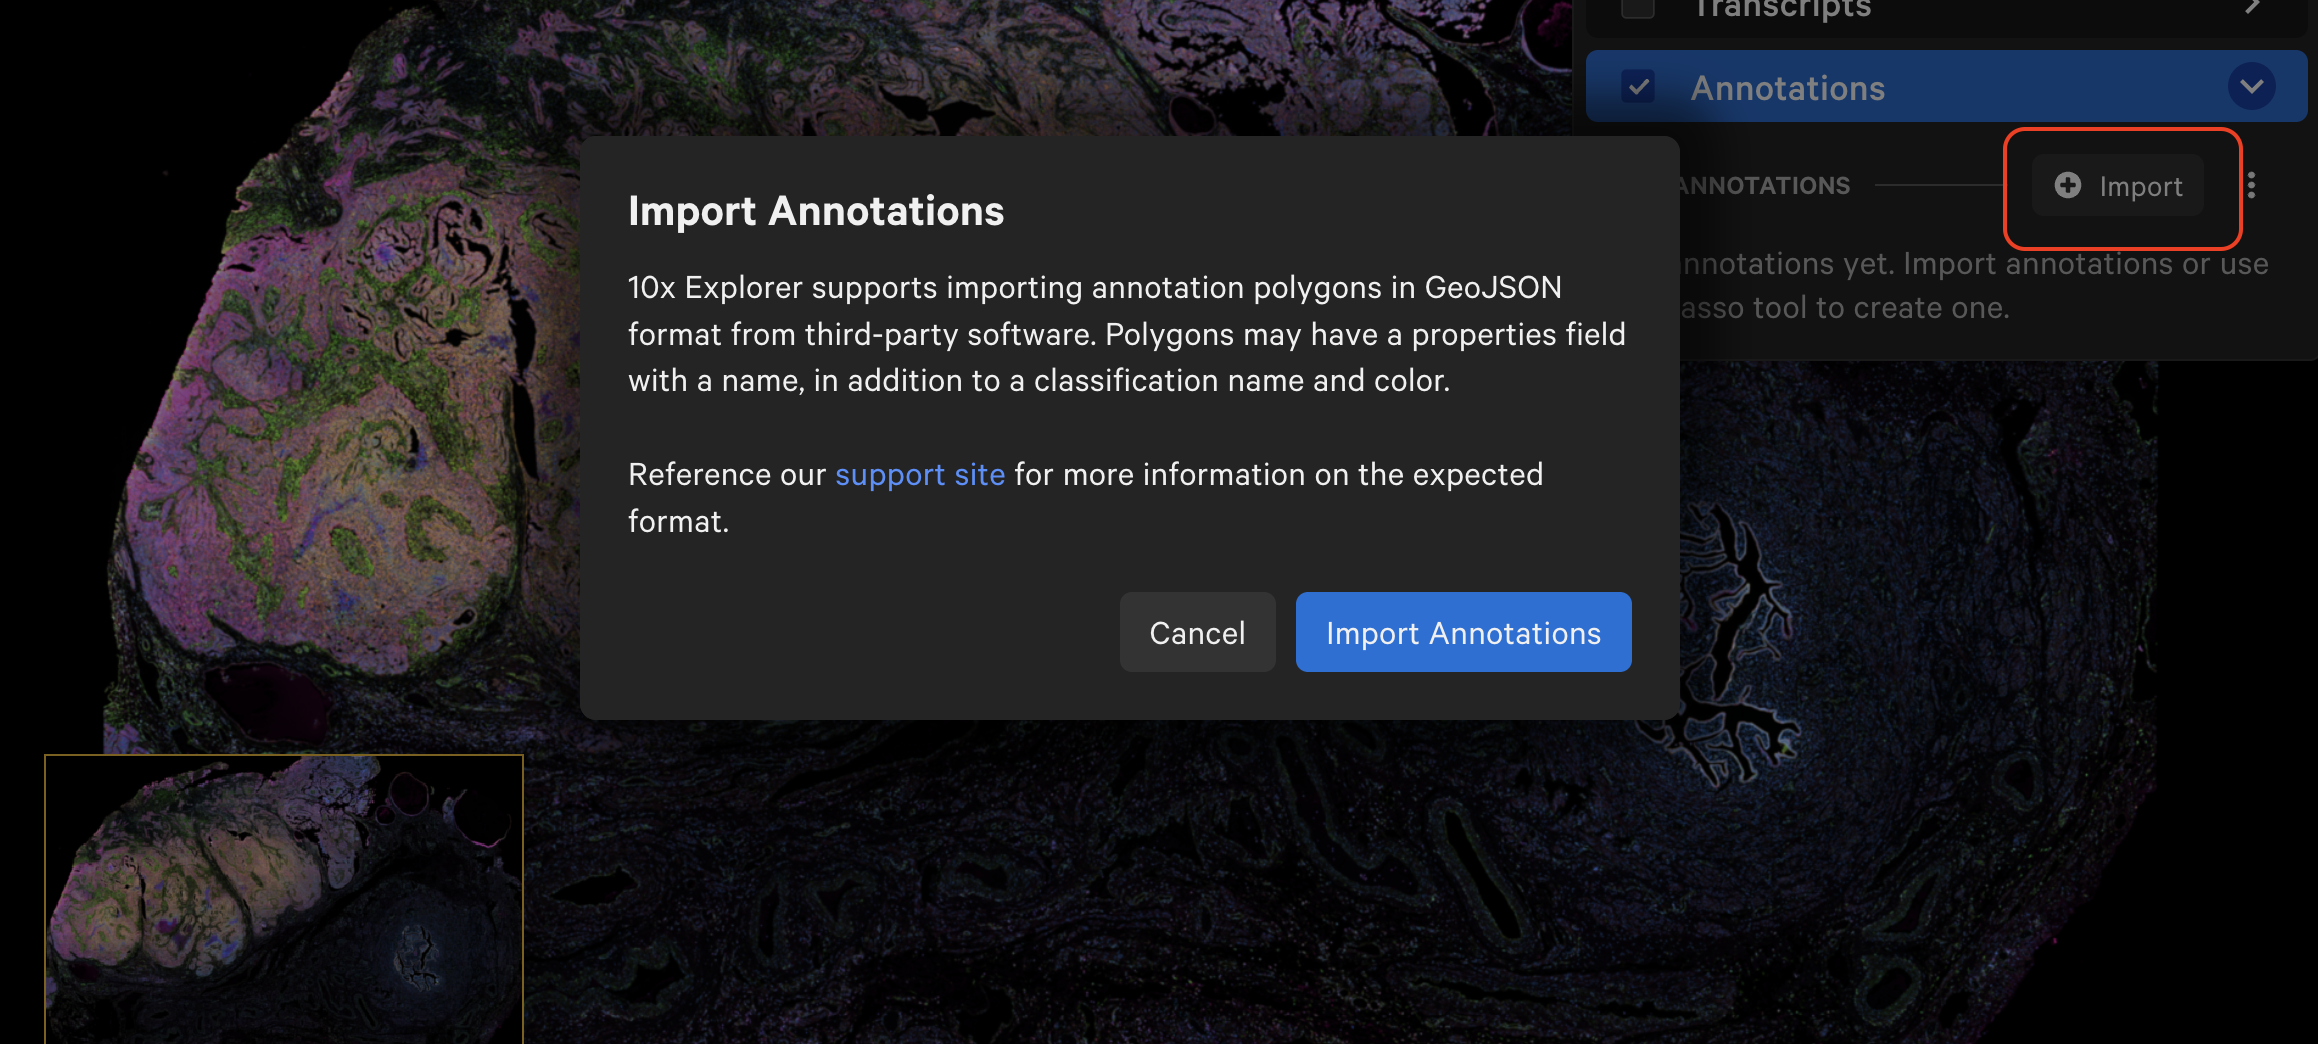
Click Import to import a GeoJSON file with annotation coordinates.
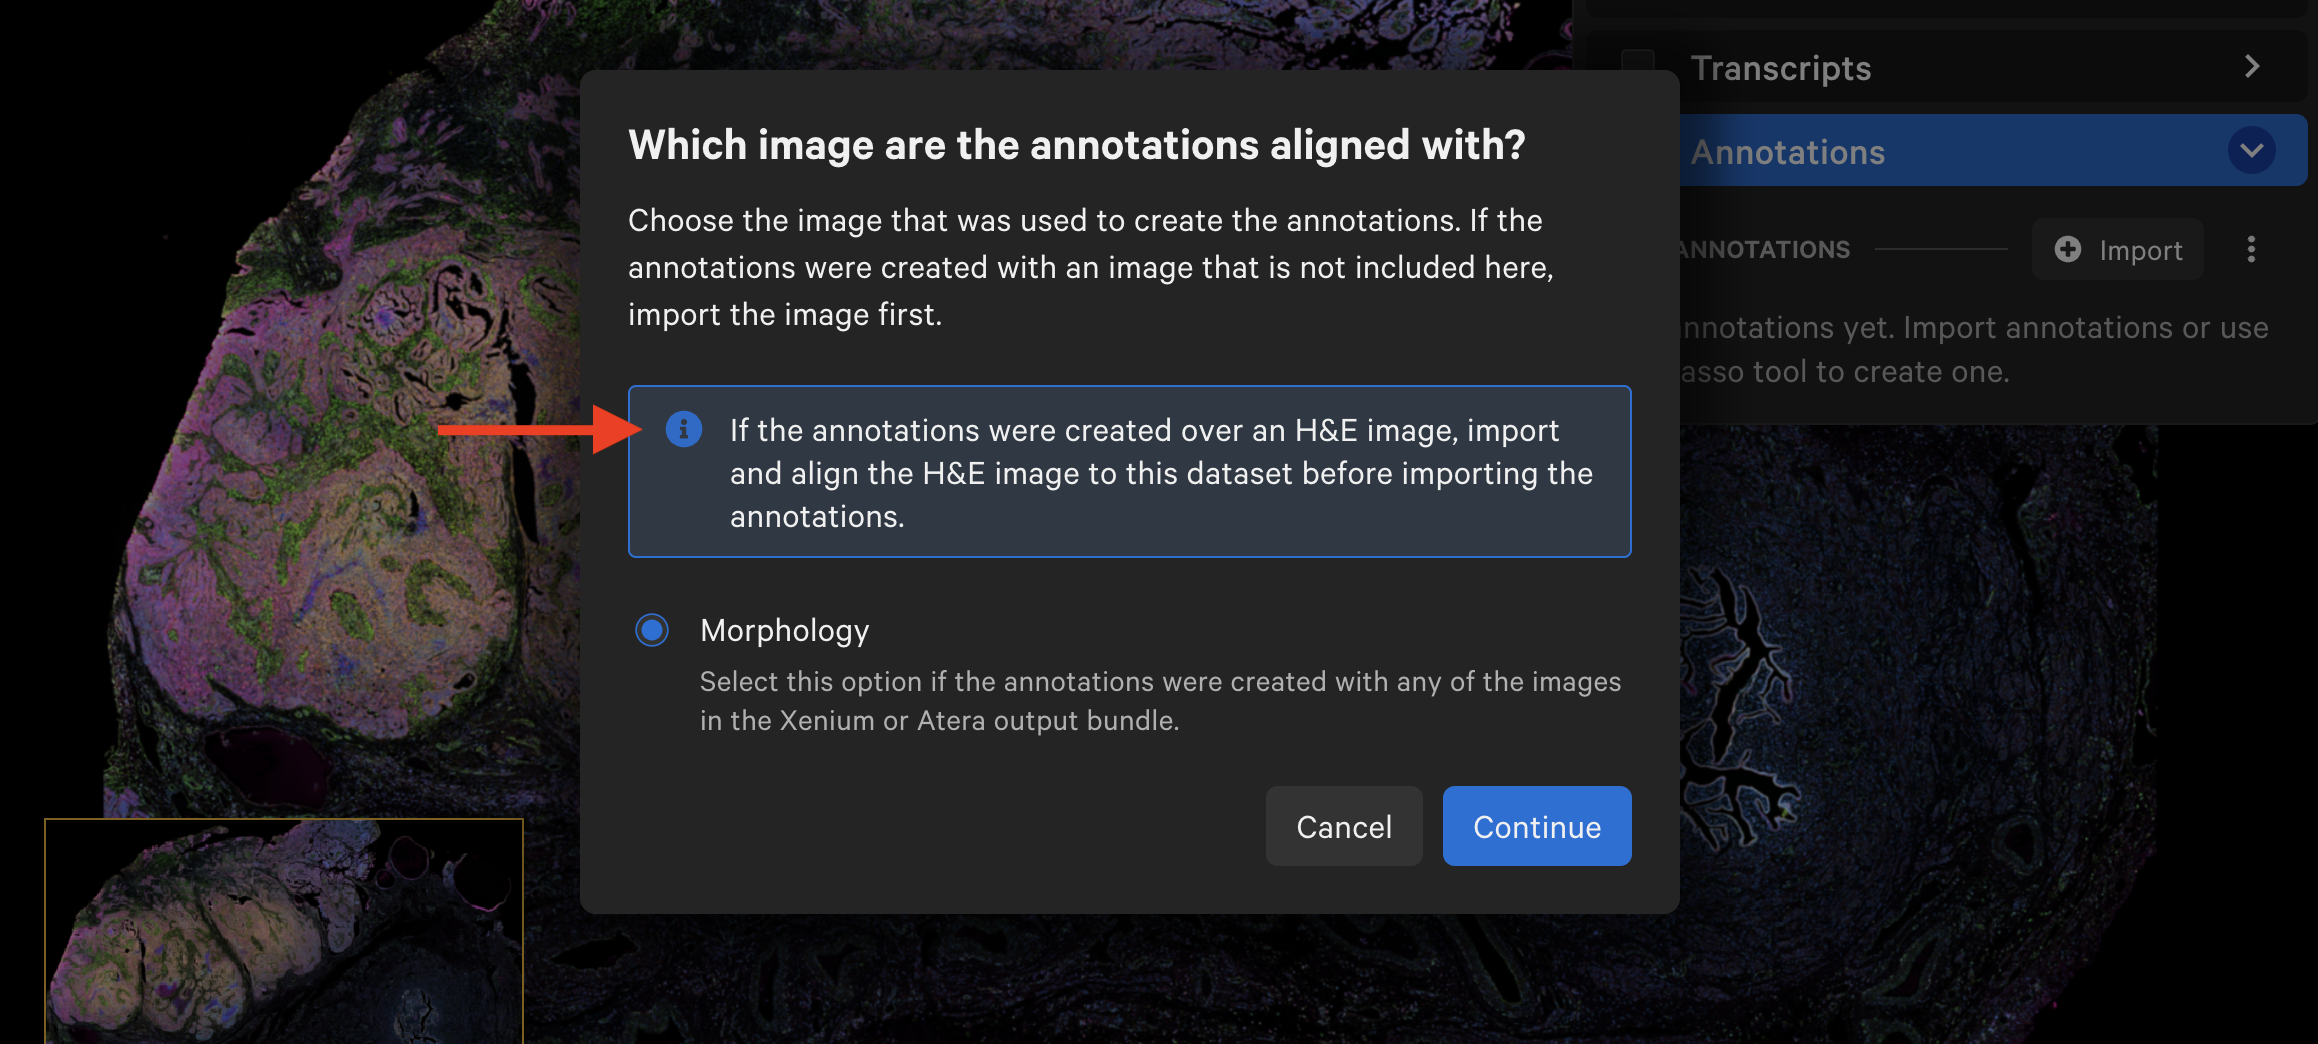
To correctly align the annotations, verify whether they were created in reference to the morphology image or a post-instrument image.
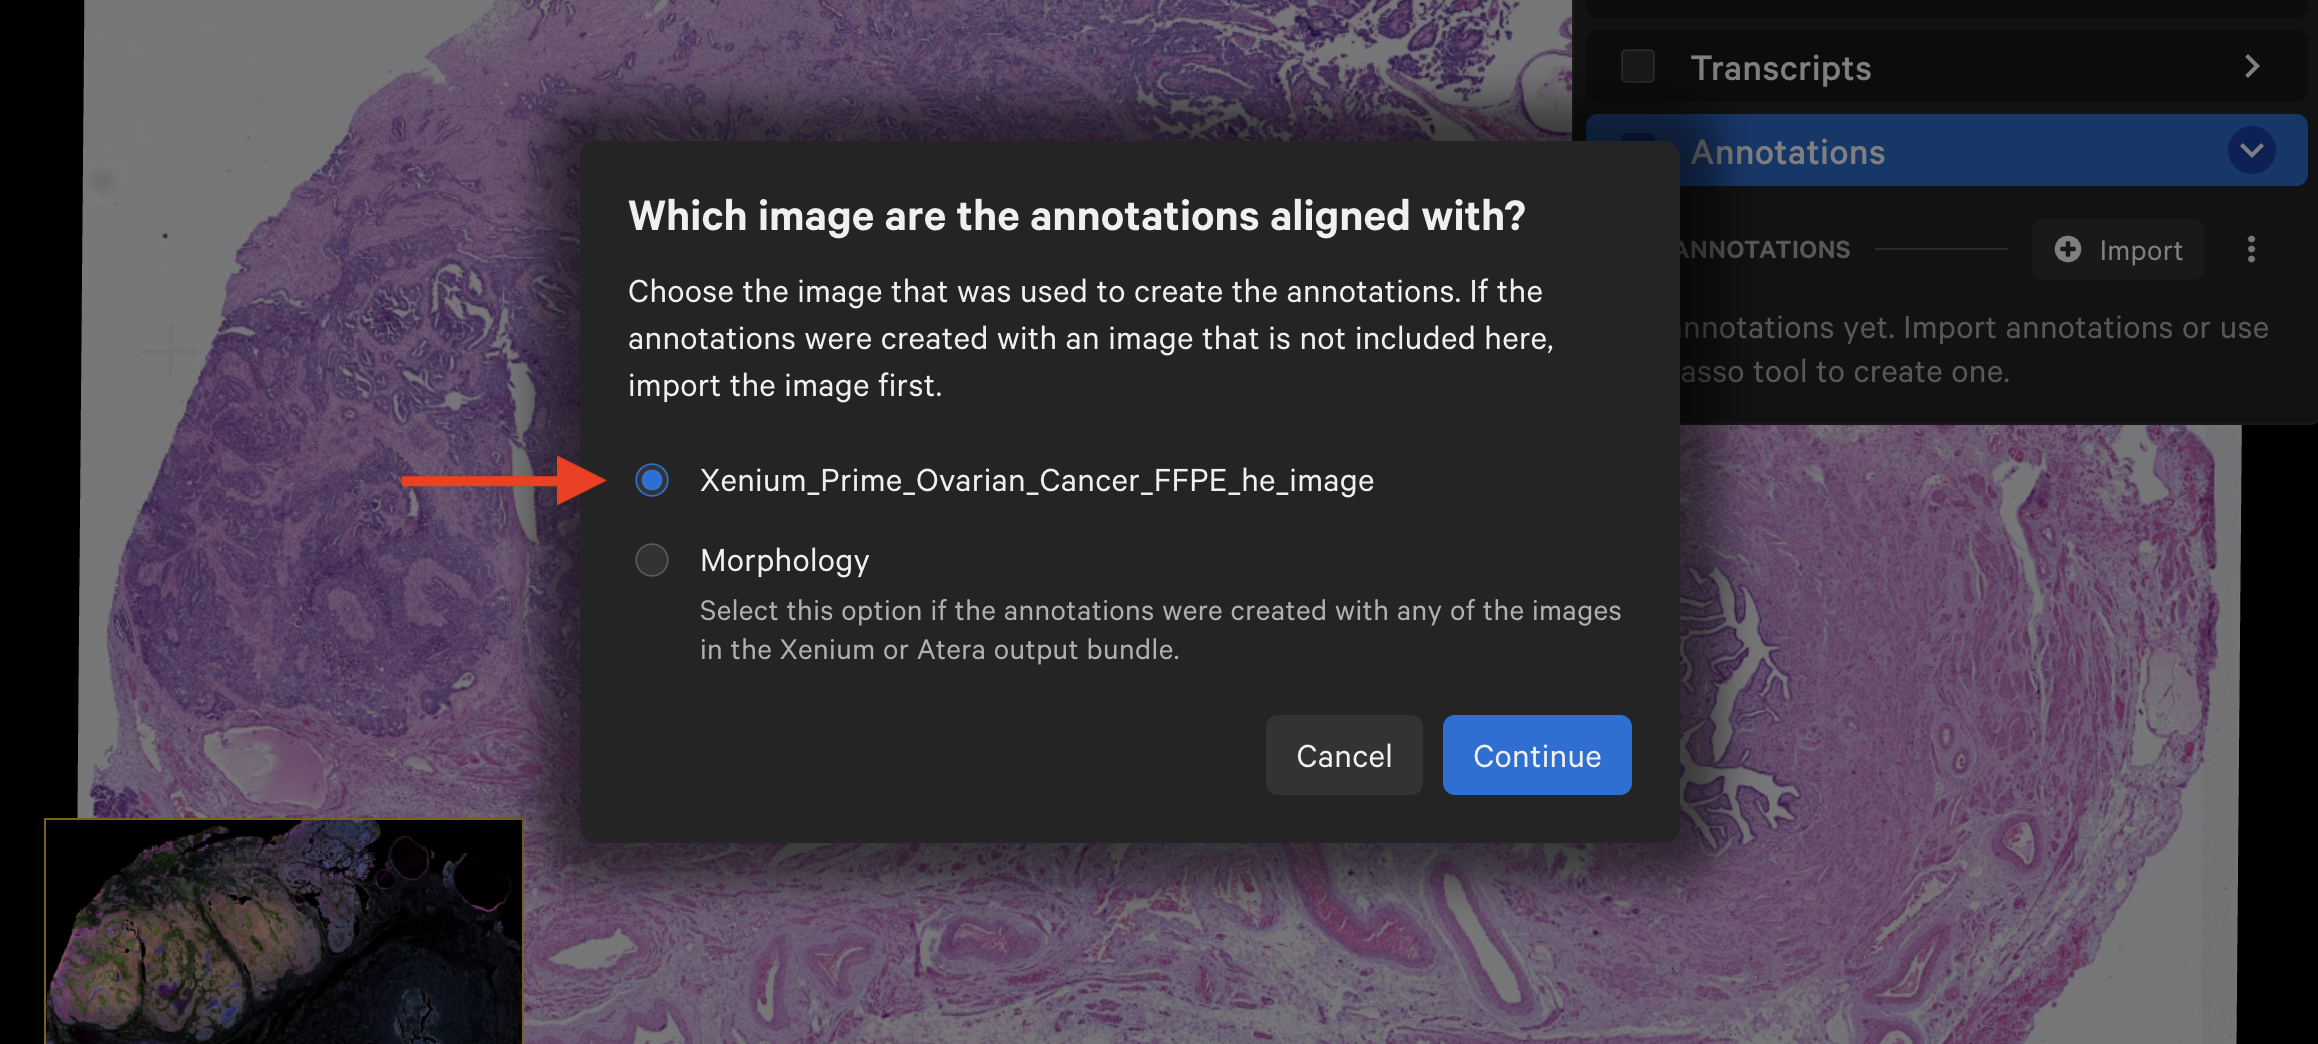
Files with malformed or empty GeoJSON files may result in partial or failed imports. If included in the GeoJSON file, 10x Explorer will show a warning that n annotations failed to import. 10x Explorer will skip these and load all correctly formatted polygons.

Troubleshooting format issues
| Format requirement | Possible error message(s) |
|---|---|
| Each polygon must be closed (first and last point are the same) with at least four vertices. | A polygon must have at least 4 coordinates., A polygon's first point ${first} and last point ${last} must match. |
| Each polygon must have fewer than 100,000 vertices. | The maximum vertex count of 100,000 was reached. |
GeoJSON geometry type must be Polygon. The following are not supported: LineString, MultiPolygon, Point, polygons with holes (e.g., donut-shaped) or self-intersections (e.g., butterfly-shaped) | The file did not contain any readable data., Importing MultiPolygon is not supported. |
| Total number of imported polygons must be less than 10,000. | The maximum recommended polygon count 10000 has been reached. You may run into performance issues. |
| File format issues (malformed, unreadable, or no file selected) | Failed to upload GeoJson file, file couldn't be read or no file was selected., Parsing error ... |
Select Import All from CSV to import a CSV file with the coordinates.
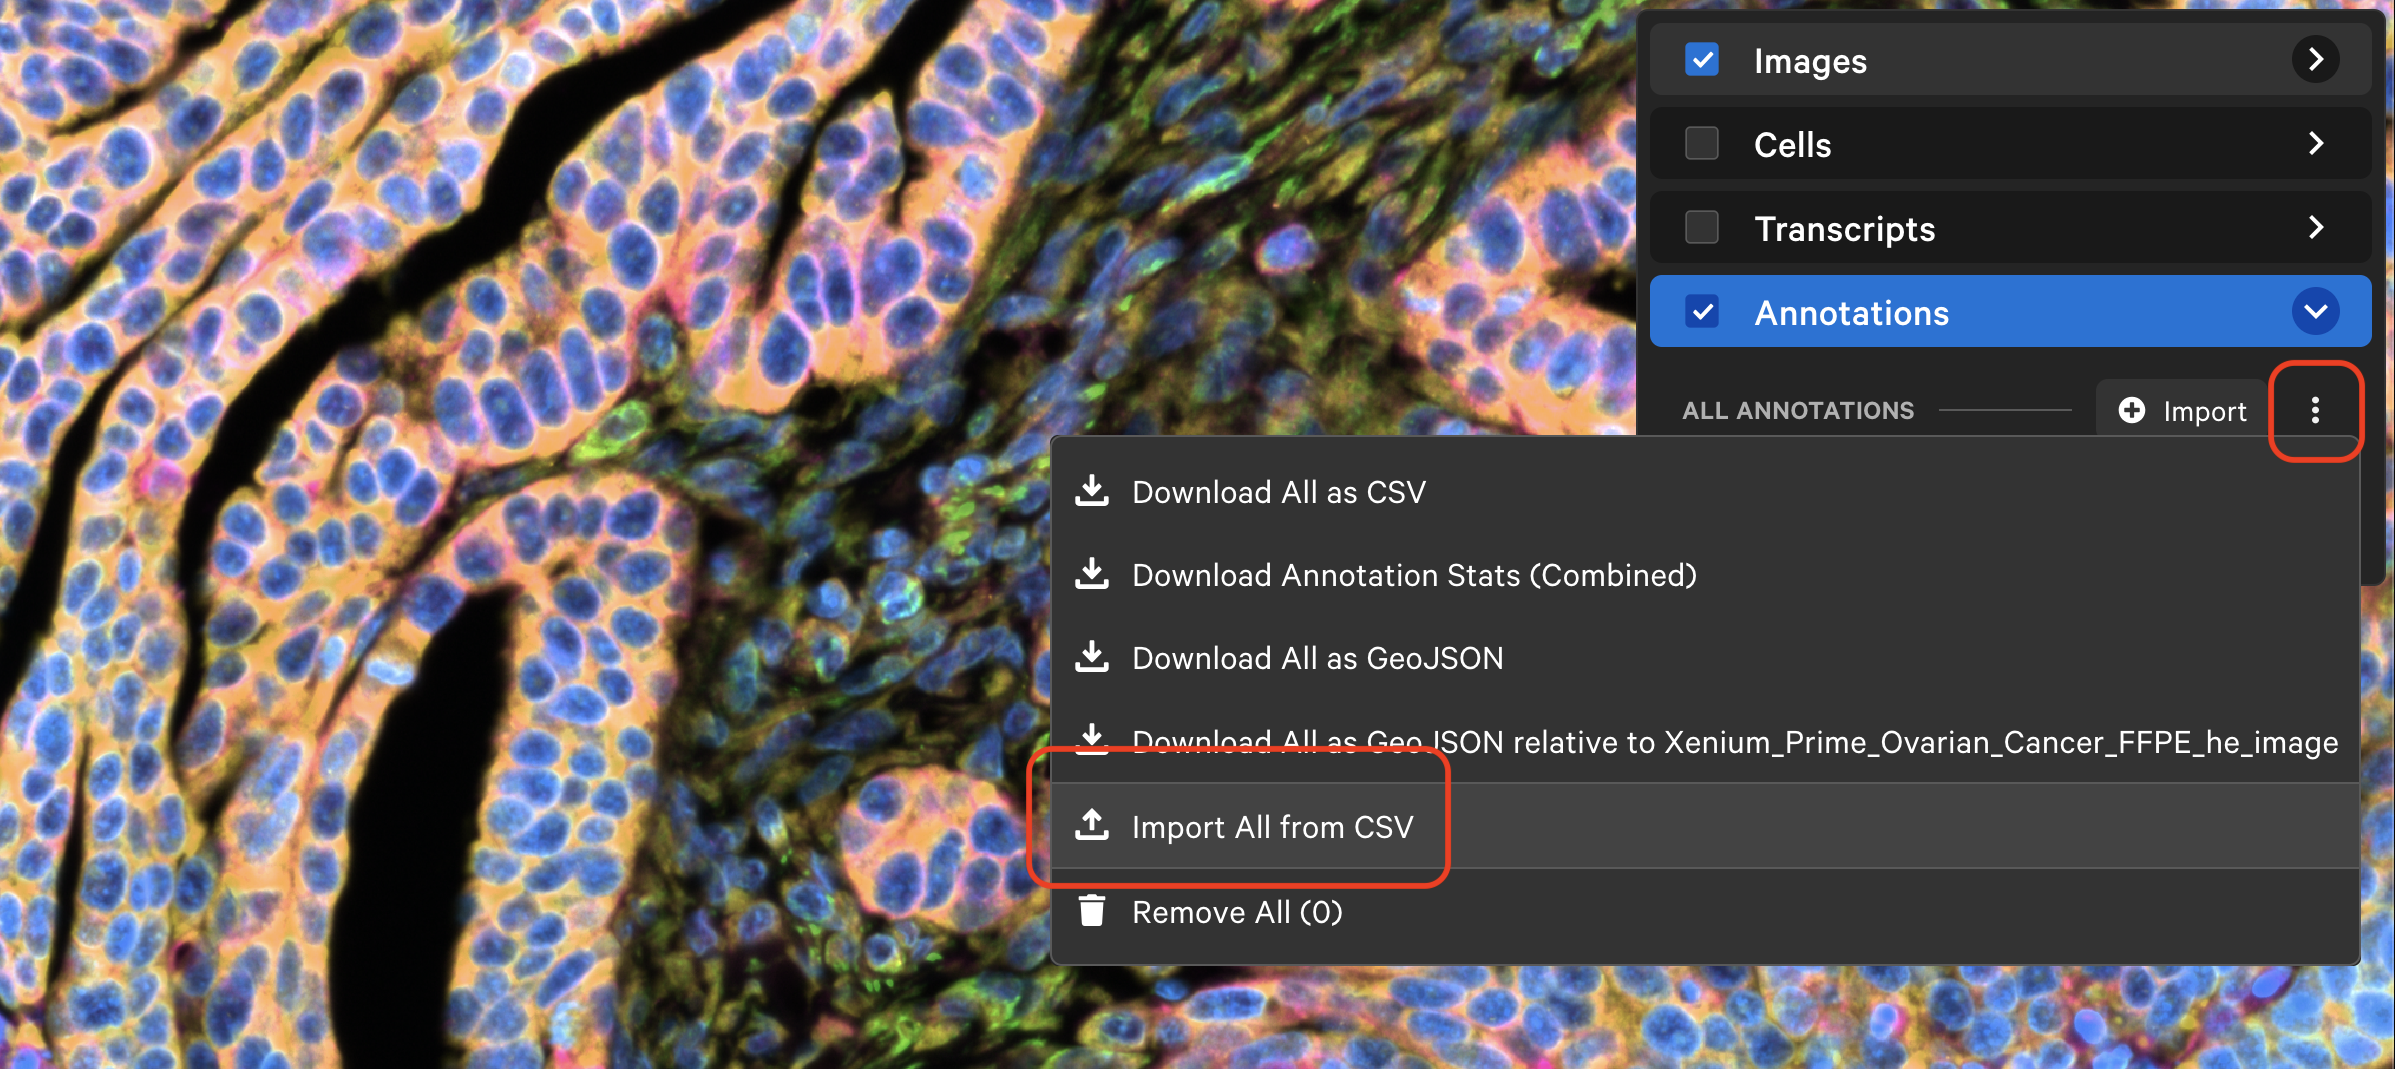
Downloaded selection CSV files with one selection had the header X,Y in Xenium Explorer v1.0 - 3.2. To use in 10x Explorer, edit these files to include a Selection column (Selection,X,Y). It should match the example shown here.
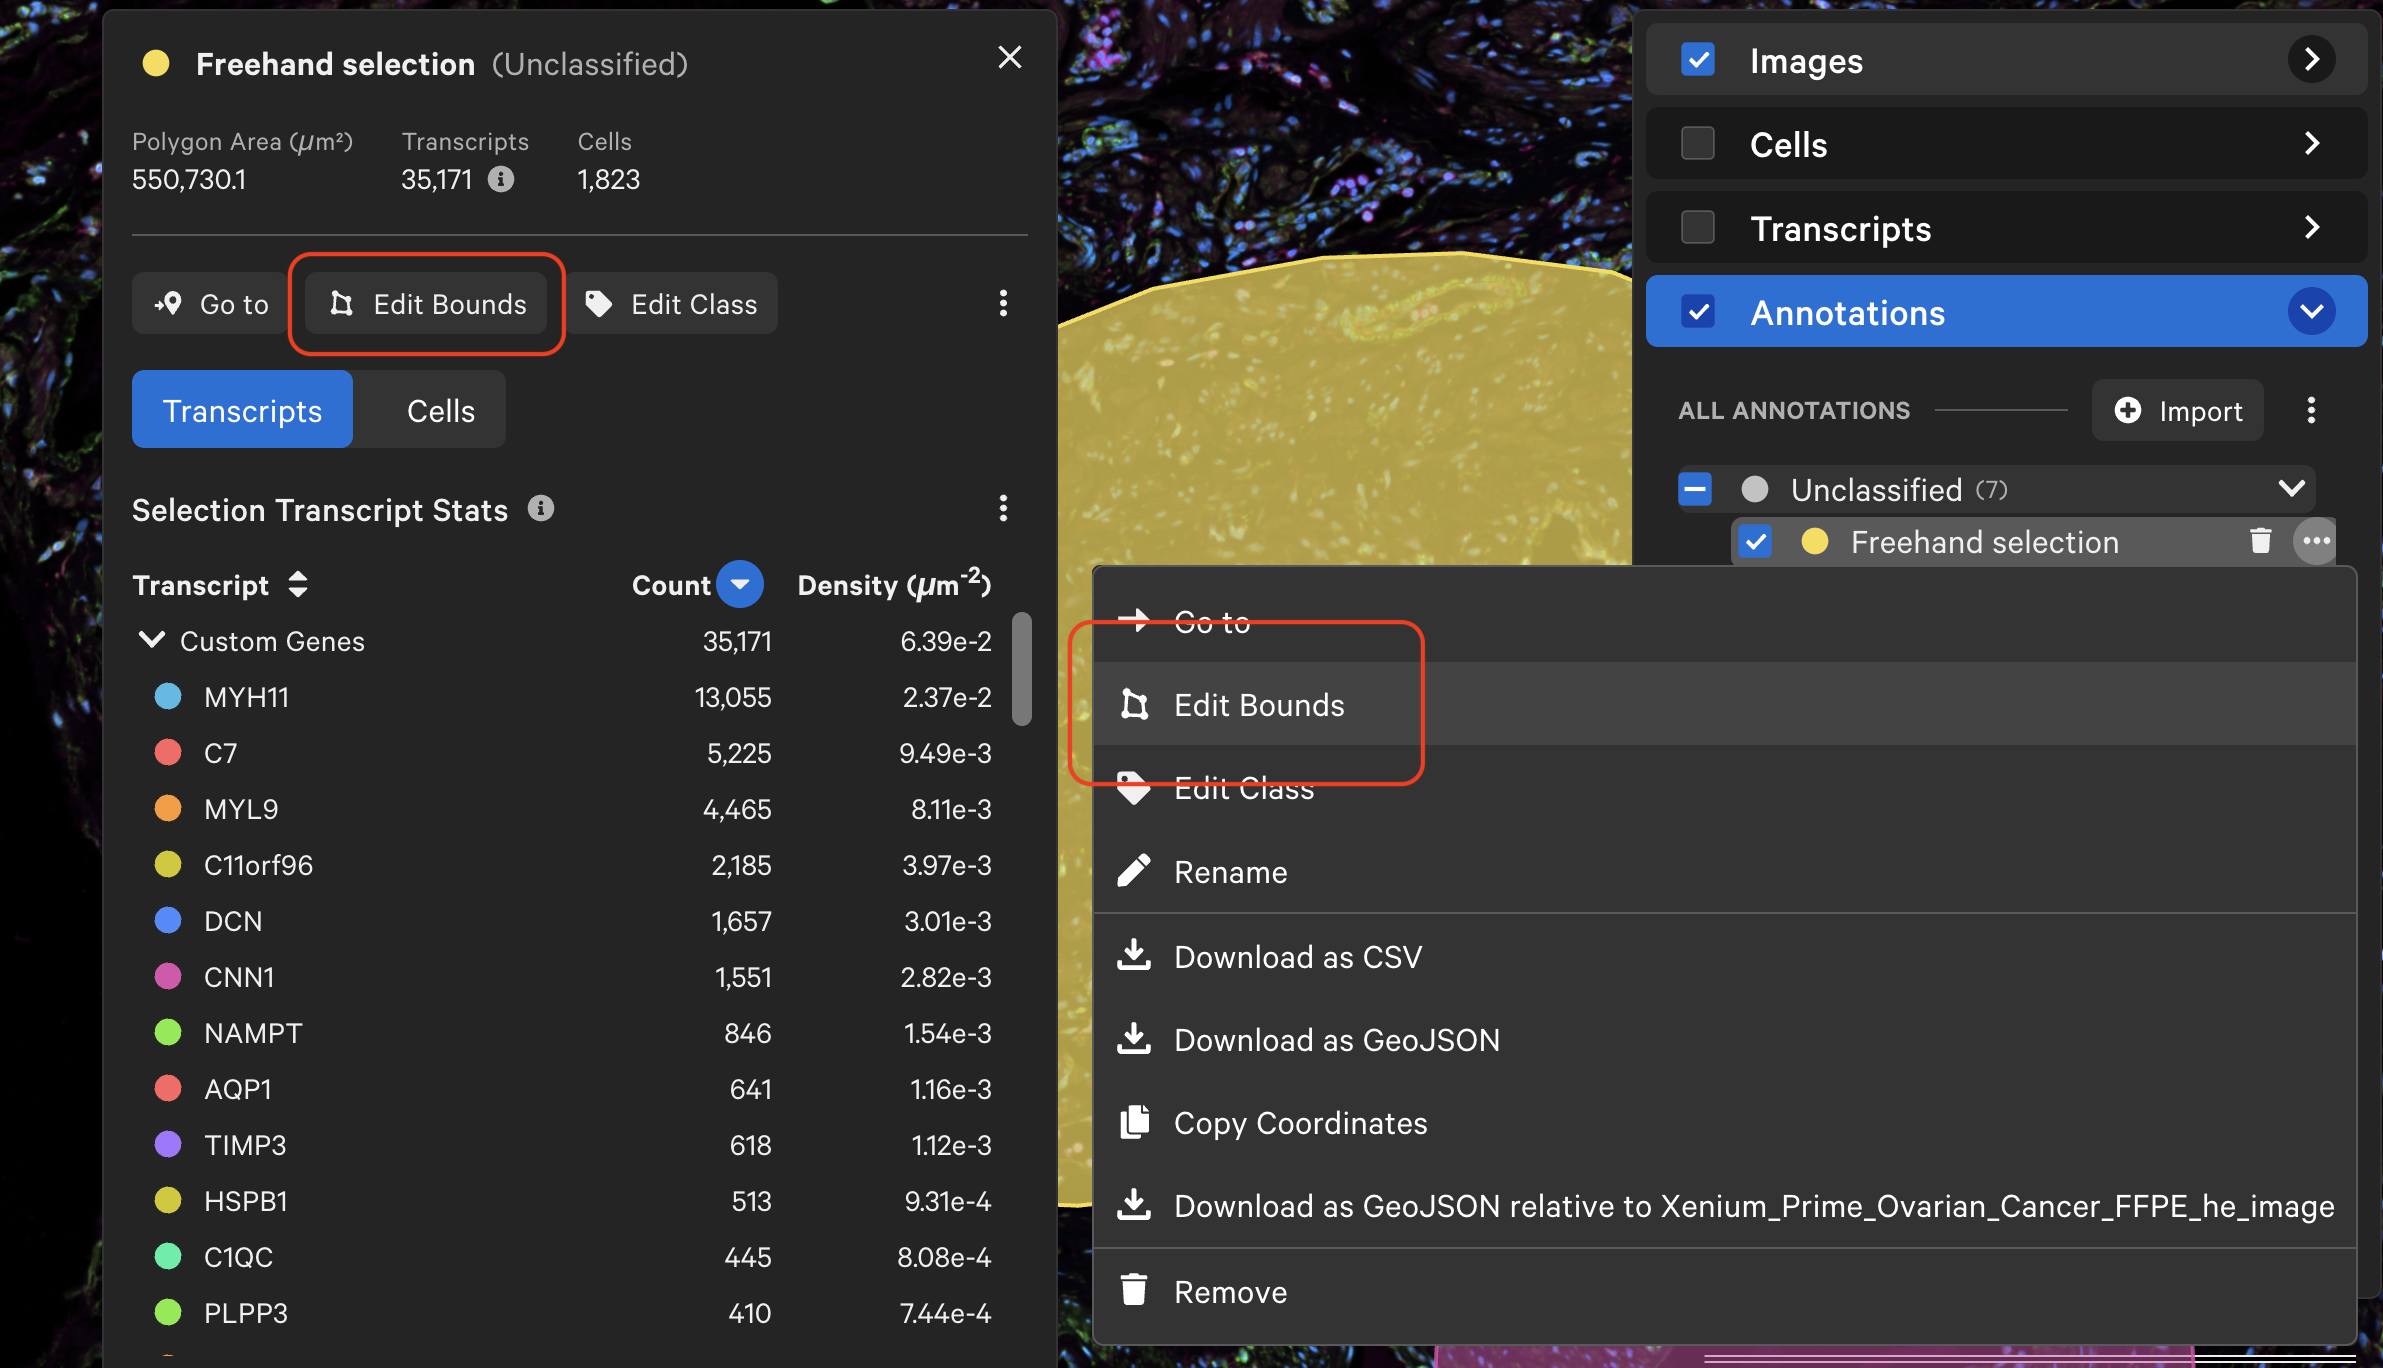
For any annotation shape, use any of the following options to edit it:
- Click on the annotation and click Edit Bounds from the Selection window
- Click on the annotation, click the three dots, and click Edit Bounds
- Double-click on the annotation shape
You can adjust the position of:
- The entire annotation shape by turning the toggle on to "Allow moving the whole selection". Click within the shape and move with your mouse.
- Each point by clicking a point and moving with your mouse. Click on a line between points to add a new point. Press the "Shift" key and click on a point to remove it. Remember that cells must be completely contained in the selection to be counted for the selection stats.
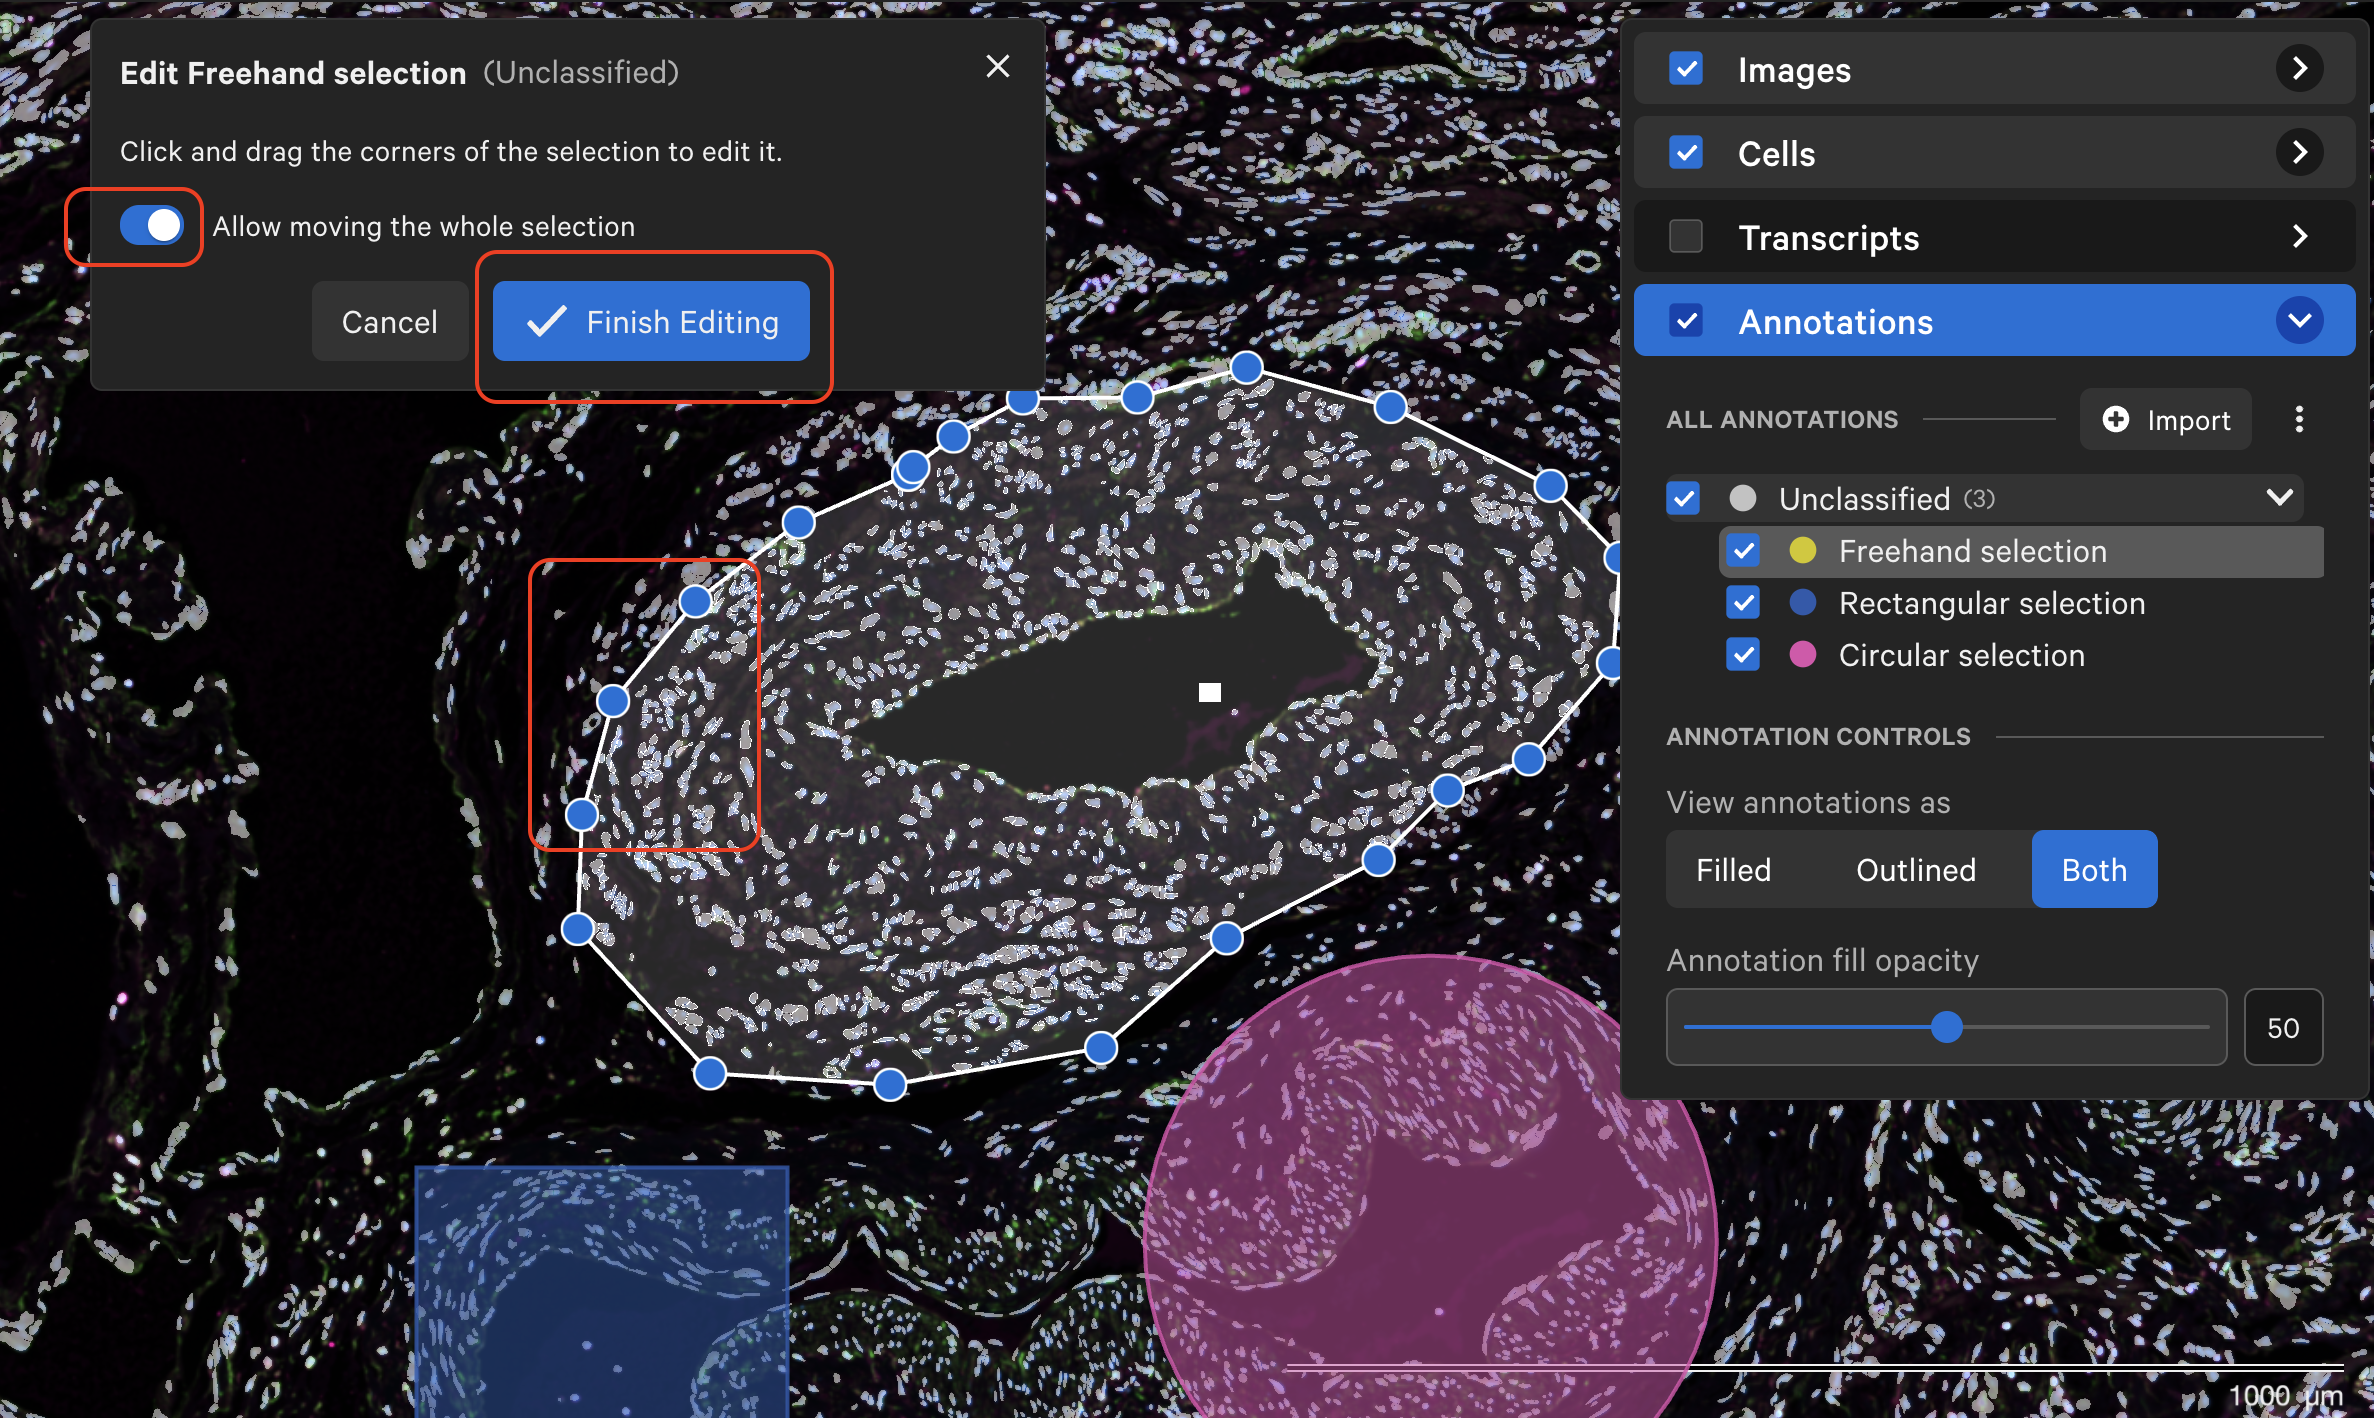
When complete, click Finish Editing or double-click outside the selection shape. The Info, Transcripts, Cells, and Protein information will be updated to match the edited area.
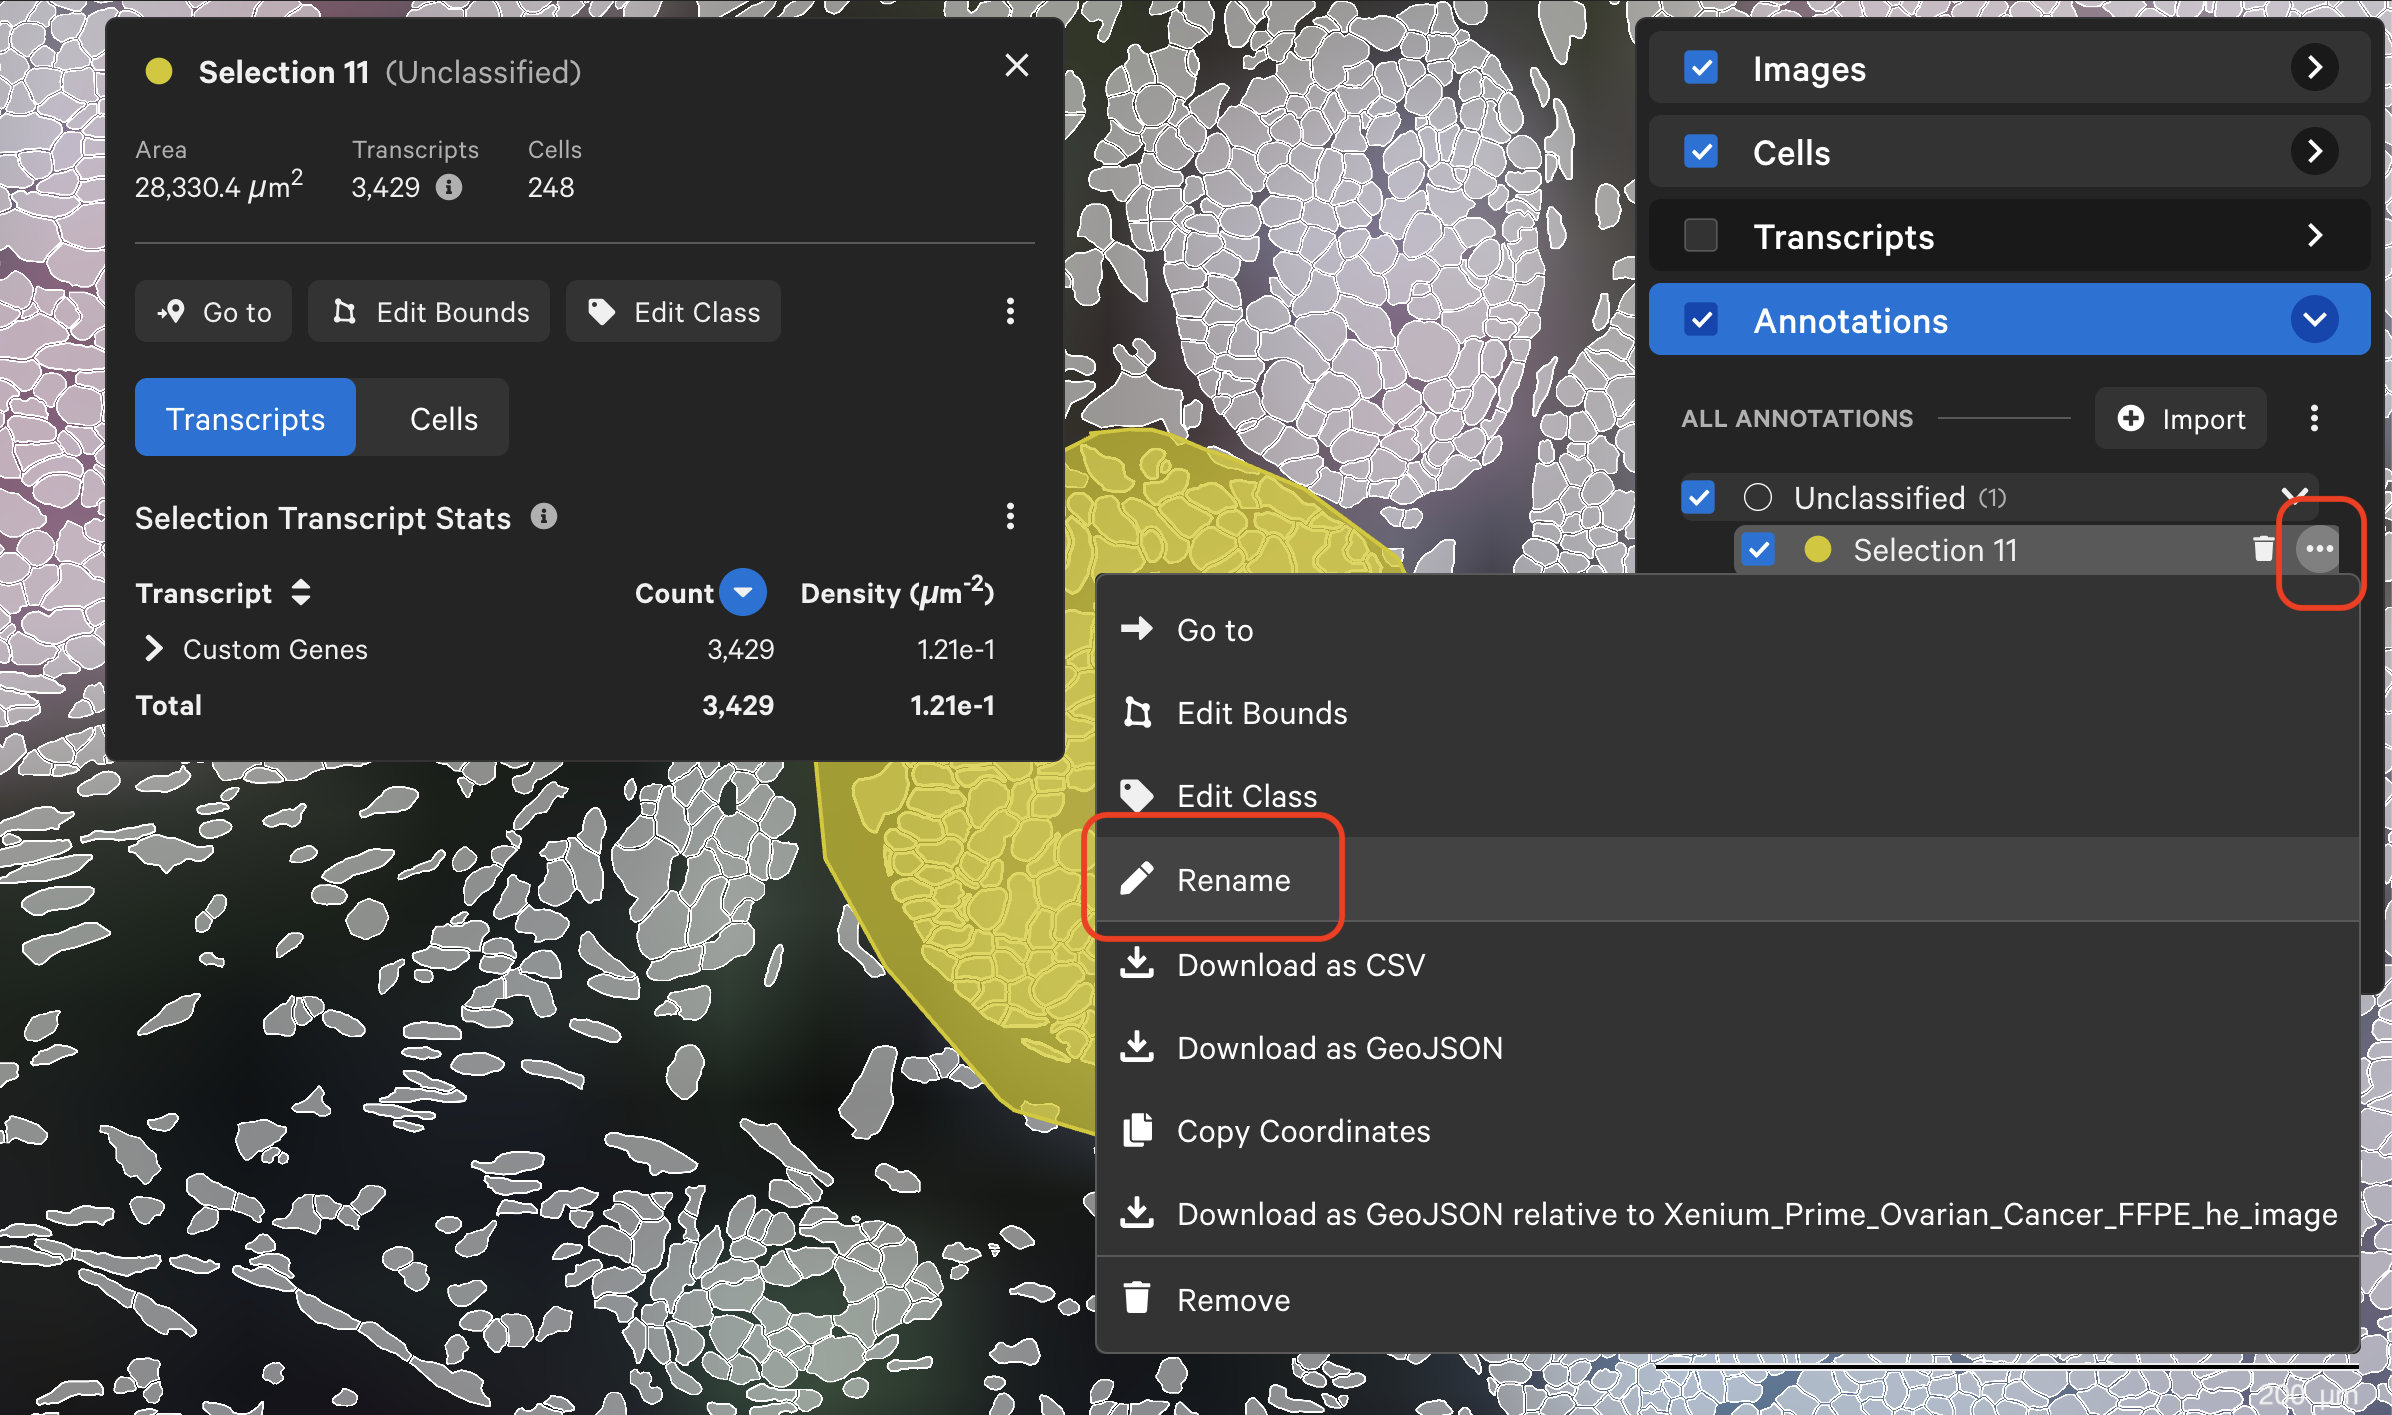
Annotated ROIs are automatically labeled and can be renamed. Selected cells are labeled by cell ID and cannot be renamed.
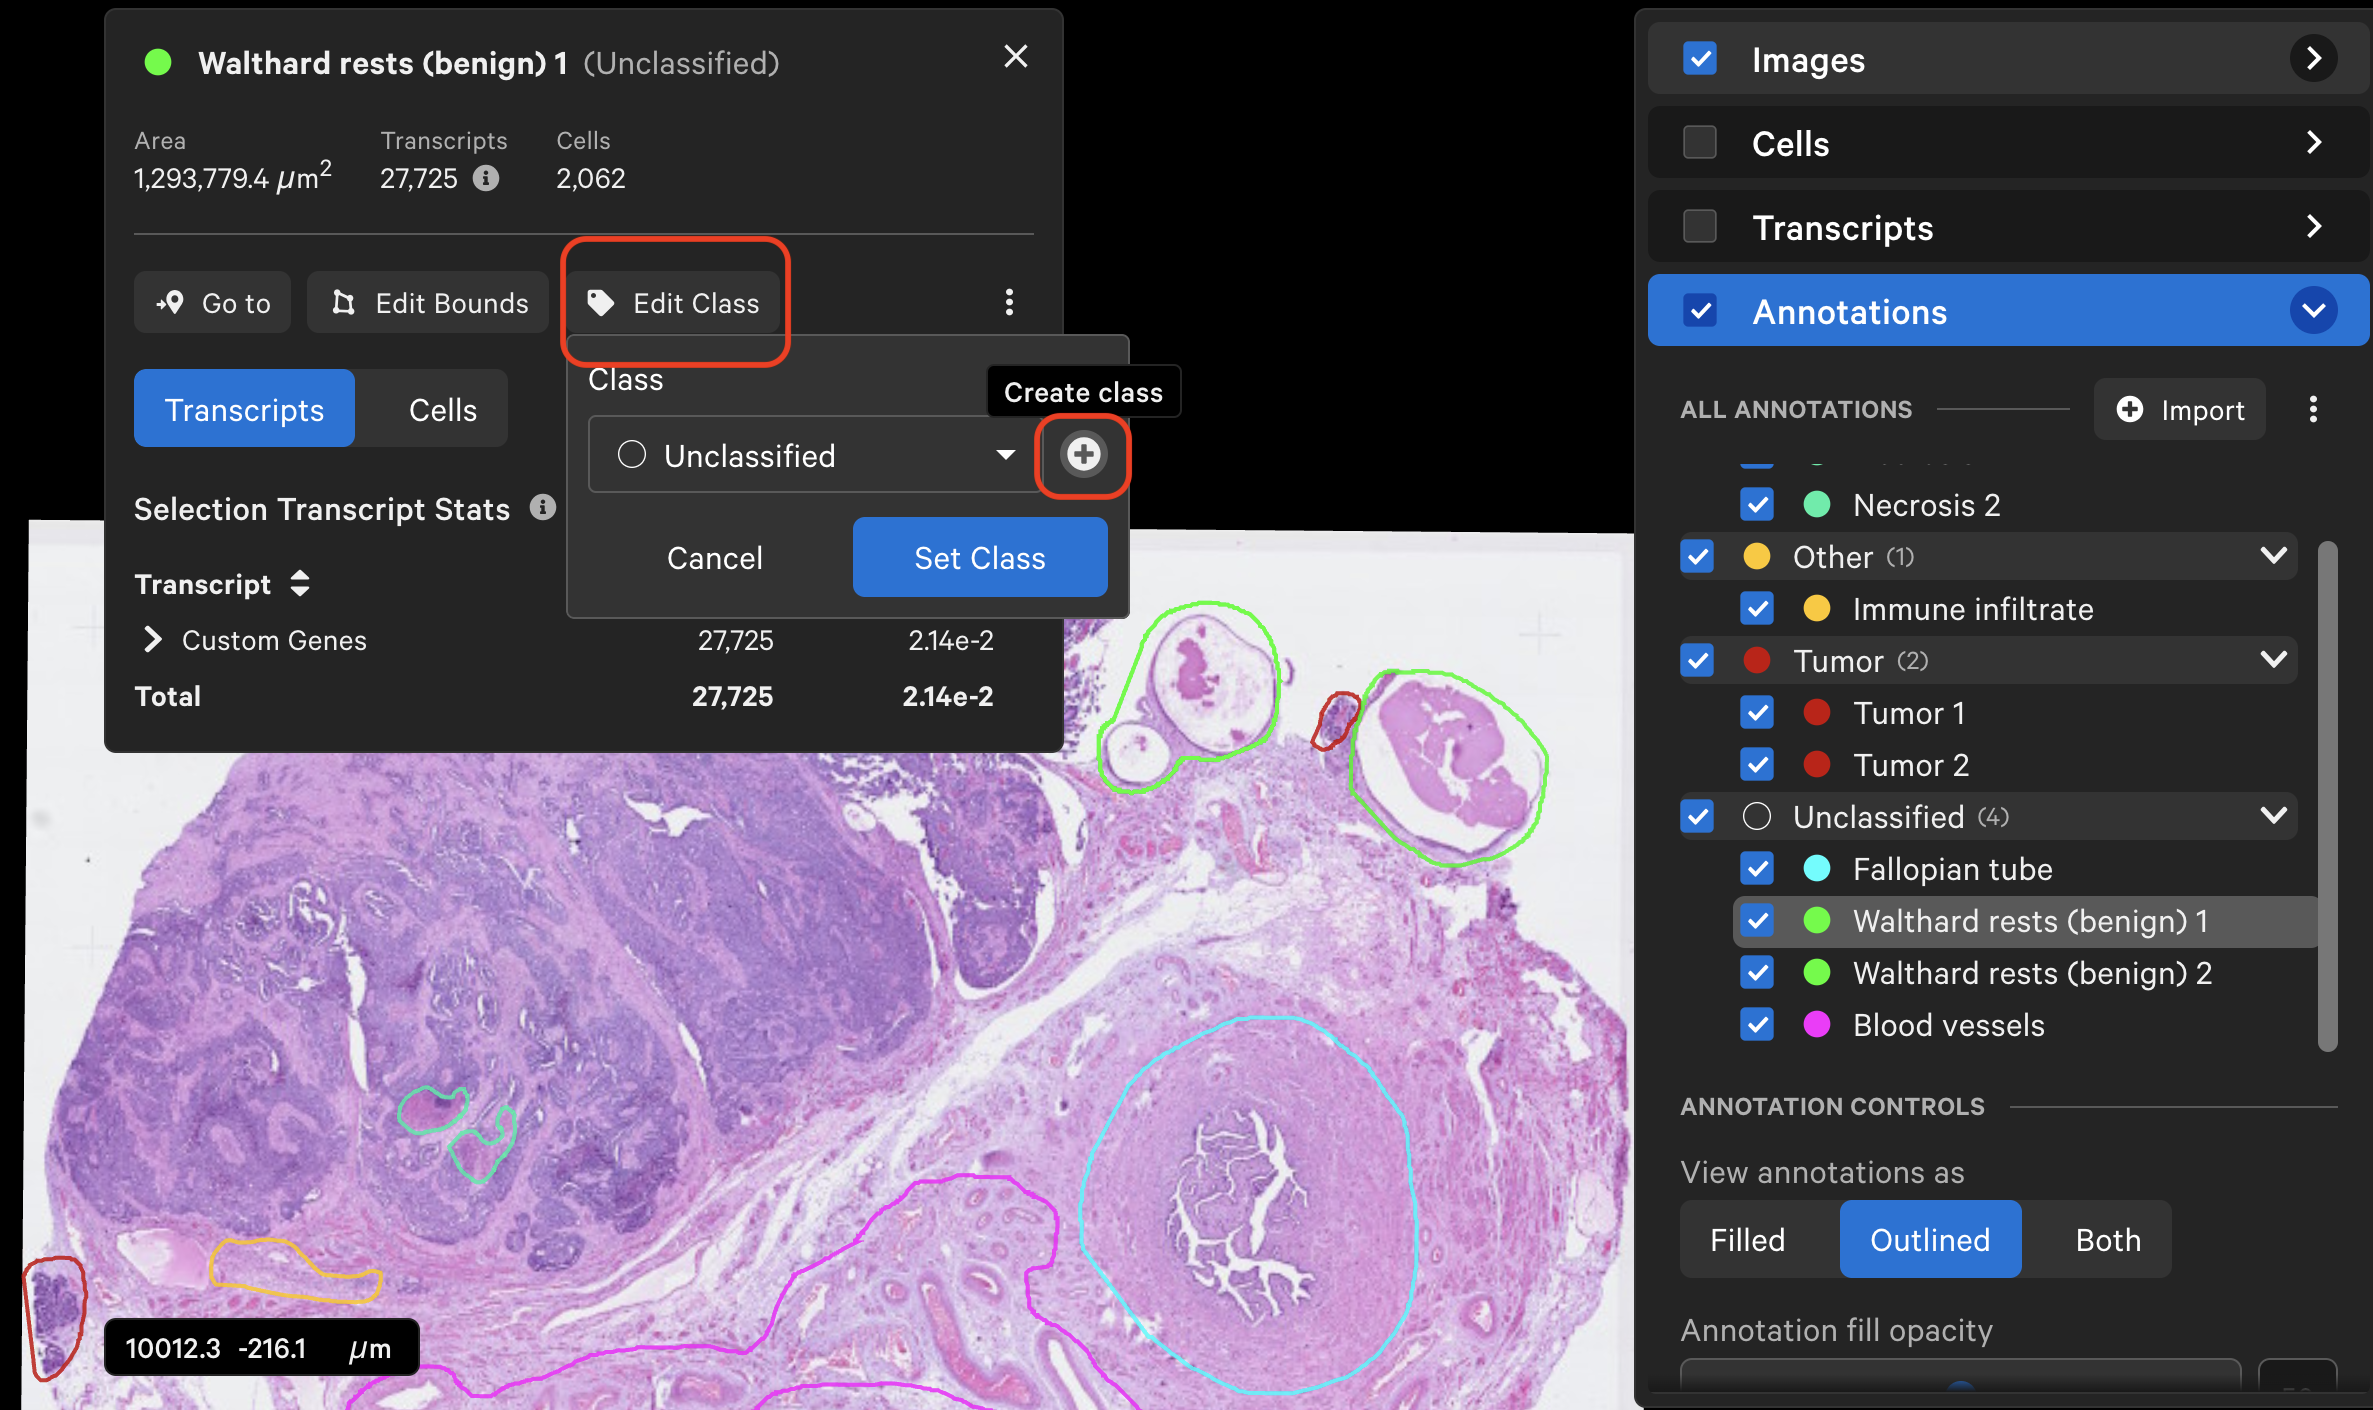
Annotations can be grouped by classification labels (class). When first drawn, annotations are "Unclassified". Classes can be added and edited. Annotation class labels from third-party tools can be imported with the GeoJSON file import method.
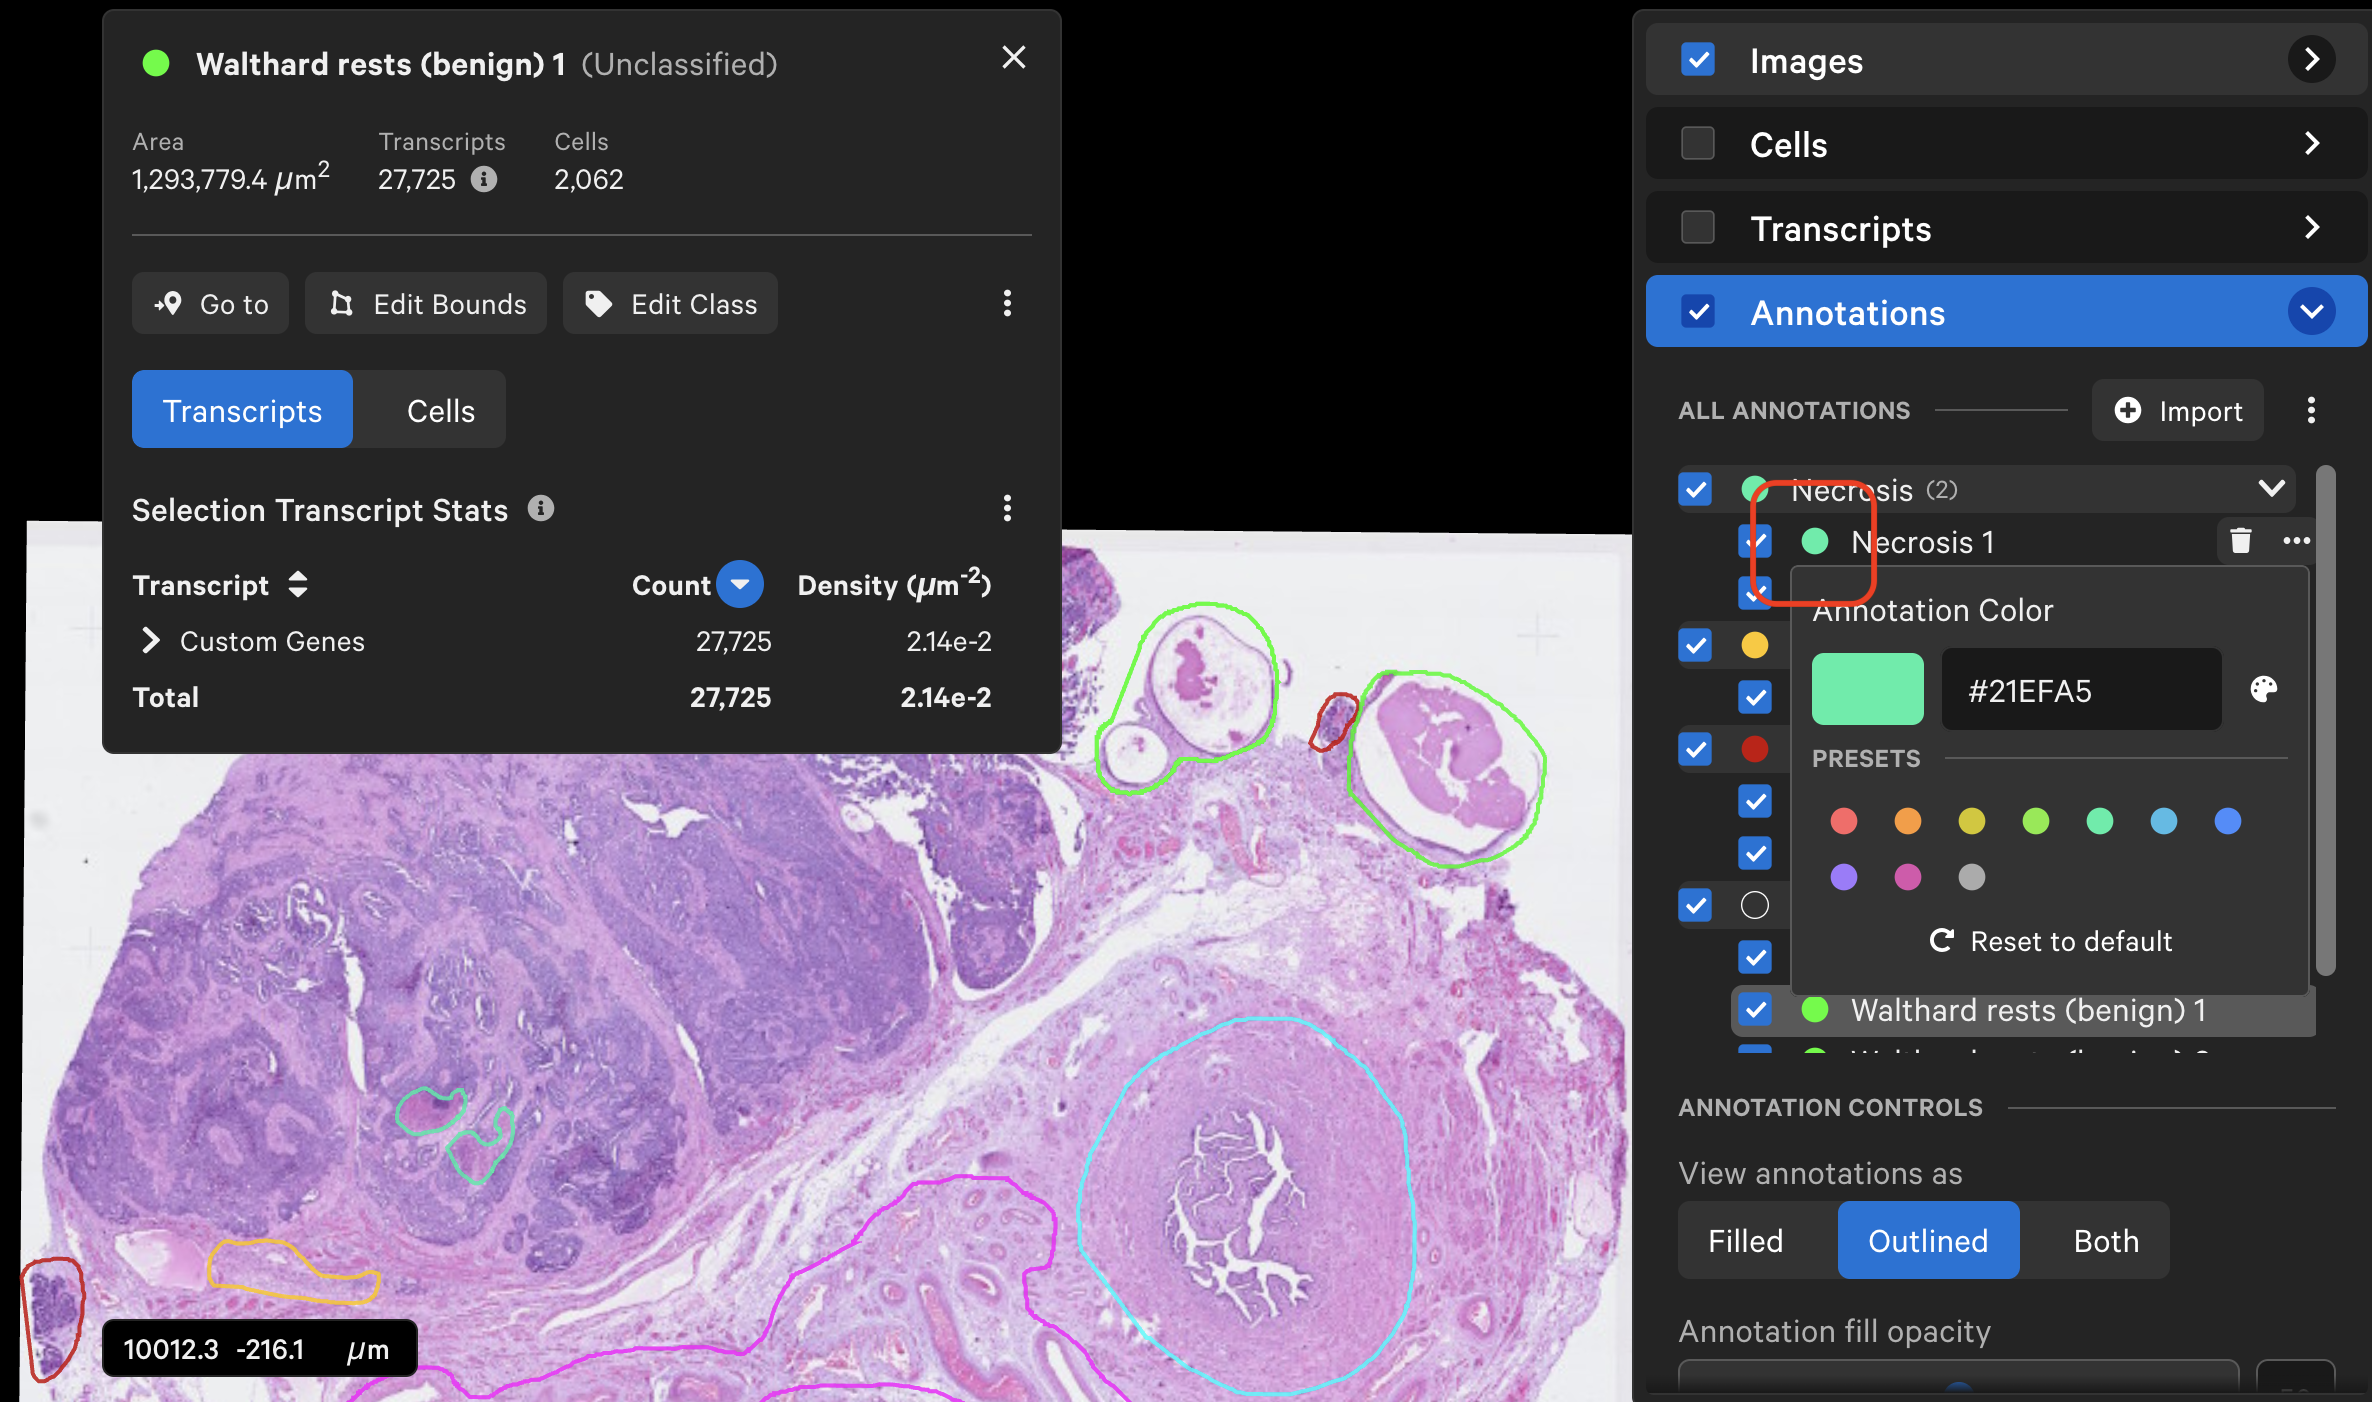
Each annotation's outline/fill color can be changed. Annotations within a class use the same outline/fill color, unless edited.
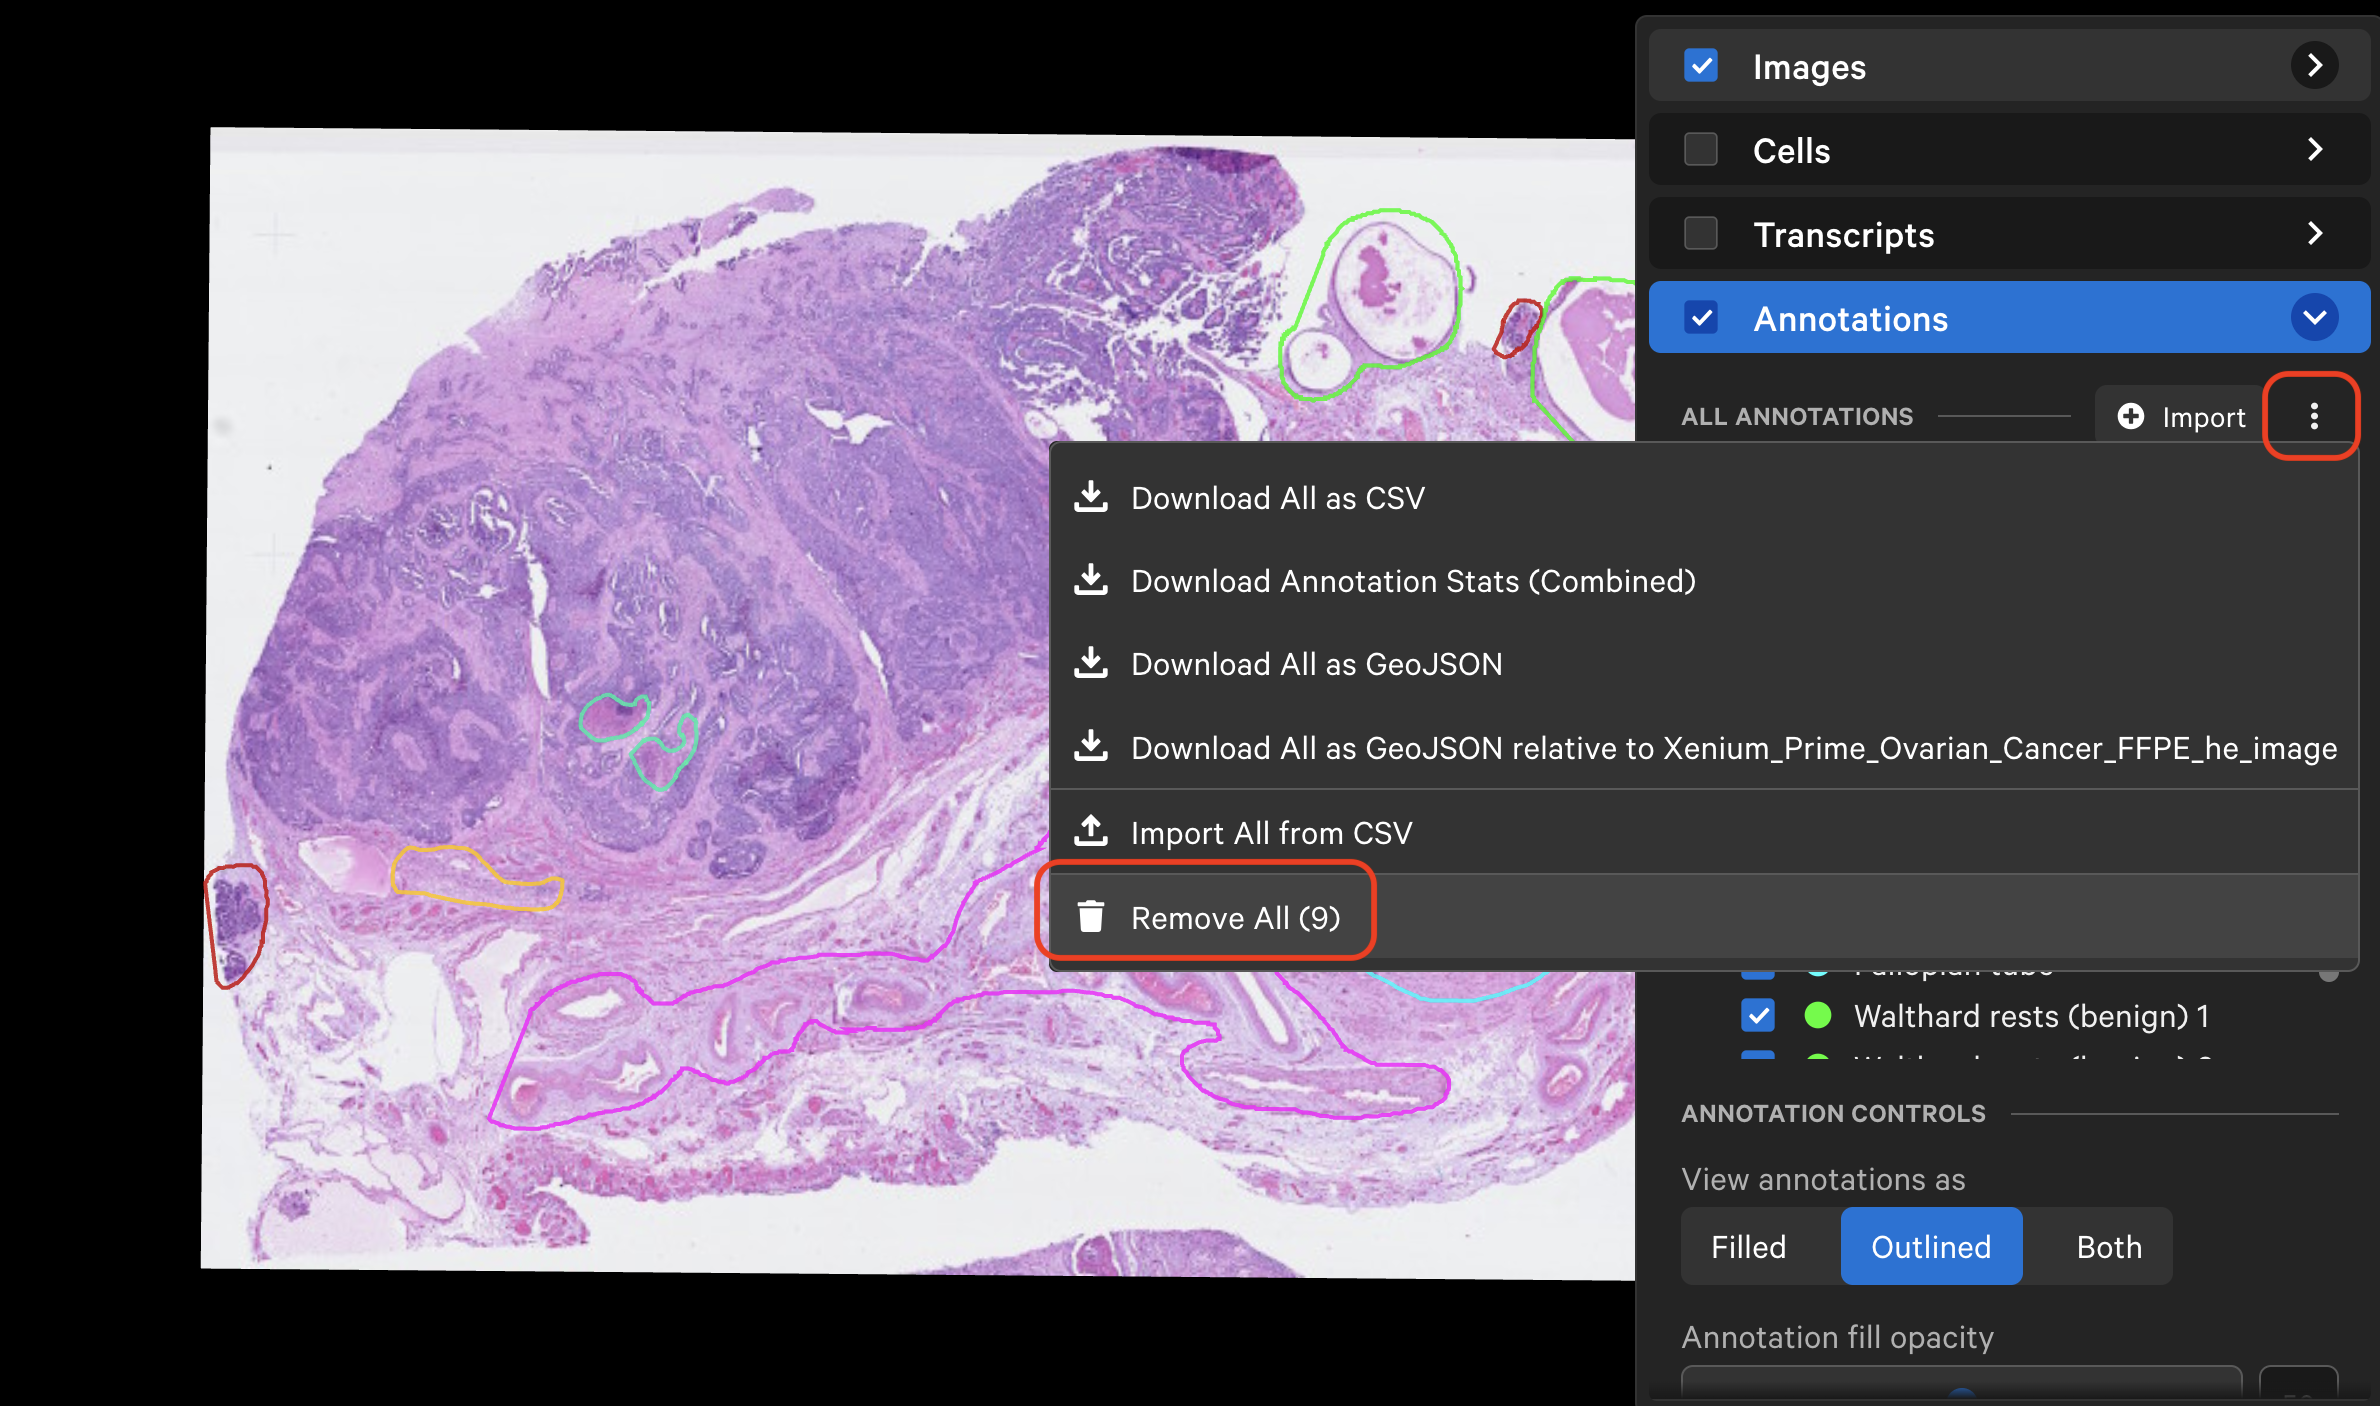
To remove all annotations, click the three dots next to the Import button and select Remove All:
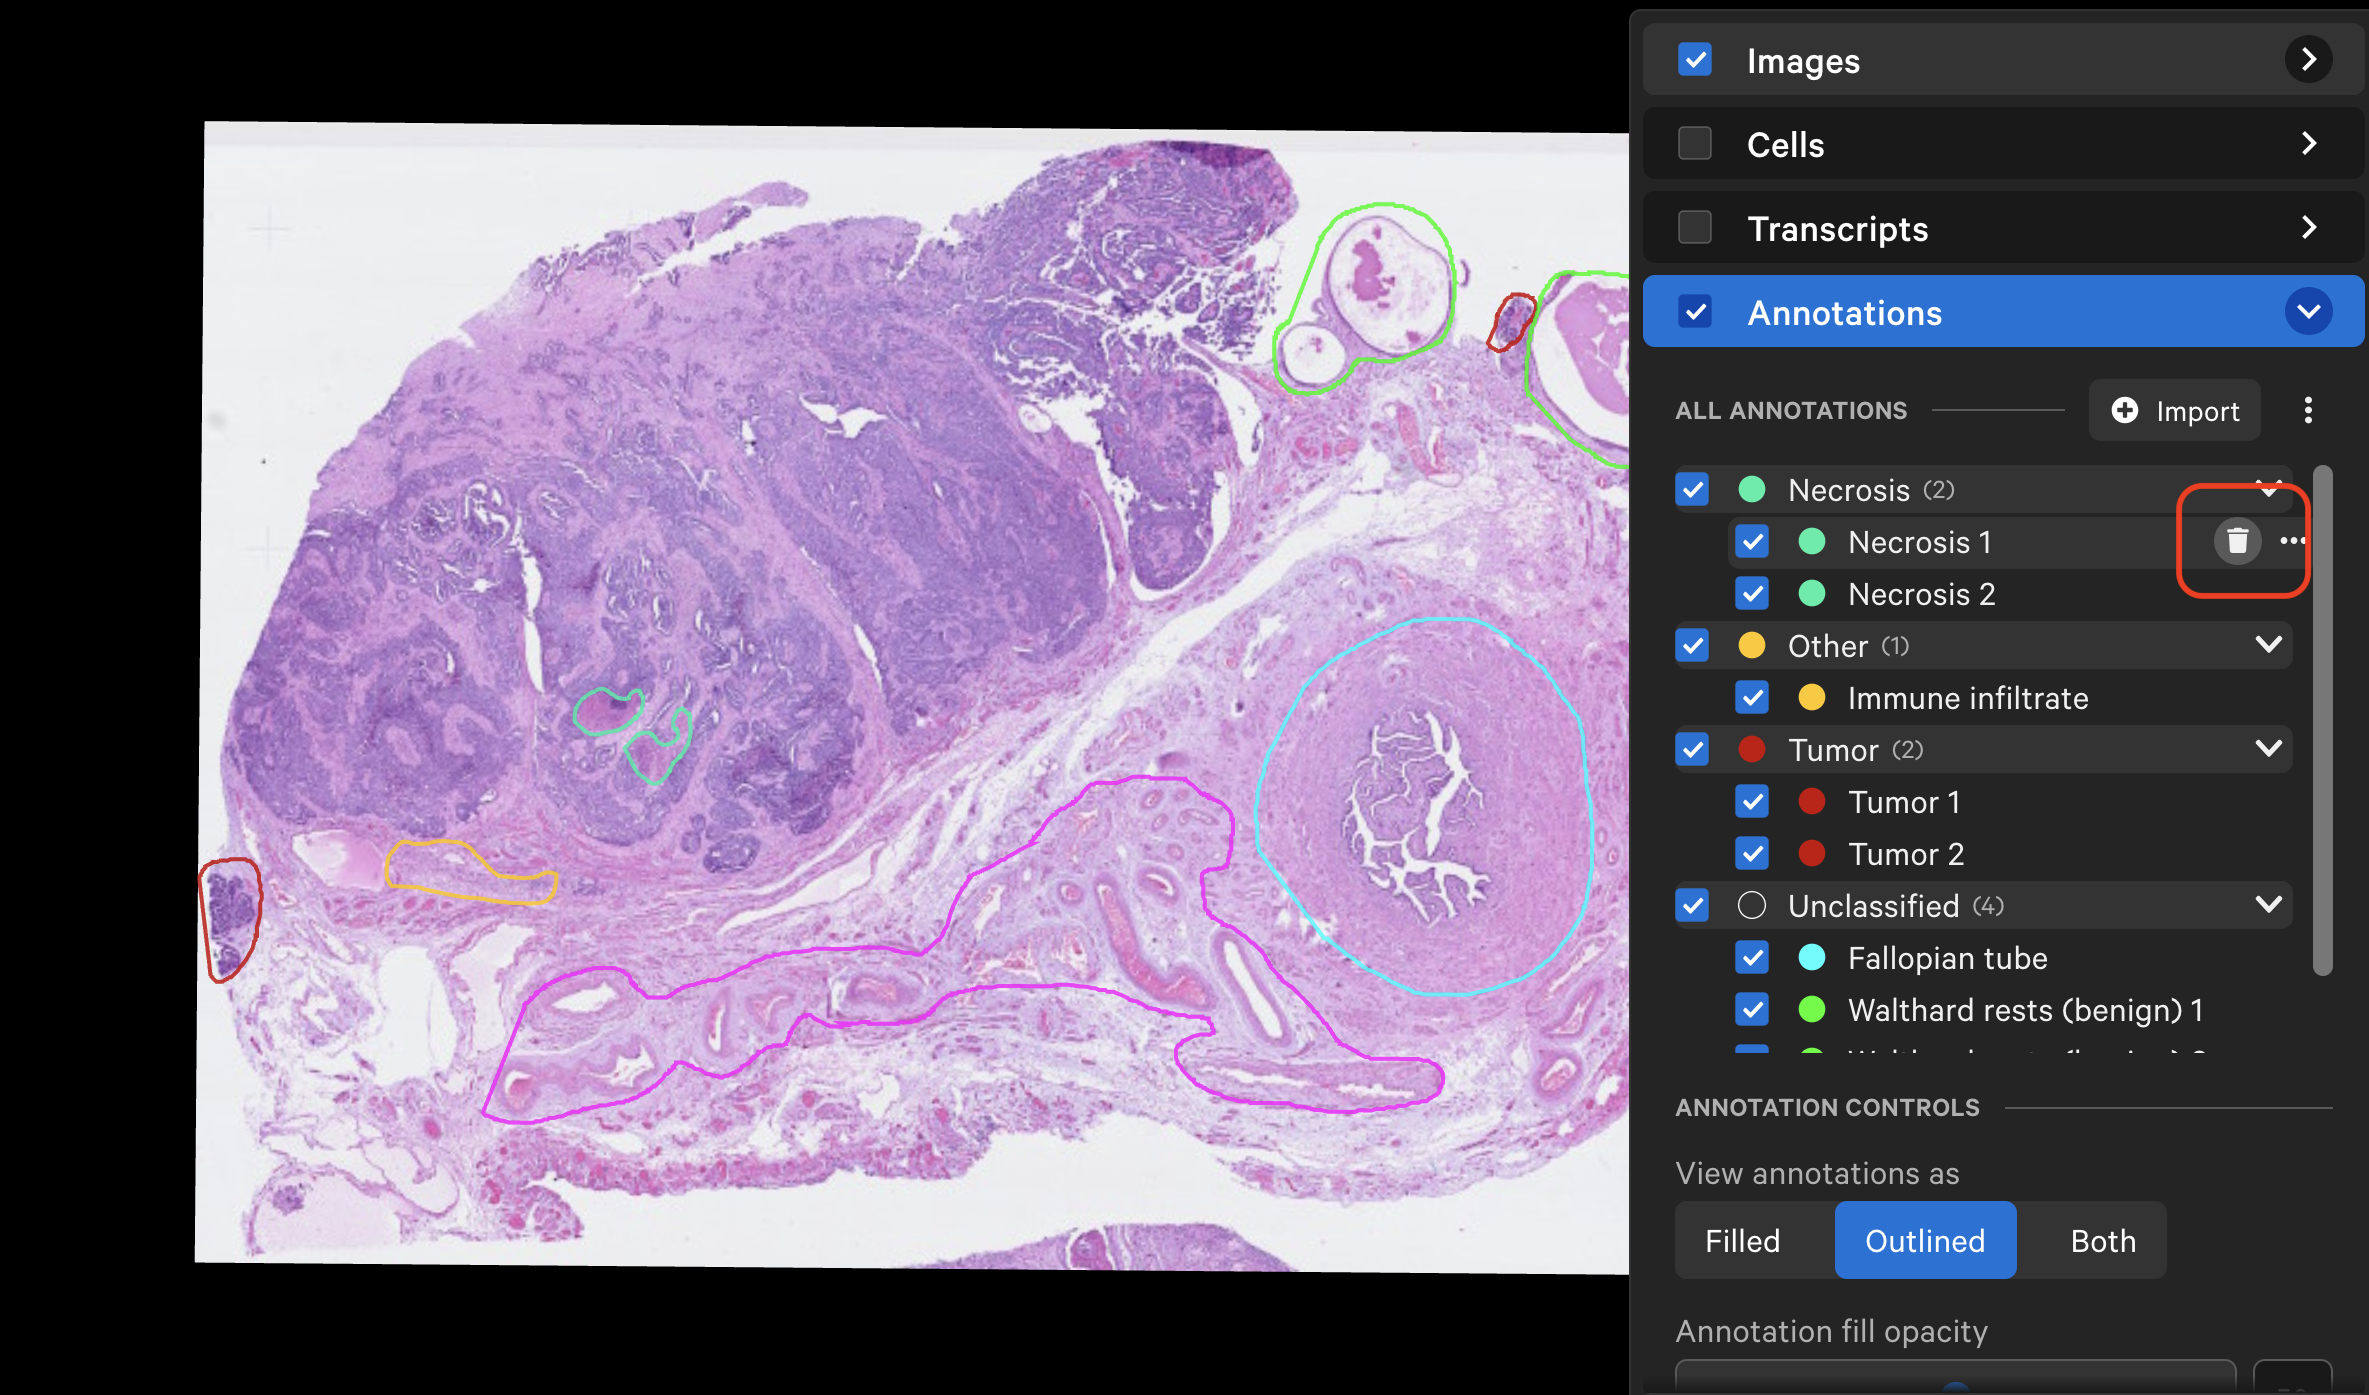
To remove specific annotations, either click the trash can icon or click the three dots and select Remove.
Click the three dots next to the Import button to download all coordinates and stats (transcript, cell and cluster, protein) for annotations listed in the layer. You can bulk download up to 100 annotations at a time.
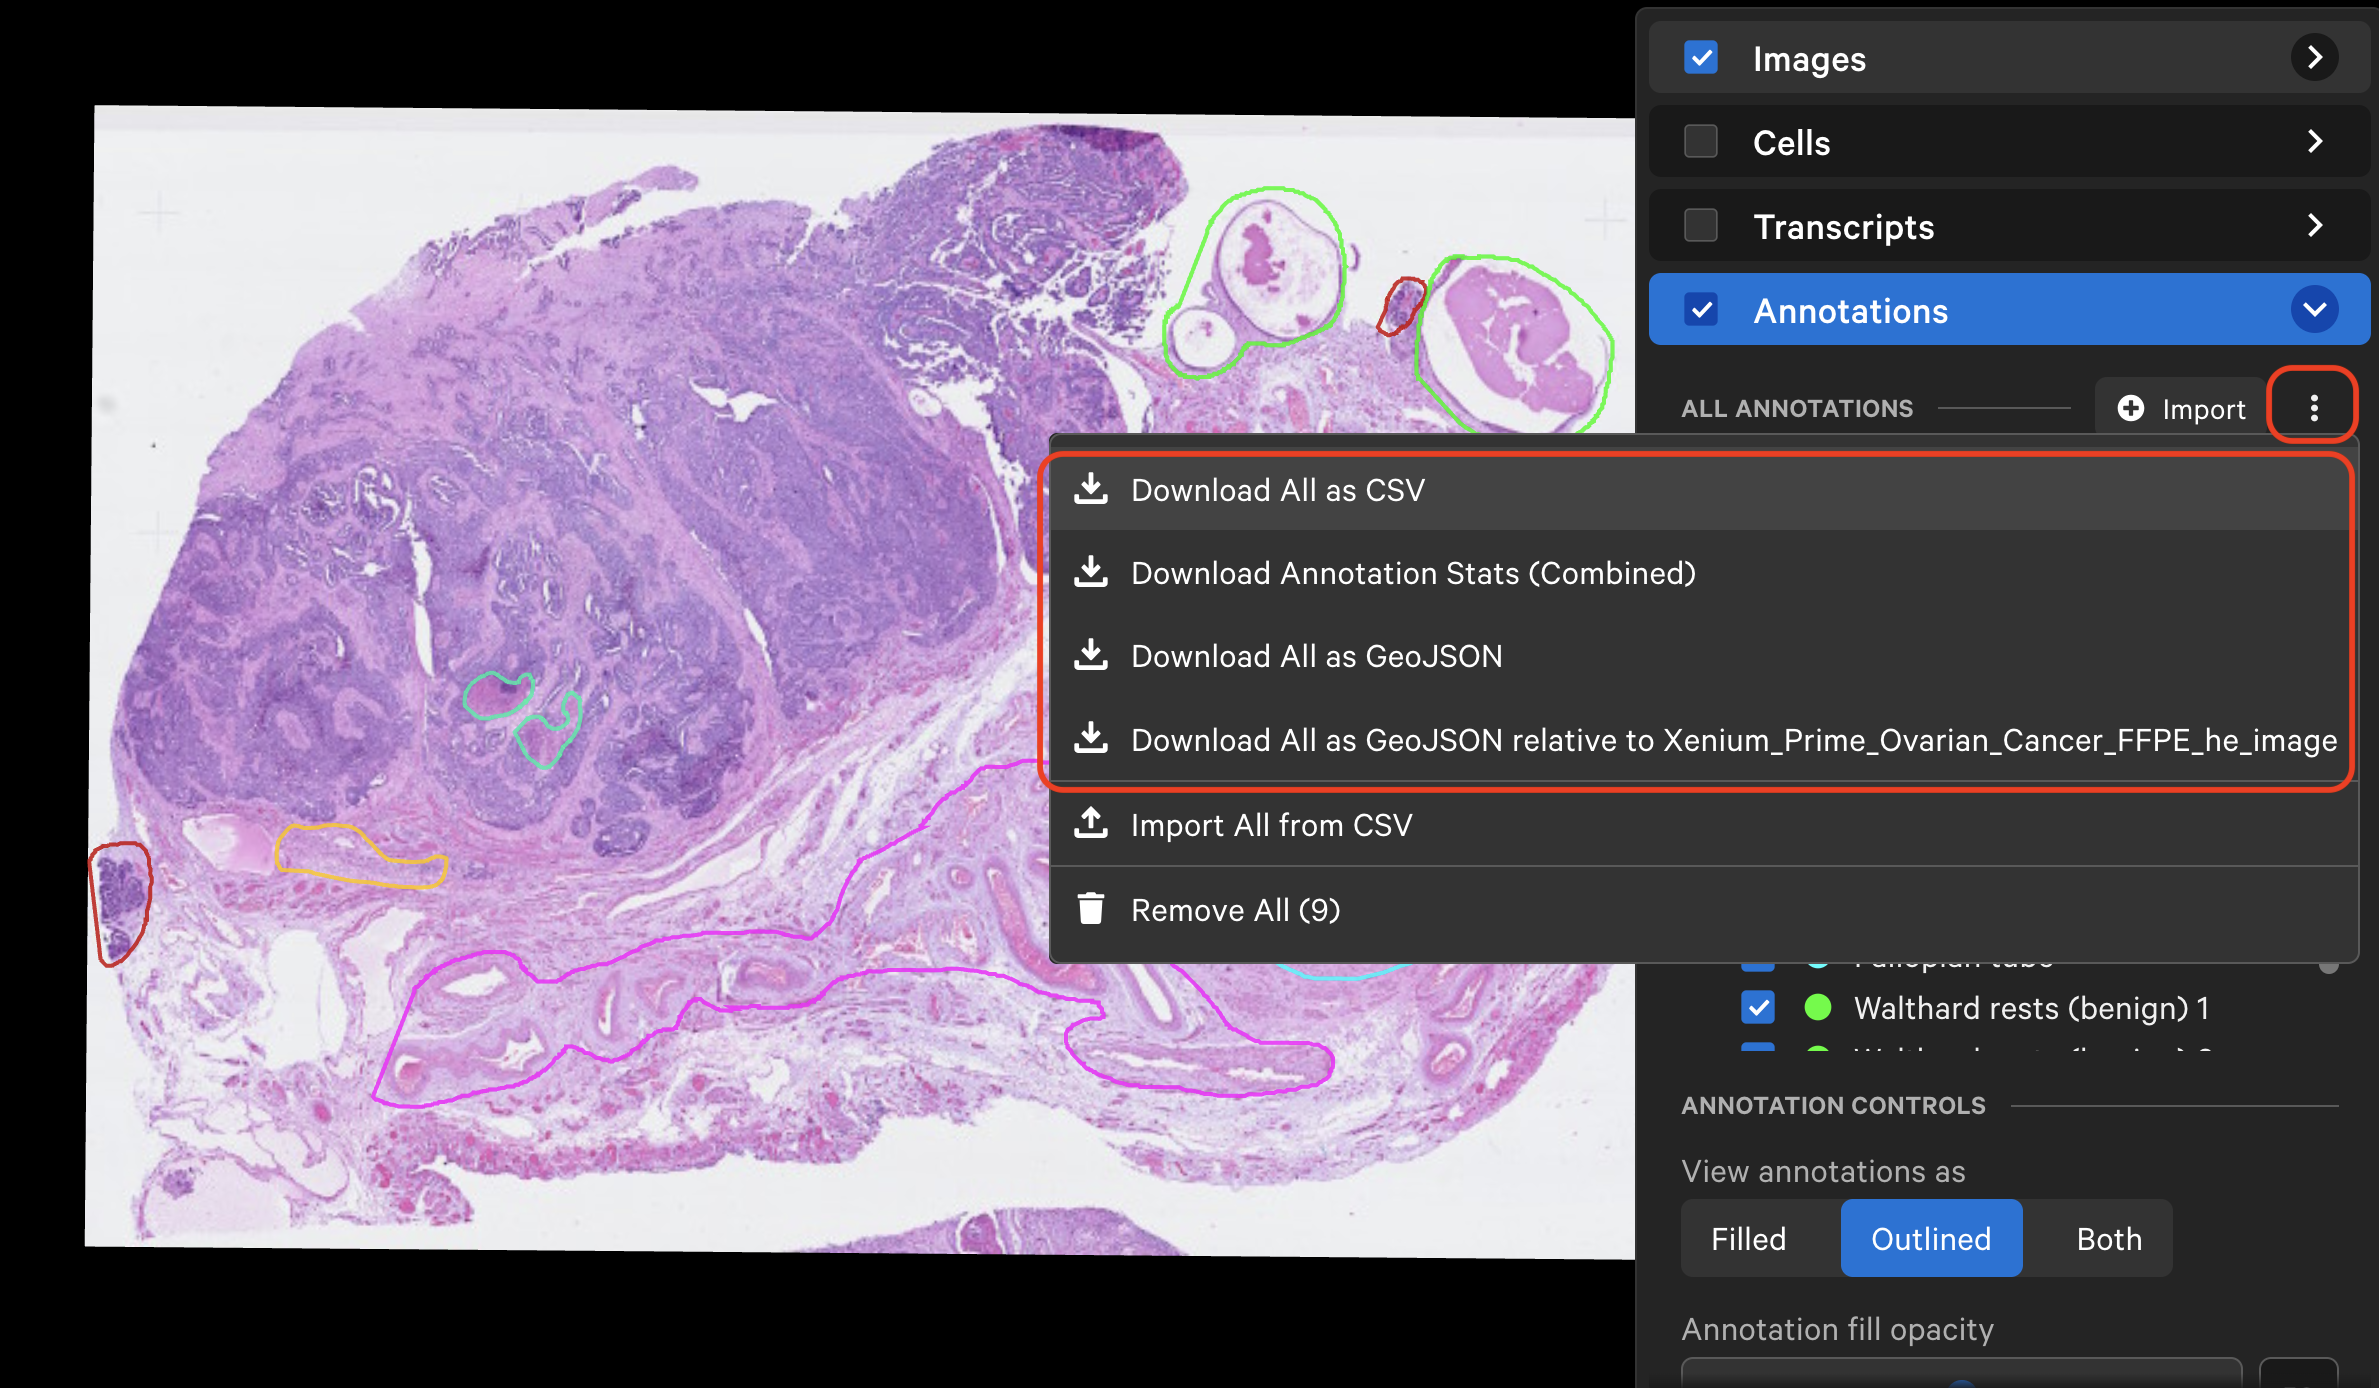
Both the GeoJSON and CSV coordinate files from bulk download can be later re-imported to 10x Explorer or imported to third-party software for further analysis.
| Download option | Output file |
|---|---|
| "Download All as CSV" | All coordinates as a CSV file, aligned to the 3D morphology image |
| "Download All as GeoJSON" | All coordinates as a GeoJSON file, aligned to the 3D morphology image |
| "Download All as GeoJSON relative to ..." | All coordinates as a GeoJSON file, aligned to the imported post-instrument image |
| "Download Annotation Stats (Combined)" | All selection cell, transcript, and protein (if available) stats for all annotations as a CSV file |
Here is an example of the coordinates CSV file. The header lists the selected ROI and cell ID names:
#Selection names:,Cell flchpeic-1, Selection 1
#Areas (µm^2): 46.96, 1071.38
Selection,X,Y
Cell flchpeic-1,3895.54,5721.14
Cell flchpeic-1,3894.26,5722.19
[ ... ]
Selection 1,3910.93,5386.55
Selection 1,3914.01,5384.67
[ ... ]
Here is an example of the bulk stats CSV file. There is an empty row between stat tables:
Annotation Name,Area (µm^2),Cell Count,Transcript Count
Selection 1,445001.41,3994,1223
Annotation Name,Gene,Count,Density (µm^-2)
Selection 1,ABCA10,171,3.84e-4
Selection 1,ABCA8,172,3.87e-4
Selection 1,AC007906.2,880,1.98e-3
Annotation Name,Cell ID,Cluster ID,Total Transcripts,Cell Area
Selection 1,gdjgpmmb-1,Cluster 2,0,203.11
Selection 1,dlphleoo-1,Cluster 12,1,109.28
Selection 1,ejklnffb-1,Cluster 14,0,76.13
[ ... ]
Click the three dots next to a specific annotation to download its coordinates as CSV or GeoJSON (aligned either to the 3D morphology image or the imported post-instrument image).
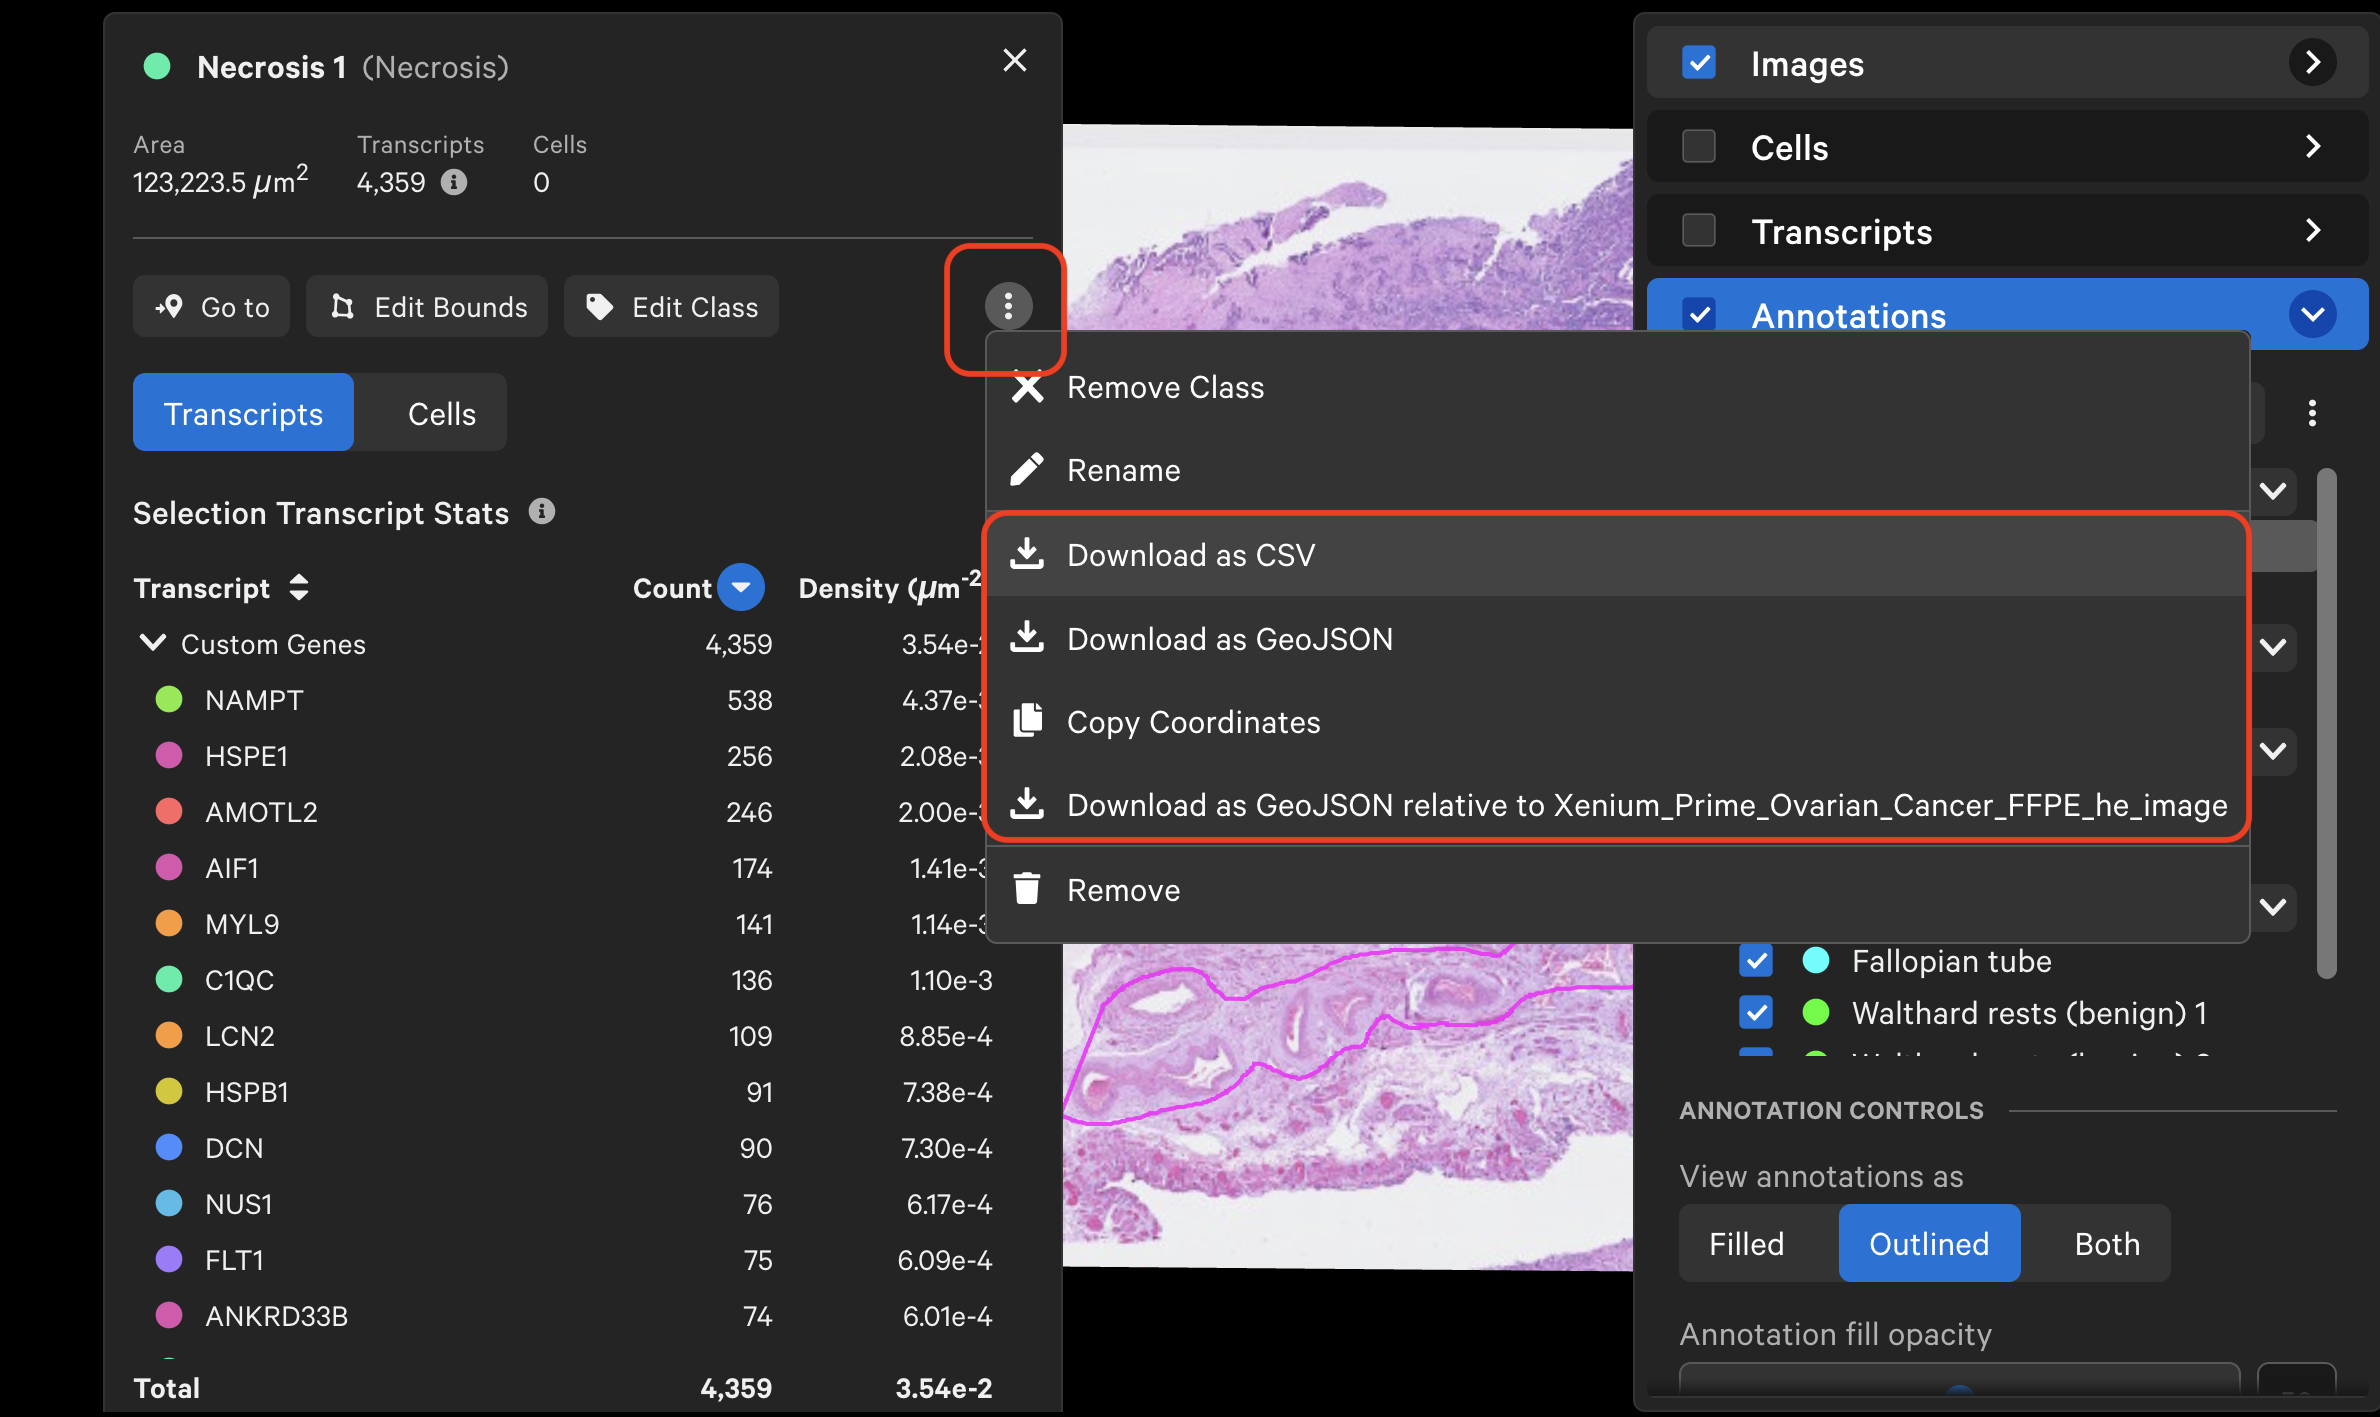
Example CSV format:
#Selection name: Selection 1
#Area (µm^2): 1071.38
Selection,X,Y
Selection 1,3910.93,5386.55
Selection 1,3914.01,5384.67
Selection 1,3914.11,5384.67
[ ... ]
Click the three vertical dots on the Transcripts tab to copy or download a CSV file of transcript stat information. Transcript counts can be sorted in increasing or decreasing order in the selection pop-up.
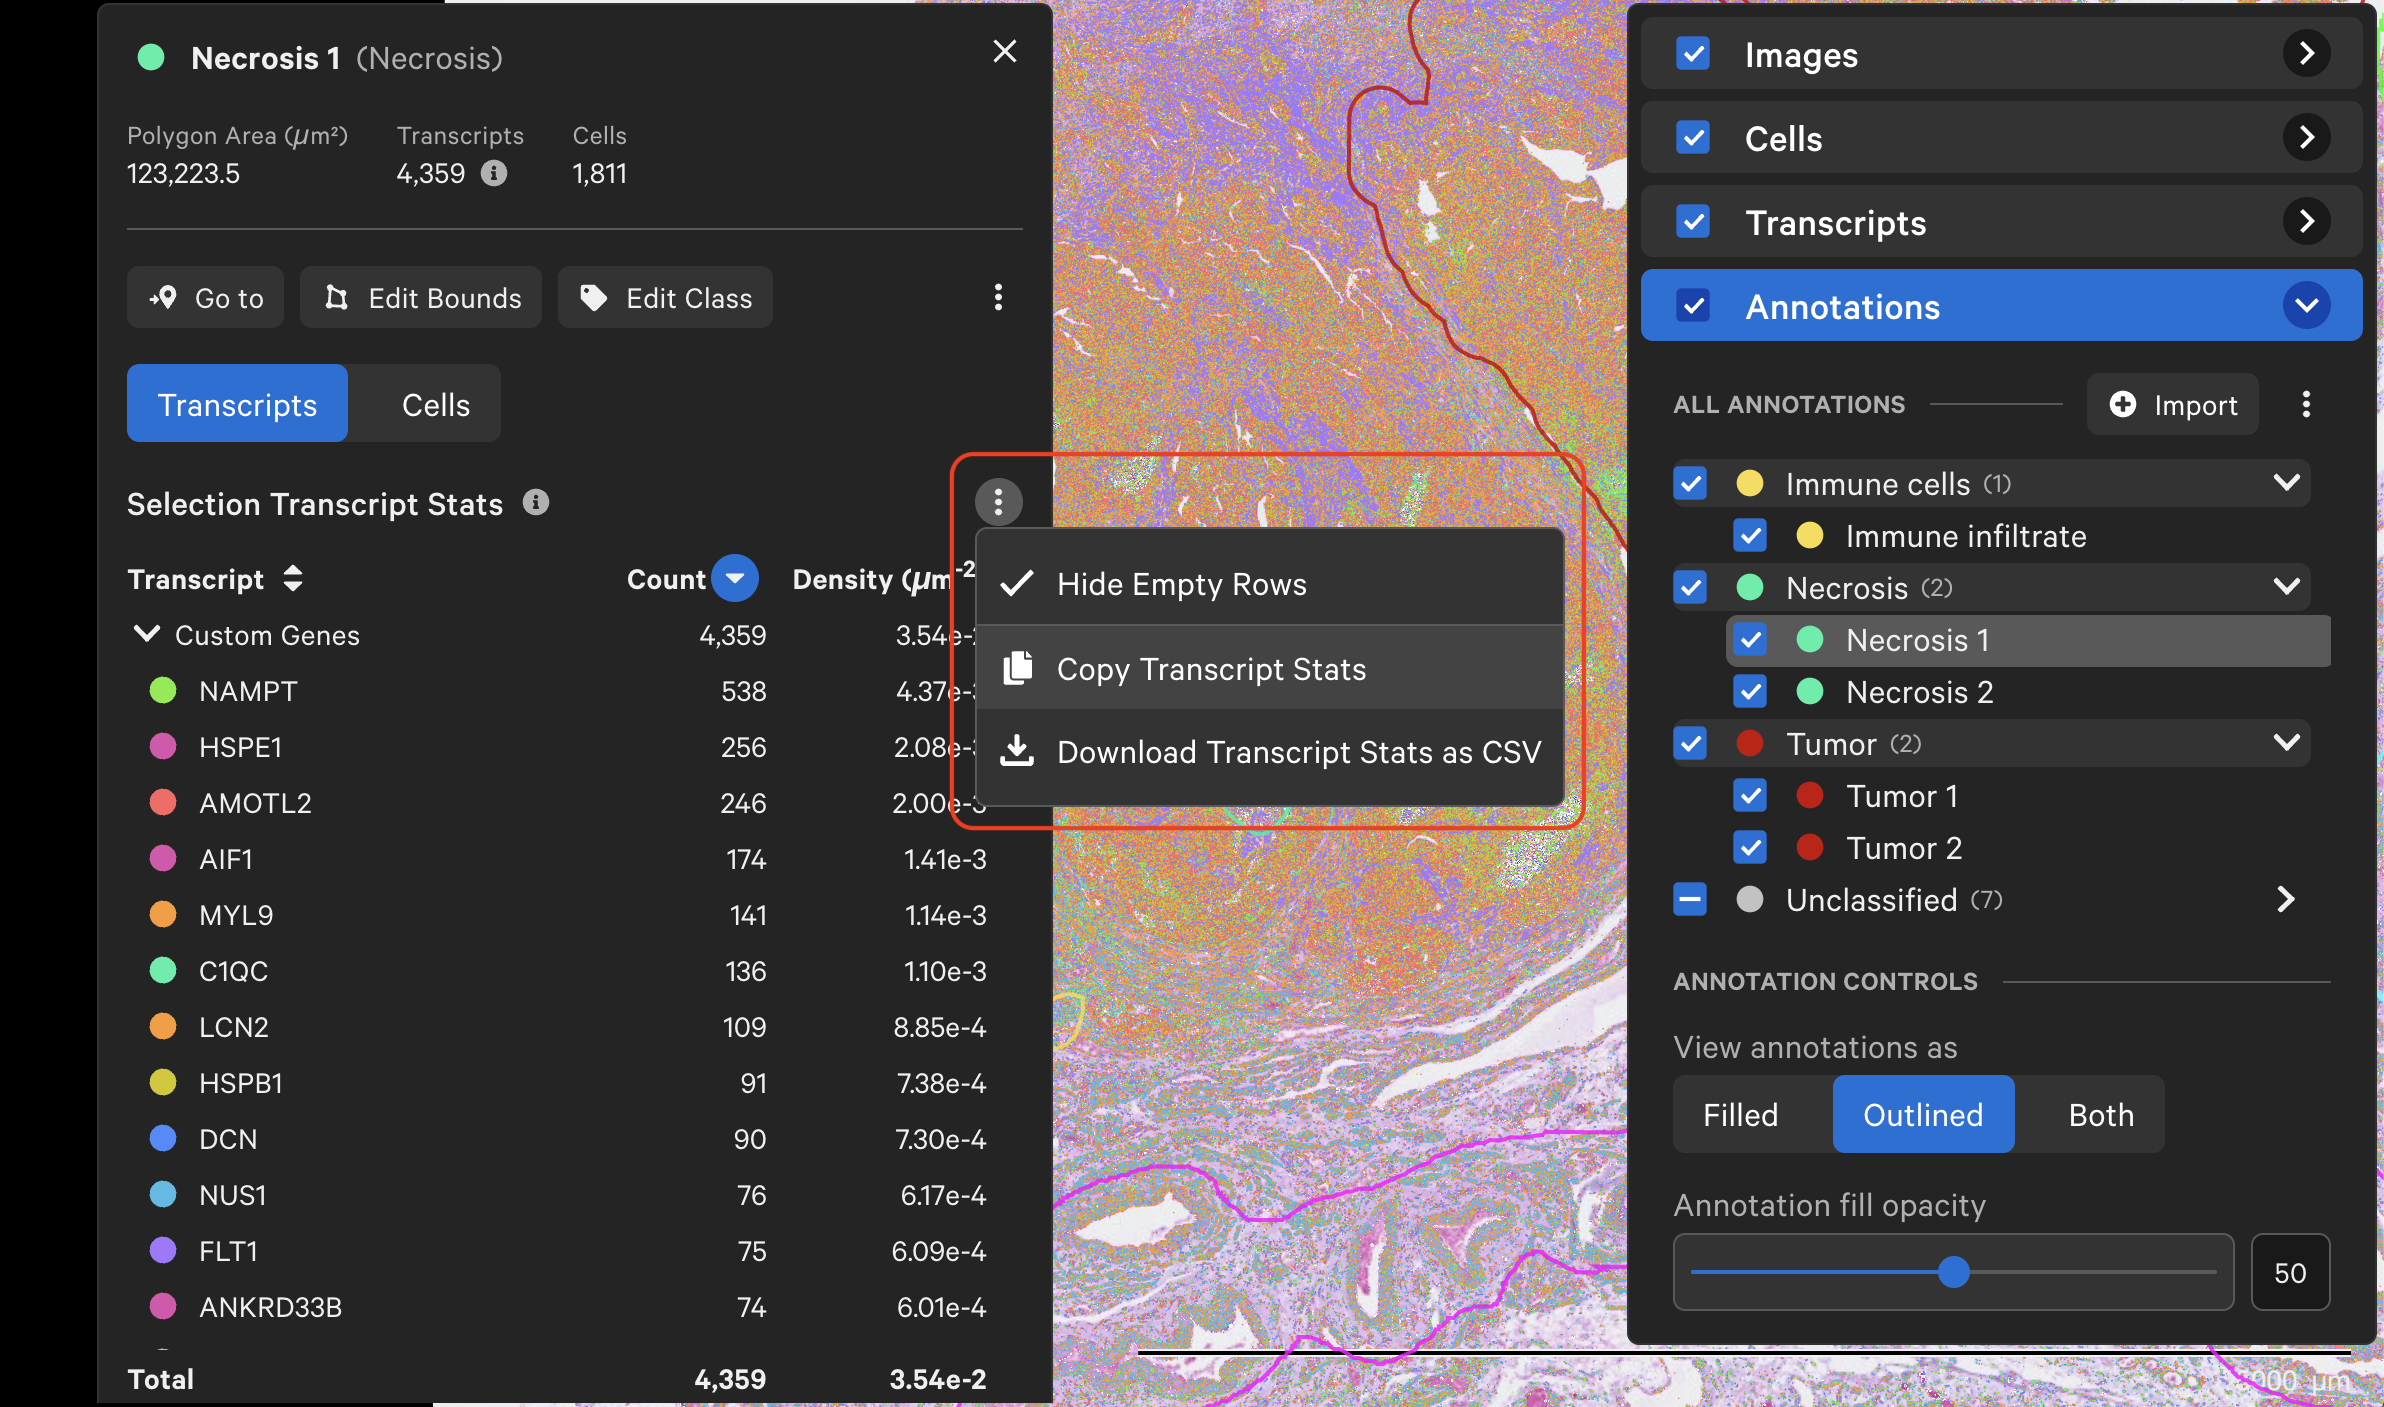
Example:
#Selection name: Selection 1
#Area (µm^2): 1071.38
#Panel genes not included: A2ML1, AAMP, AAR2, AARSD1, ABAT, ABCA1, ABCA3, ABCA4, [ … ], ZYX
Gene,Count,Density (µm^-2)
CD19,0,0
CD22,0,0
CD247,0,0
CD3E,2,0.001866745904760635
CD3G,1,0.0009333729523803175
CD5,1,0.0009333729523803175
CD79A,0,0
CD79B,7,0.006533610666662223
CR2,0,0
FCER2,0,0
FLT3LG,0,0
FOXP3,0,0
IL17A,0,0
MS4A1,0,0
PAX5,1,0.0009333729523803175
POU2AF1,0,0
TNFRSF13C,0,0
[ ... ]
Click the three vertical dots on the Cells tab to copy or download a CSV file of cell stats or cluster stats information. Cell counts by cluster type can be sorted in increasing or decreasing order in the selection pop-up.
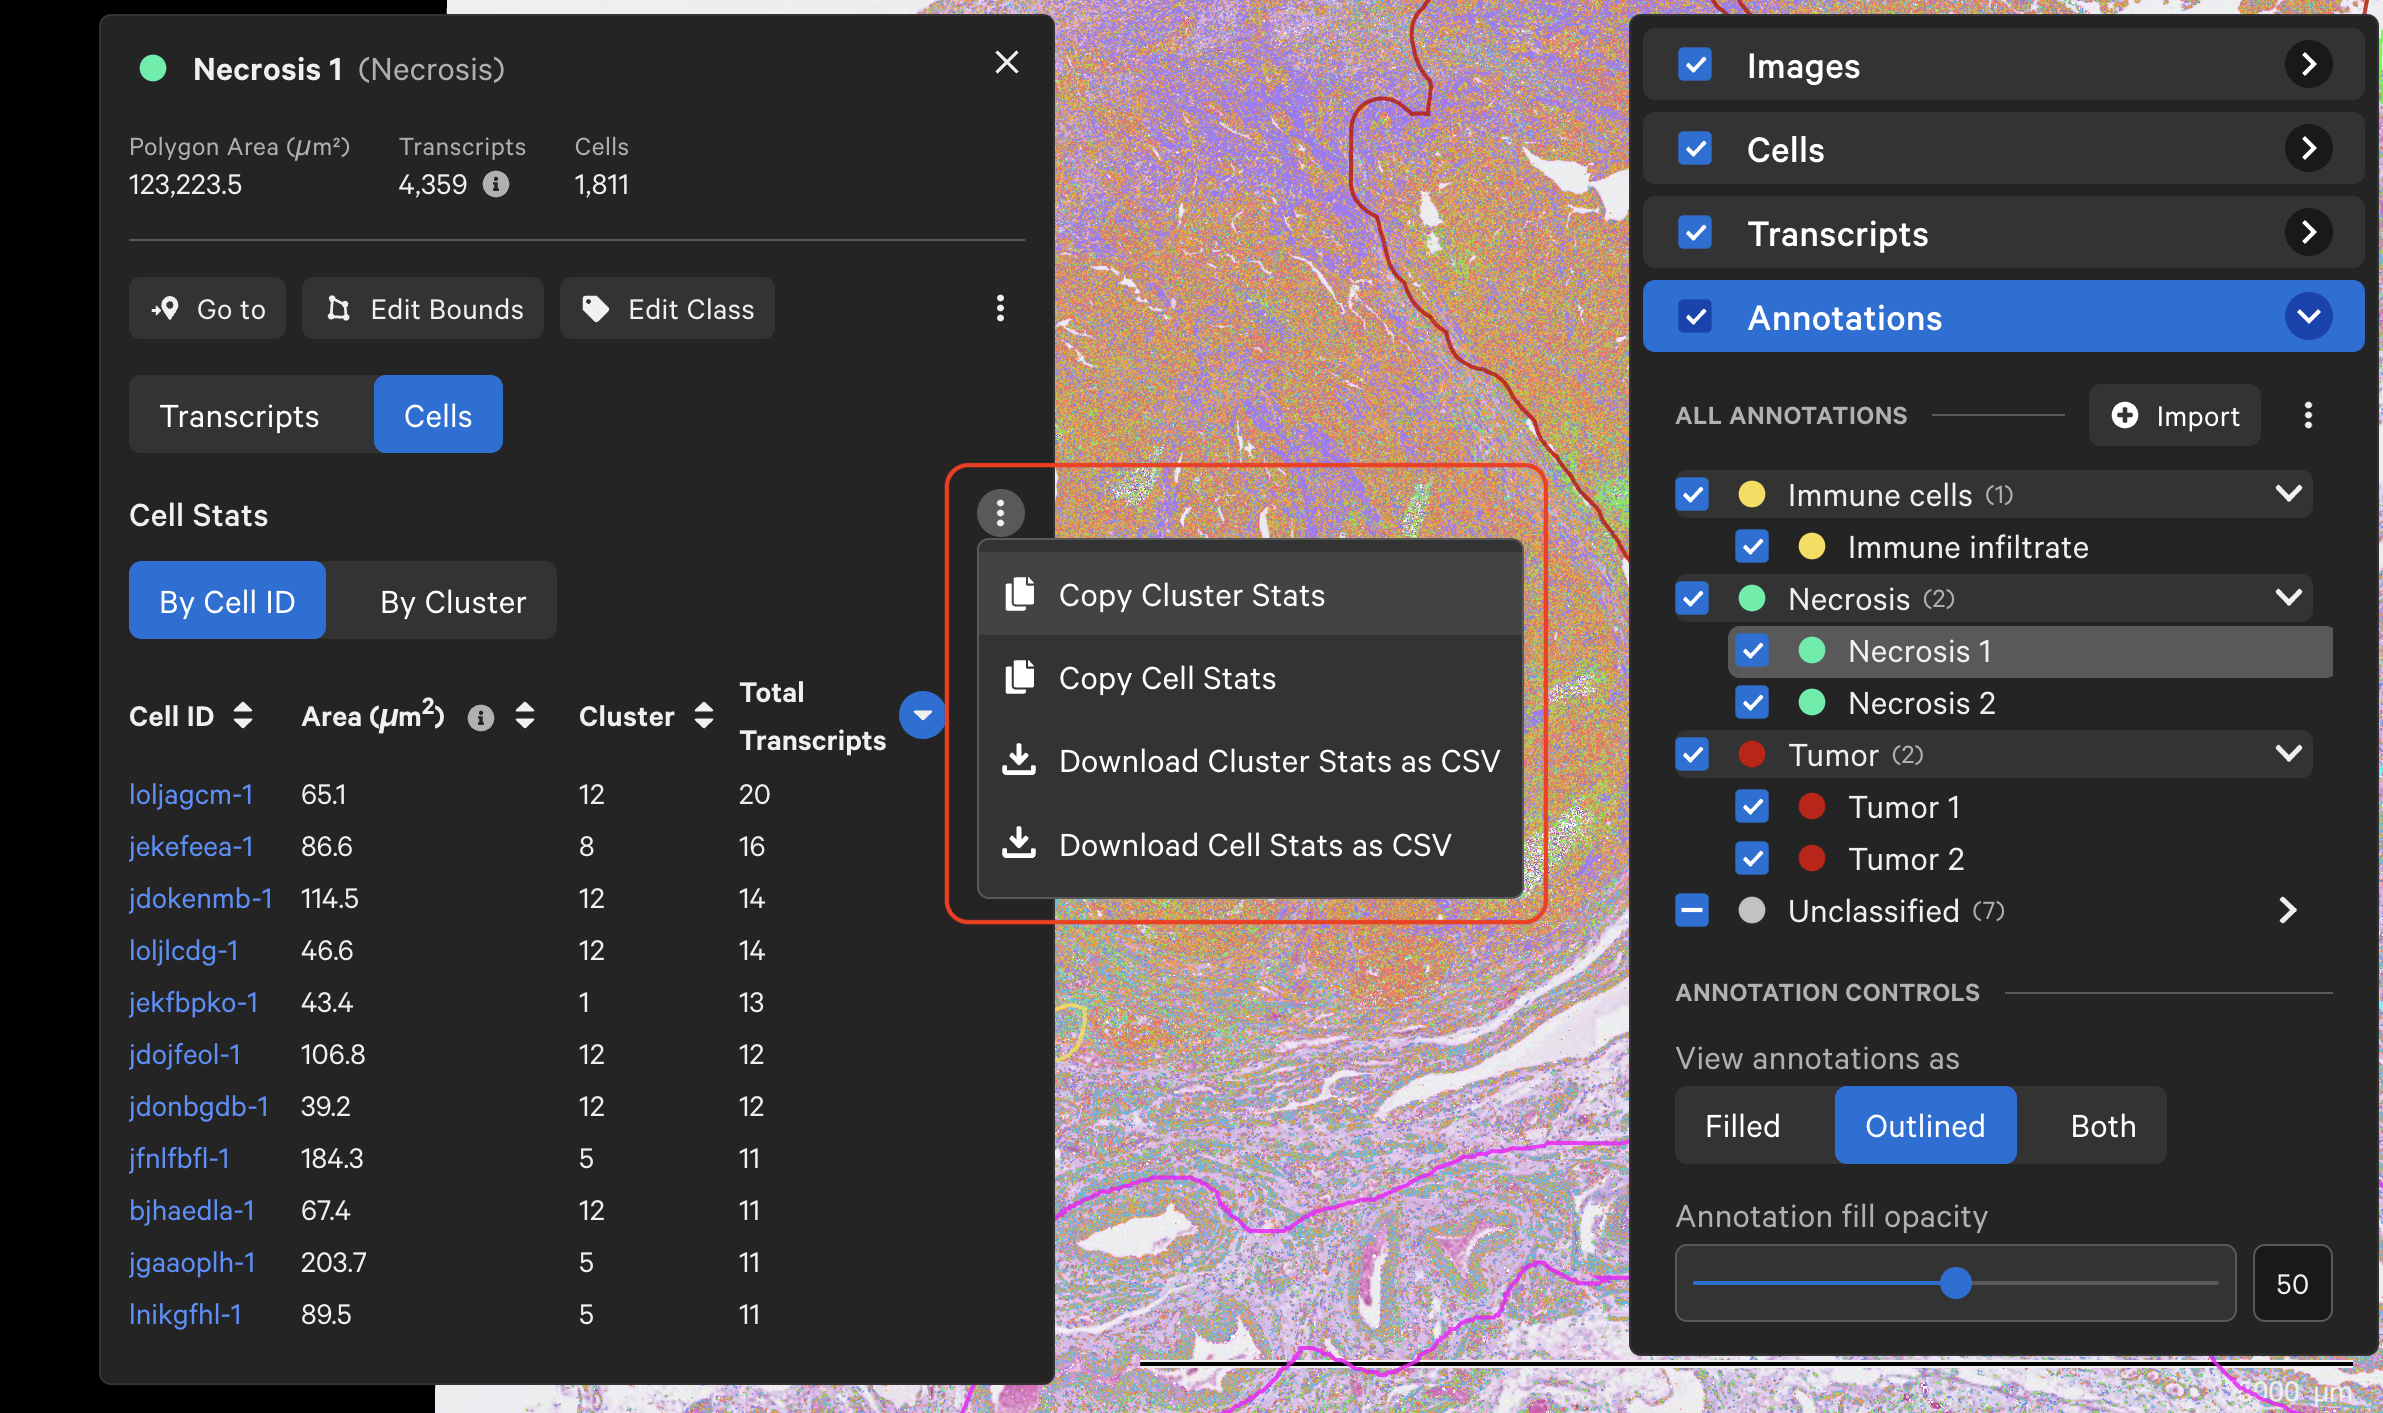
Example of cell stats:
#Selection name: Selection 1
#Area (µm^2): 1071.38
Cell ID,Cluster,Transcripts,Area (µm^2)
ohoaeeaa-1,Endothelial Cell,0,21.30
ohoaeleo-1,B Cell,0,17.55
ohoafieb-1,B Cell,0,20.92
lncfkjff-1,Endothelial Cell,1,31.34
lncflkia-1,Endothelial Cell,0,46.93
lncgfgbg-1,Endothelial Cell,0,51.01
lncgdgdn-1,Endothelial Cell,1,63.33
lncgbamb-1,Classical Monocyte,0,29.46
lncgijld-1,Macrophage,0,31.64
lncfaebi-1,Endothelial Cell,1,48.47
lncfoooi-1,Endothelial Cell,1,48.61
lncgefhj-1,Endothelial Cell,0,48.56
lncfpnek-1,Endothelial Cell,0,37.63
lncfphil-1,Endothelial Cell,1,50.76
ohoaflnk-1,B Cell,0,21.49
lncfnnfb-1,Endothelial Cell,5,28.36
[ ... ]
This option is only available for Xenium In Situ Gene and Protein Expression with Cell Segmentation Staining data.
Click the three vertical dots on the Proteins tab to copy or download a CSV file of protein stats. Protein mean intensity and protein marker name can be sorted by clicking the arrows next to the column header name. Mean intensity is derived from the mean fluorescence intensity per protein marker within cell boundaries. Protein signal outside cells is not counted.
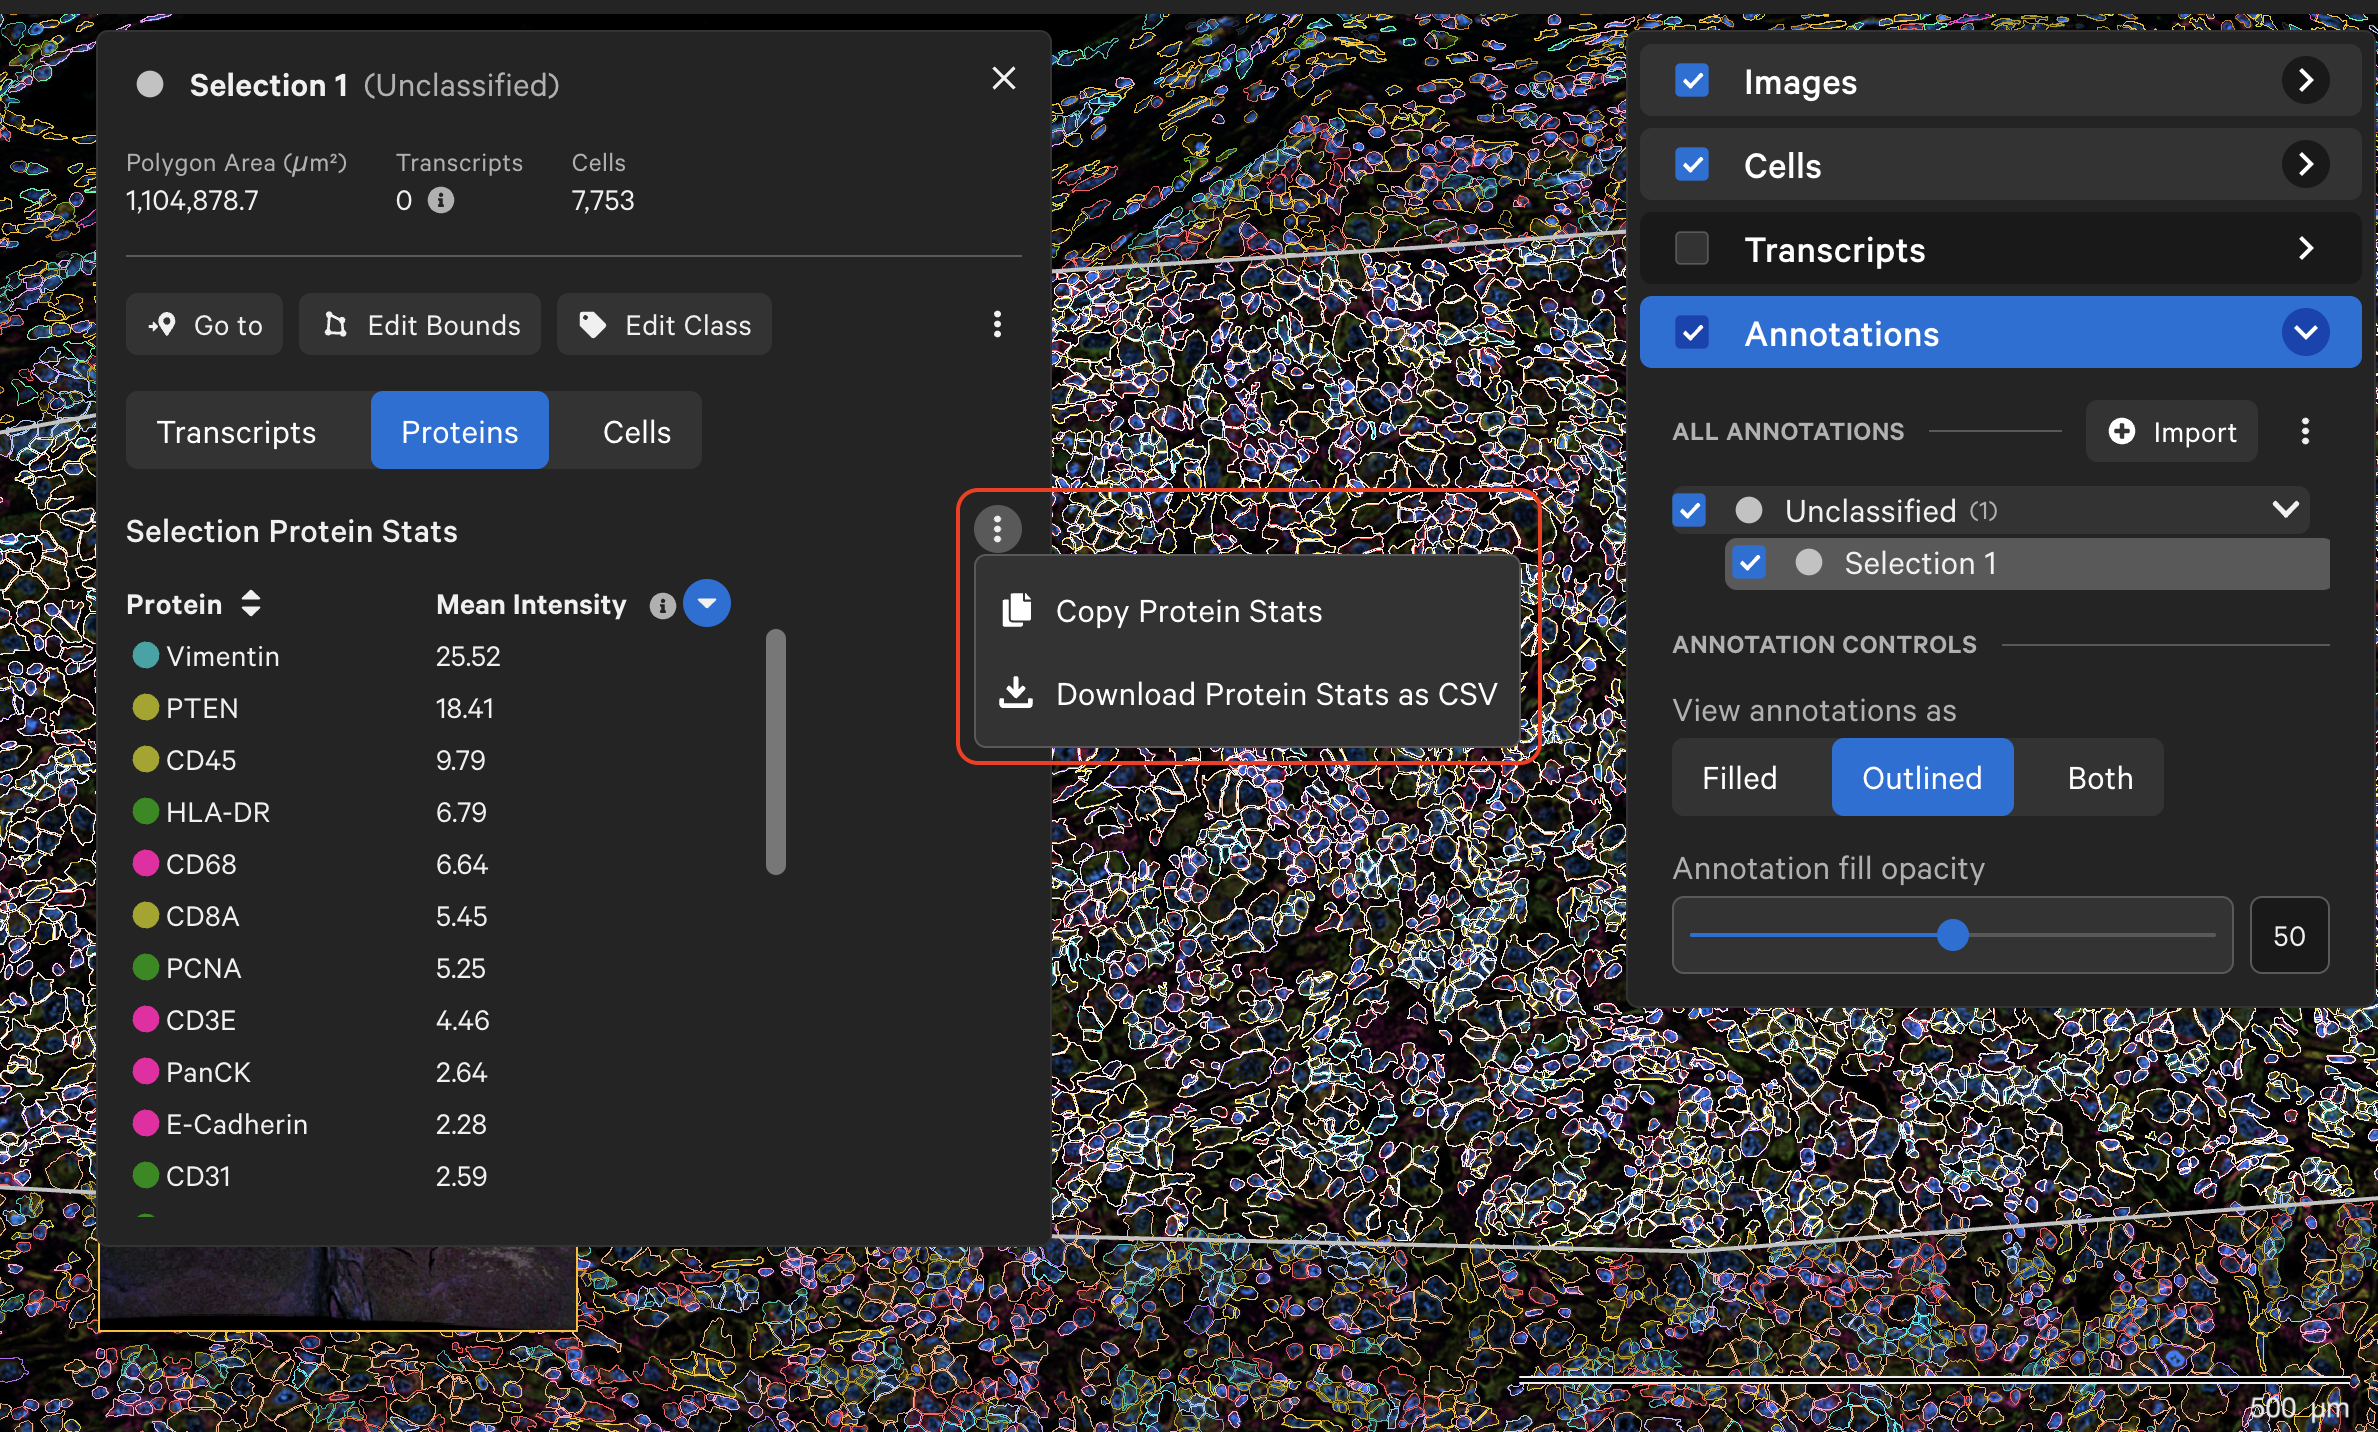
Example of protein stats:
#Selection name: Selection 1
#Area (µm^2): 1104878.72
Protein Name,Scaled Mean Intensity
Vimentin,25.52
PTEN,18.41
CD45,9.79
HLA-DR,6.79
CD68,6.64
CD8A,5.45
PCNA,5.25
CD3E,4.46
PanCK,2.64
E-Cadherin,2.28
CD31,2.59
VISTA,1.67
alphaSMA,1.89
CD16,1.15
Beta-catenin,0.45
CD45RO,0.40
CD163,0.94
LAG-3,0.89
PD-1,0.61
Ki-67,0.25
CD4,0.05
PD-L1,0.02
GranzymeB,0.01
CD45RA,0.08
CD11c,0.04
CD138,0.01
CD20,0.00
You can also copy the selection lasso shape or cell coordinates from the selection pop-up and paste with the Lasso > Paste coordinates button. The copied coordinates will not be displayed on the screen, but the selection pop-up will then re-display information for the selected region.
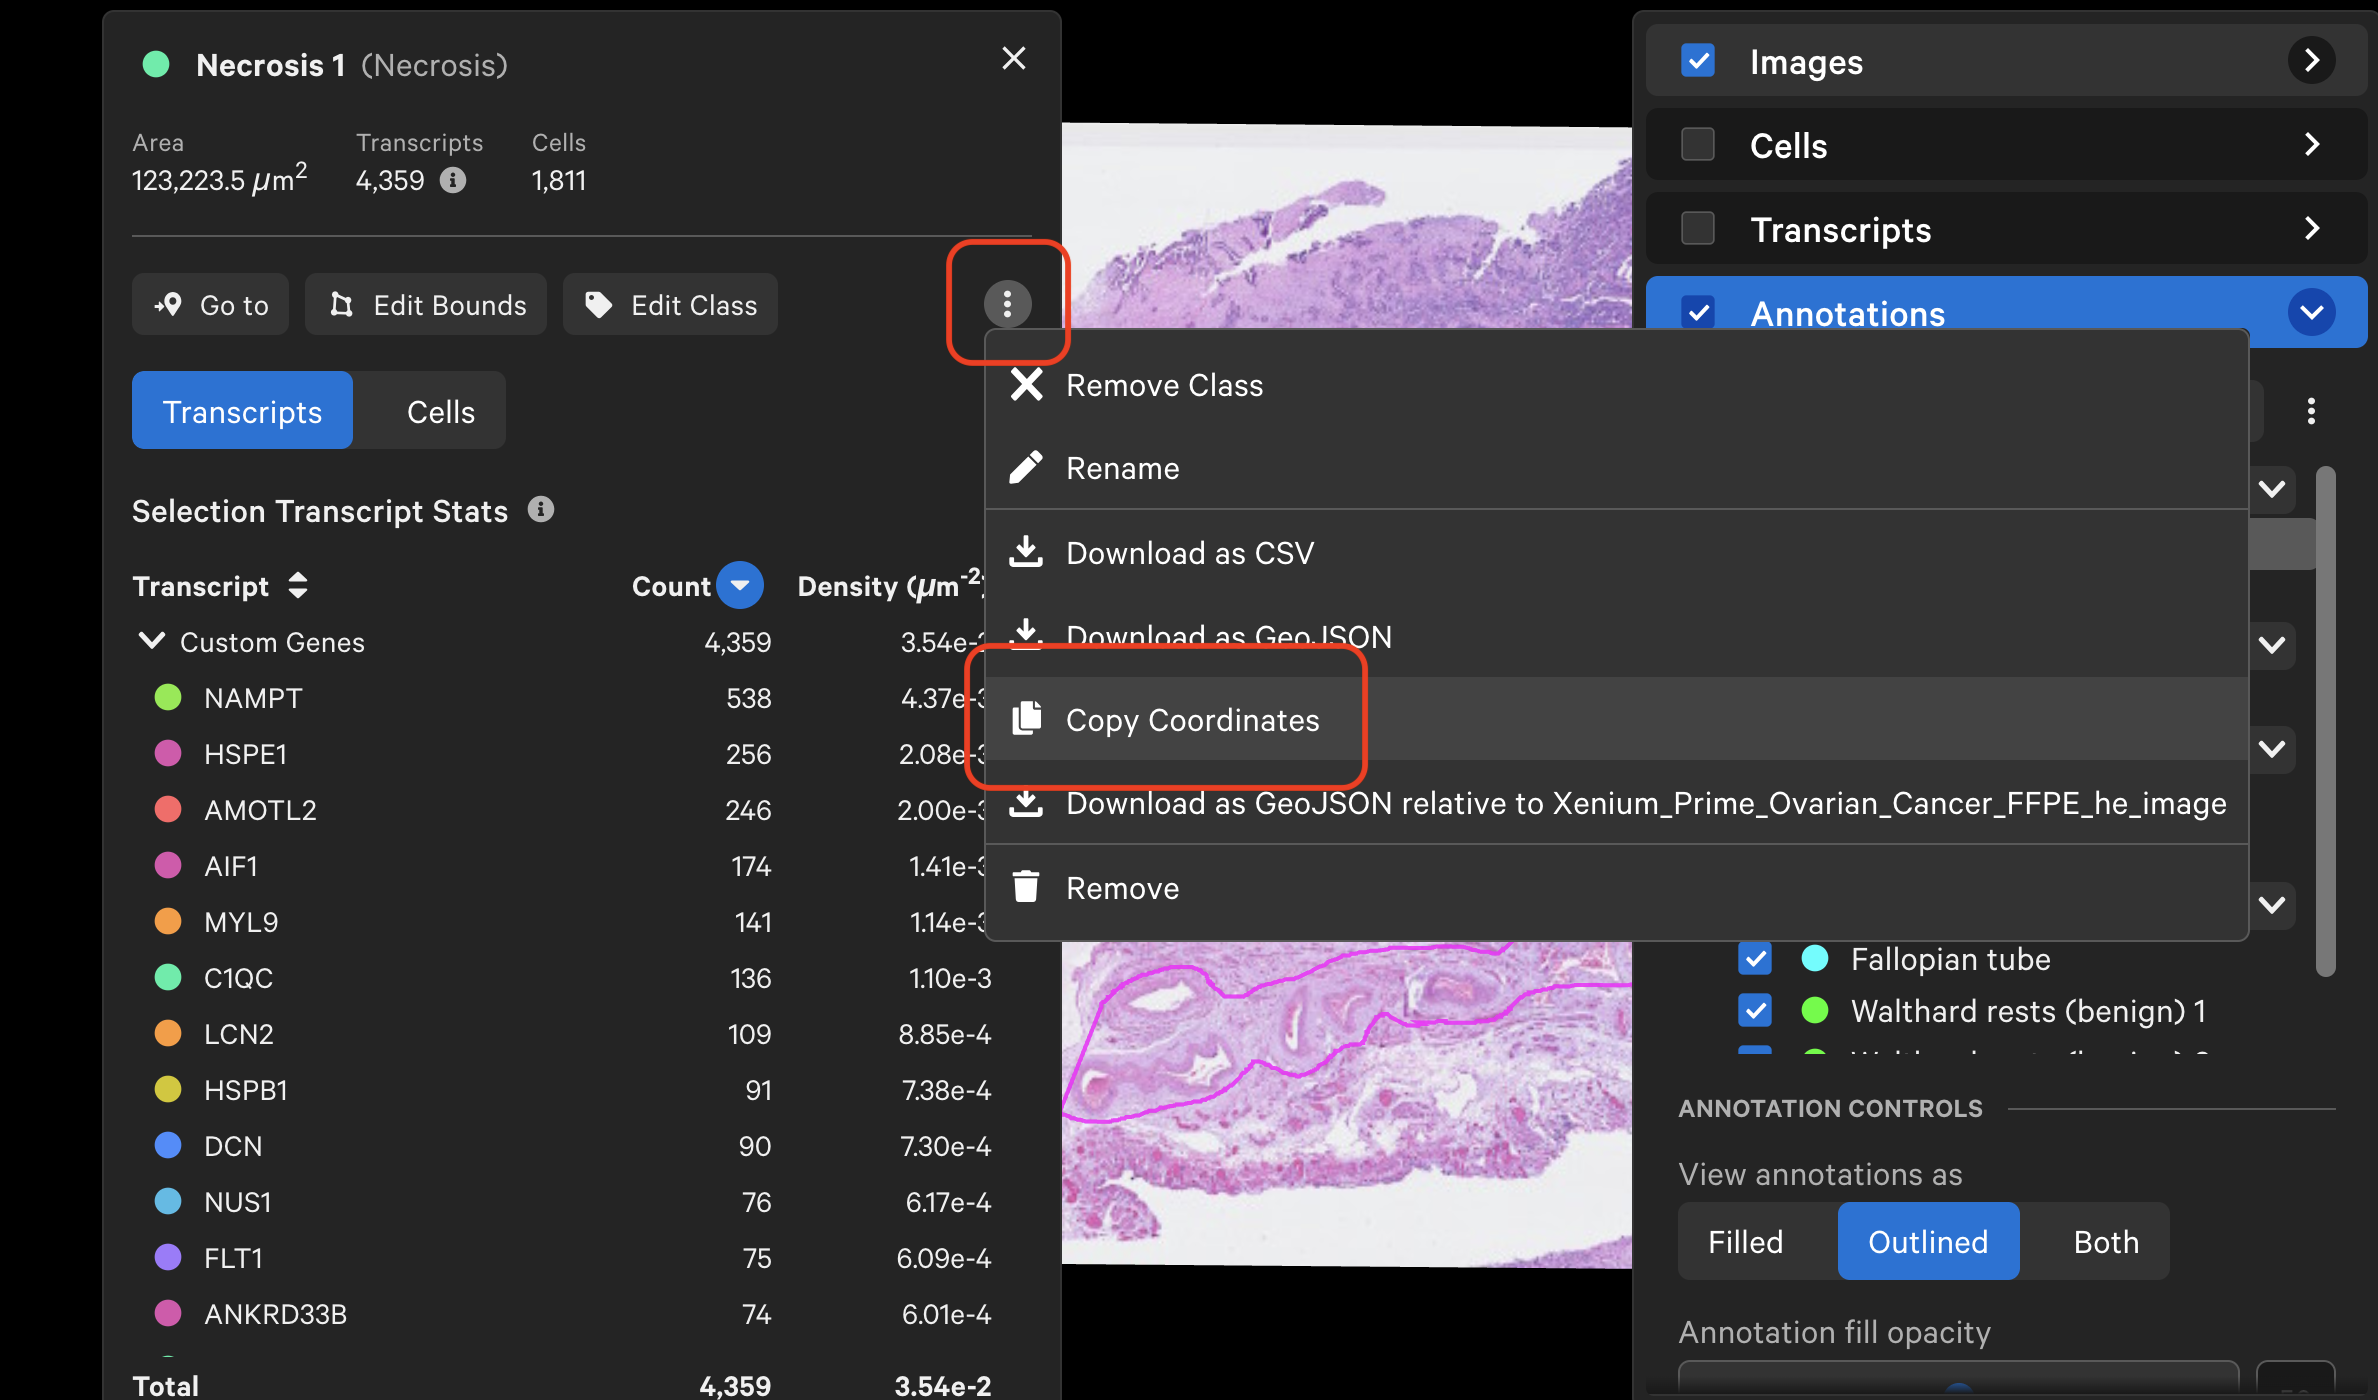
To test, you can open a new 10x Explorer window (File > New Window) and paste the selection coordinates. The first selection in this new window now displays the same ROI information that was created above (including Transcripts and Cells tab information for whichever genes and/or cell clusters are checked in their respective menus - if used, import custom gene and/or cell groups to the new window too).