Is single cell epigenomics right for me? ATAC-ing your research questions for deeper insights

Beyond the transcriptome: Why single cell epigenomics?
Long have researchers searched the transcriptome for biological insights into complex cell populations and processes. Innate sample heterogeneity and cell-to-cell differences in gene expression required that scientists move beyond averaged bulk measurements to single cell RNA-sequencing in order to develop a more accurate picture of complex biological systems. However, the transcriptome may not tell a cell's entire story, and scientists often want to understand the how establishing the what—that is, the mechanistic explanation for the changing patterns of gene expression they observe through transcriptional profiling.
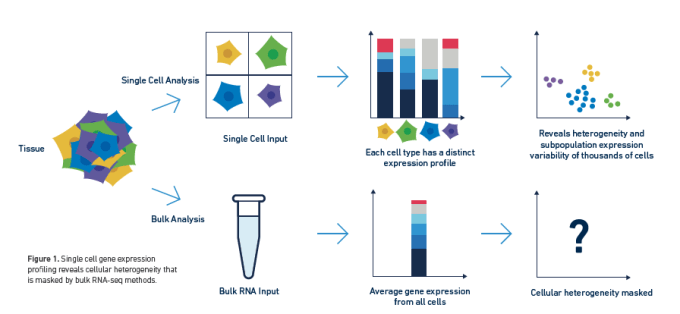
The transcriptome is ultimately the byproduct of a highly coordinated program of gene expression. This program is regulated by the epigenome, DNA and histone modifications that impact how DNA-binding proteins like transcription factors can interact with genomic DNA, leading to activation or repression of gene expression. Epigenomic regulation contributes to the complexity of biology, not only driving fascinating developmental events that enable cells with the same DNA to take on unique identities and form diverse tissue and organ types, but also driving the cellular heterogeneity that promotes complex disease biology. Understanding how this regulation works in single cells can unmask layers of biological complexity underlying the transcriptional differences between cells.
Perhaps you’re a cancer researcher, seeking to define the regulatory networks that promote and maintain cancer stem cells. Or, you want to characterize the role that regulatory elements play in T-cell activation and exhaustion after immune checkpoint blockade therapy. Perhaps therapeutic interventions are consistently ineffective in a particular cancer, and you want to investigate and refine cell-type and cell-state annotations to determine if intratumoral heterogeneity, or even a masked cellular subtype, is driving resistance, metastasis, and resurgence. No matter your particular field, if you want to dissect a complex biological system and understand how individual cells are functionally regulated in that system, single cell ATAC-seq (scATAC-seq) may be the solution for you.
From open chromatin to deep insights into gene regulation
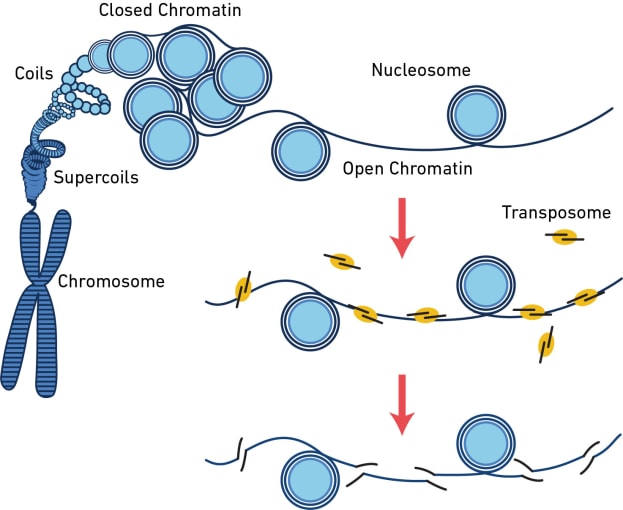
The assay for transposase-accessible chromatin (ATAC) is a sequencing method that surveys the physical structure of the genome by identifying regions of open chromatin. This technique uses a hyperactive transposase enzyme that cuts and inserts sequencing adapters into exposed DNA. The resulting sequencing library produces reads that are enriched in open chromatin regions.
But what can you learn from open chromatin? The dynamic remodeling of chromatin structure is one of the major mechanisms influencing which genes get transcribed and when. When chromatin is open, regulatory sequences are accessible to DNA-binding proteins, enabling transcription. By providing information about chromatin accessibility, scATAC-seq can reveal areas of active gene transcription in single cells. However, that’s not all it can do. Hundreds of thousands of regulatory elements work together in different contexts to orchestrate gene expression patterns, and scATAC-seq can provide information about these diverse elements, including their cell type specificity, the binding site motifs, and whether lowly expressed genes like transcription factors are likely turned on. Learn more about the way scATAC-seq can enhance your understanding of complex regulatory networks in this Application Note. Explore the following sections of this article to find out more about what you can discover from a readout of open chromatin in single cells.
Defining cell types and states with ATAC-seq
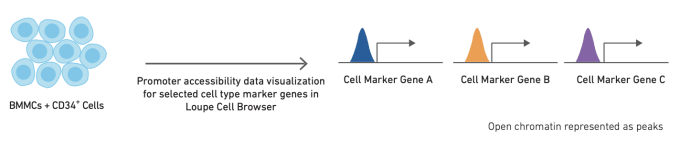
Like single cell RNA-sequencing, single cell ATAC-seq can be used to identify and cluster similar cell types and states. However, the methods used to annotate cell types are slightly different for ATAC-seq data. The simplest method for cell annotation with ATAC-seq is to consider open promoter regions as a proxy for active transcription.
Alternatively, cell types can be annotated using cell type-specific feature sets, derived from bulk ATAC data on sorted cell subsets. Finally, if single cell gene expression data is available for the same or a similar sample, annotation from scRNA-seq data can be used as a reference to refine annotation of scATAC-seq clusters. The relative performance of these different strategies, along with more detailed information about how to use them, can be found in this Technical Note.
scATAC-seq provides complementary information to single cell gene expression data and, in some cases, offers even greater resolution of cell state. In an in-depth analysis of the immune checkpoint regulator VISTA, a study that combined single cell gene expression, T-cell receptor (TCR) profiling, and Single Cell ATAC analysis, researchers found that loss of VISTA led to an expansion of memory-like T cells at the expense of quiescent cells. Further, ATAC-seq data indicated that the memory-like T-cell cluster had increased accessibility for TCR effector genes, suggesting these cells were primed to be particularly TCR-responsive. Find out more about how integrating scRNA-seq and scATAC-seq provided powerful multiomic resolution to study immune checkpoint regulation in this blog post or this Research Snapshot.
And for more information about integrating single cell ATAC-seq data with other data types, including single cell transcriptomic data, watch this webinar by Dr. Rahul Satija, Core Faculty Member at the New York Genome Center. Find answers to common questions about integrating scRNA-seq and scATAC-seq data in this blog.
Inferring developmental trajectories and identifying regulatory elements
scATAC-seq also enables the computational inference of developmental trajectories. Changes to chromatin accessibility are a key driving feature of cell differentiation and development. In order to change cell state (or cell type), a cell must first prepare to alter its transcriptional program, and scATAC-seq provides a readout of these preparations. Identifying developmental trajectories takes advantage of the fact that, just as cells with similar transcriptional programs are likely related, cells with similar open chromatin profiles can be grouped together.
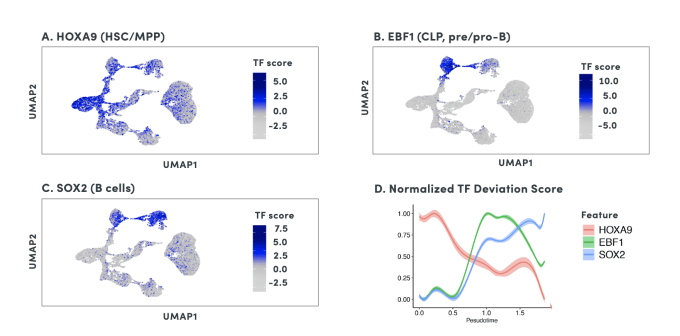
By organizing individual cells in a numerical sequence based on these relationships, researchers can determine the temporal order of cells in a differentiation process. To show how developmental trajectories can be inferred, scientists at 10x Genomics performed scATAC-seq on almost 20,000 bone marrow mononuclear cells and sorted CD34+cells. This Application Note describes how they were able to infer developmental trajectories spanning stem cells to B cells, monocytes, and erythroid cells. Armed with a developmental trajectory, scATAC-seq data then allows you to go one step further and identify transcription factor motifs and enhancers that vary across, and may dictate, differentiation states.
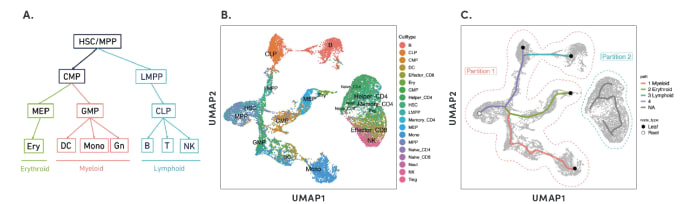
Researchers from Stanford University demonstrated an important use case of the ability to construct developmental trajectories with single cell ATAC data in their study of mixed-phenotype acute leukemia (MPAL). This cancer is composed of cells that represent multiple hematopoietic lineages. In addition, cancer cells from a patient sample may show marker genes associated with both lymphoid and myeloid cells, resulting in ambiguity about their cell type. In order to clarify the true cellular phenotype and developmental origin of these cancer cells, the team of researchers made a reference map of the developmental trajectories of healthy human blood, leveraging oligonucleotide-coupled antibodies to study surface proteins, scRNA-seq to study gene expression, and scATAC-seq to study chromatin accessibility. They then projected the cellular phenotypes of the cancerous MPAL cells onto this reference map, categorizing them first as “healthy-like” or “disease-like” and further by most related developmental state, including progenitor-like, erythroid-like, lymphoid-like, myeloid-like, and T/natural killer-like (1).
You can learn more about this study by watching an on-demand webinar from corresponding author Dr. William Greenleaf, of Stanford University. Watch here →
Discovering gene regulatory networks
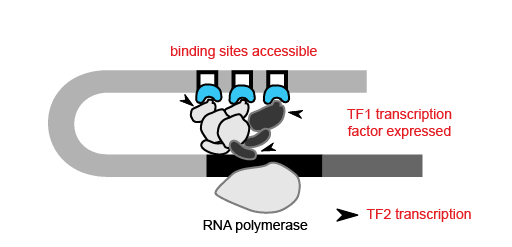
With the ability to map regions of open chromatin, researchers can also begin to understand the flow of information within a cell. Where transcription factors bind and which genes they turn on or off depends on both the presence of a binding site in the DNA and whether that binding site is accessible. Therefore, the activity of a transcription factor gene, revealed by scRNA-seq or inferred from scATAC-seq, and the accessibility of its target gene binding site, discernible only by epigenetic methods, are both important contributors to cell type-specific networks. For example, in order for transcription factor 1 (TF1) to regulate TF2 in a specific cell type, the TF1 gene needs to be active in that cell type and the TF1 binding site at the TF2 gene needs to be accessible.
Using scATAC-seq data, the expression of transcription factors in a given cell can be inferred from gene activity scores based on open chromatin of cis-regulatory elements. Accessibility of putative transcription factor binding sites can then complement inferred transcription factor expression data to build cell type-specific gene regulatory networks. Referencing the previous study of mixed-phenotype acute leukemia, researchers from Stanford leveraged this same approach with their scATAC-seq data to correlate promoter accessibility with target gene expression, identifying a disease-specific network that regulates leukemia genes (1). Importantly, transcription factor activity and these broader regulatory networks can be tracked across cell lineages and developmental states, which would be challenging with scRNA-seq alone.
For more details on how to build gene regulatory networks using scATAC-seq, turn to this Application Note.
Getting started with single cell ATAC-seq
Epigenetic data like that provided by ATAC-seq may seem daunting at first. Rather than counting transcripts, you’re looking directly at DNA sequence fragments. However, with the help of tools like Loupe Browser, the insights gained from a global view of chromatin accessibility at single cell resolution can deepen your biological understanding of a complex system from simply knowing that a gene has turned on to understanding how it has been activated.
Looking for a basic introduction to ATAC-seq? Get started with this webinar introducing Chromium Single Cell ATAC. Or, explore ATAC-seq in more detail on our product page.
References
- J Granja et al., Single-cell multiomic analysis identifies regulatory programs in mixed-phenotype acute leukemia. Nat Biotechnol. 37, 12 (2019).