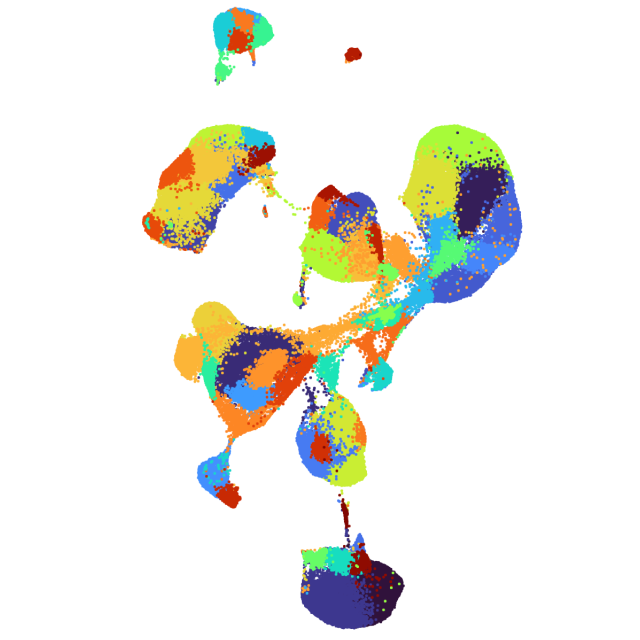
20k T-PLL cells, sorted, 5' HT v2.0
Universal 5' dataset analyzed using Cell Ranger 6.1.0

Learn about Chromium analysis
Bone marrow cells from a patient with T cell prolymphocytic leukemia (T-PLL) were obtained from Discovery Life Sciences. Cells were labeled with a panel of 29 dCODE™ Dextramer® reagents (Immudex) and TotalSeq™-C Human Universal Cocktail, v1.0 (BioLegend) following Cell Labeling with Dextramer Reagents for Single Cell RNA Sequencing Protocols (CG000203). Dextramer reagent+ T-cells were enriched via FACS.
Cells were sorted for dextramer positive T cells. Gene Expression, Cell Surface Protein/Immune Receptor Mapping, and TCR Amplified libraries were generated from ~132,000 cells (67,148 cells recovered) across 4 channels as described in the Chromium Next GEM Single Cell 5' HT Reagent Kits v2 User Guide with Feature Barcode technology for Cell Surface Protein and Immune Receptor Mapping (CG000424 RevA) using the Chromium X. Libraries were sequenced on an Illumina NovaSeq 6000 to a read depth of approximately 40,000 mean reads per cell for Gene expression, 13,000 mean reads per cell for TCR Amplified, and 6,000 mean reads per cell for Cell Surface Protein/Immune Receptor Mapping libraries.
Paired-end, dual indexing Read 1: 26 cycles (16 bp barcode, 10 bp UMI) i5 index: 10 cycles (sample index) i7 index: 10 cycles (sample index) Read 2: 90 cycles (transcript)
Analysis Parameters Used: Run with --expect-cells=20000.
FASTQ files: Due to the large size of the data, the raw FASTQ data will not be available directly from our website. Users can pay to download the raw FASTQ data from Amazon S3 at their cost. The instructions to download the FASTQs are here.
This dataset is licensed under the Creative Commons Attribution 4.0 International (CC BY 4.0) license. 10x citation guidelines available here.
