Whole Mouse Pup Preview Data (Xenium Mouse Tissue Atlassing Panel)
In Situ Gene Expression dataset analyzed using Xenium Onboard Analysis 1.6.0
Learn about Xenium Analysis
Overview
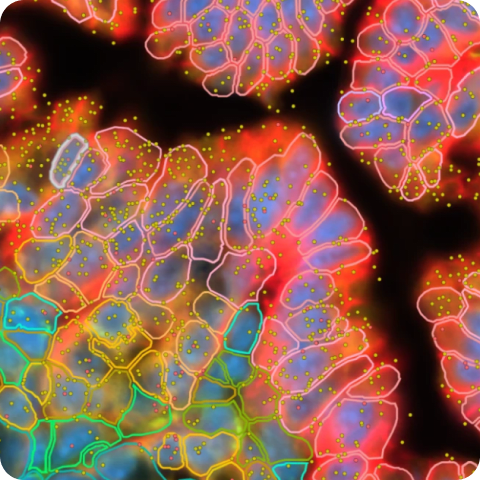
Xenium In Situ preview data generated using the Mouse Tissue Atlassing panel on a one day old mouse pup. Here are some suggested starting points for data exploration:
- Brain: Gfap (astrocytes)
- Kidney: Lrp2 (proximal convoluted tubule epithelial cell)
- Pancreas: Tm4sf4, Dcdc2a (pancreatic ductal cells)
- Liver: Clec4f, Folr2 (Kupffer cell)
- Lung: Mfap4, Sod3 (fibroblasts)
- Heart: Pln, Trdnepi (cardiac muscle cells)
- Skin: Dsc3, Sbsn (epidermal cells)
- Colon: Cdhr5, Rbp2 (enterocytes of epithelium)
- Thymus: Arpp21, Cd8a (thymocytes)
Biomaterials
A formalin fixed & paraffin embedded (FFPE) mouse pup (one day old, C57BL/6 strain) was obtained from AcePix Biosciences. A sagittal section of 5 µm was sampled for the dataset.
Tissue preparation
Tissues were prepared following the Xenium In Situ for FFPE - Tissue Preparation Handbook (CG000578).
Gene panels
The Xenium Mouse Tissue Atlassing Panel (379 genes) was pre-designed by 10x Genomics. The panel design was informed by reference data from CZ Biohub San Francisco and The Tabula Muris Consortium and has been validated in the whole mouse pup and in nine adult tissues (liver, lung, heart, skin, kidney, spleen, colon, brain, thymus).
Xenium Analyzer
The instrument run was performed following the Xenium Analyzer User Guide (CG000584). The on-instrument analysis was run with instrument software v1.5.0 and Xenium Onboard Analysis v1.6.0.
| Metric | Sample |
|---|---|
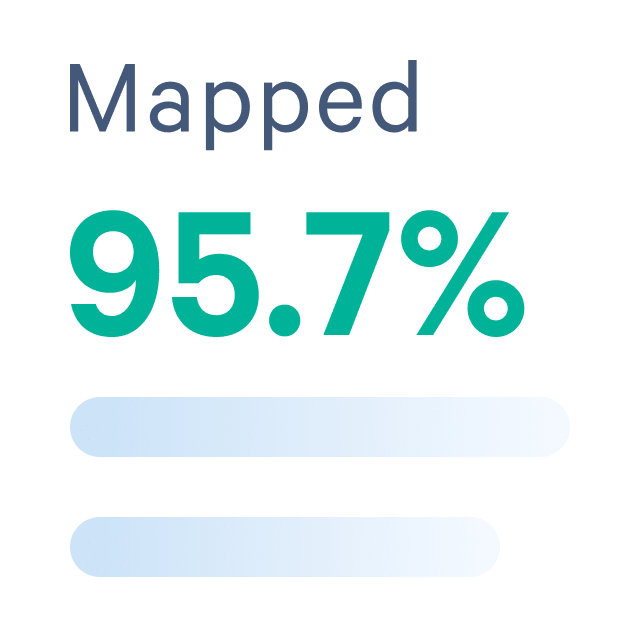
| Median transcripts per cell | 113 |
| Cells detected | 1,355,849 |
| Decoded transcripts per 100 µm² | 130.6 |
| High quality transcripts detected | 191,407,876 |
| Region area (µm²) | 191,677,376 |
How to view data
Interactively explore data with Xenium Explorer by downloading the Xenium Output Bundle (or Xenium Explorer subset) file. The subset bundle contains the experiment.xenium, morphology_mip.ome.tif, analysis_summary.html, cells.zarr.zip, cell_feature_matrix.zarr.zip, transcripts.zarr.zip, and analysis.zarr.zip files. See the Getting Started with Xenium Explorer page for more details.
This dataset is licensed under the Creative Commons Attribution 4.0 International (CC BY 4.0) license. 10x citation guidelines available here.