Xenium Human Lung Preview Data
In Situ Gene Expression dataset analyzed using Xenium Onboard Analysis 1.3.0

Learn about Xenium Analysis
Overview
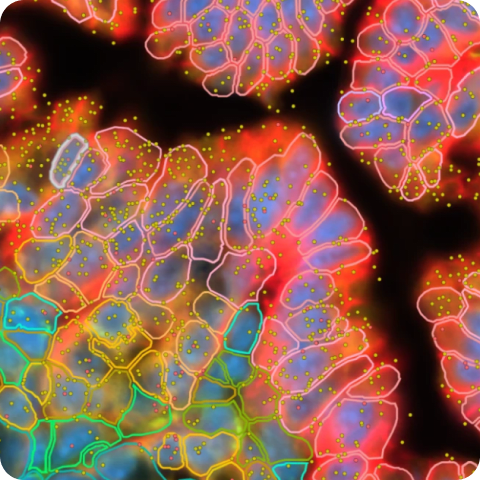
Preview of Xenium In Situ Gene Expression data for adult human lung sections, using a development version of the Human Lung Gene Expression Panel and custom add-on panel for lung cell types.
Biomaterials
Two lung sections were used:
- Adult human healthy lung section (from Avaden Biosciences)
- Adult human lung with Invasive AdenoCarcinoma (from Avaden Biosciences)
Tissue preparation
The healthy lung section was placed on one slide and the Invasive AdenoCarcinoma lung sample was placed on the second slide. Tissues were prepared following the Xenium In Situ for FFPE - Tissue Preparation Handbook (CG000578).
Gene panels
The Xenium Human Lung Gene Expression Panel was pre-designed by 10x Genomics to identify cells in healthy, cancer, and fibrotic lung, including epithelial, stromal, endothelial, secretory, immune, and tumor cells. The base panel was used with an additional 100 genes specific to lung cell types for both sections. Base panels were combined with add-on panels into a single JSON file for each run, and uploaded to the Xenium Analyzer instrument using a USB.
Xenium Analyzer
The instrument run was performed following the Xenium Analyzer User Guide CG000584. The on-instrument analysis was run with Xenium Onboard Analysis version 1.3.0.
| Metric | Non-diseased | Cancer |
|---|---|---|
| Median transcripts per cell | 71 | 105 |
| Cells detected | 295,883 | 531,165 |
| Decoded transcripts per 100 µm² | 40.9 | 68.0 |
| High quality transcripts detected | 23,994,997 | 67,334,982 |
| Region area (µm²) | 100,554,810 | 117,594,680 |
How to view data
Select a tab at the top of the page to view outputs for each section. Interactively explore data with Xenium Explorer by downloading the Xenium Output Bundle file. See the Getting Started with Xenium Explorer page for more details.
This dataset is licensed under the Creative Commons Attribution 4.0 International (CC BY 4.0) license. 10x citation guidelines available here.