Xenium In Situ Analysis of Alzheimer's Disease Mouse Model Brain Coronal Sections from One Hemisphere Over a Time Course
In Situ Gene Expression dataset analyzed using Xenium Onboard Analysis 1.4.0

Learn about Xenium Analysis
Overview
This dataset is provided as part of the Application Note: Exploring Alzheimer's-like pathology at subcellular resolution using Xenium In Situ (LIT000210).
Biomaterials
Formalin fixed & paraffin embedded (FFPE) tissue samples from three wild-type (WT) and three CRND8 APP-overexpressing (TgCRND8) transgenic male mouse brains (total of six mice) were used. From each mouse, one brain hemisphere was included. Three time points were selected (2.5, 5.7, and 13.2 months of age for the WT mice, and 2.5, 5.7, and 17.9 months of age for TgCRND8 mice). For transgenic mice, the time points represent different pathological progression stages (mild, moderate, and advanced Aβ deposition).
Tissue preparation
Sections of 5 µm were prepared according to the Xenium In Situ for FFPE – Tissue Preparation Guide for Xenium FFPE Demonstrated Protocol (CG000578) and placed on Xenium prototype slides and cassettes. Four sections were placed on each slide.
Tissue Deparaffinization & Decrosslinking were performed according to the Xenium In Situ for FFPE - Deparaffinization & Decrosslinking Demonstrated Protocol (CG000580) and gene expression preparation followed the Xenium In Situ Gene Expression - Probe Hybridization, Ligation, & Amplification User Guide (CG000582).
Gene panels
The Xenium Mouse Brain Gene Expression Panel (248 genes, one of which was removed in final validation) was pre-designed by 10x Genomics. An add-on custom panel (99 genes) targeting activated microglia, astrocytes, and plaque-inducible genes supplemented the base panel.
Xenium Analyzer
The run was performed on a prototype Xenium Analyzer instrument. The on-instrument analysis was run with Xenium Onboard Analysis v1.4.0.
Staining & imaging
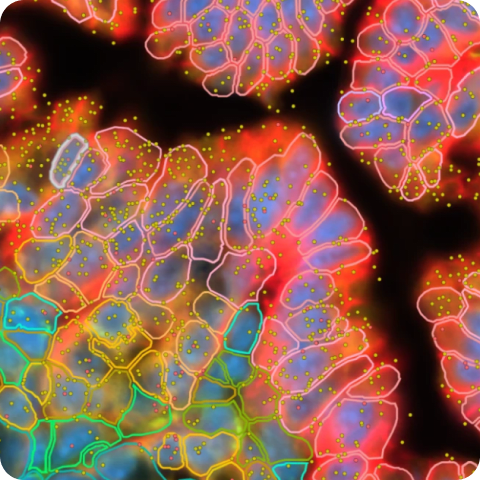
Immunofluorescence (IF) staining for amyloid beta plaques and DAPI were performed on the same tissue sections after the Xenium workflow, using the following:
- Primary antibody: anti-ABeta 6E10, Biolegend, catalog# 803001 (1:100 dilution)
- Secondary antibody: Anti-mouse IgG - Alexa Fluor 750, Invitrogen, catalog# A-21037 (1:200 dilution)
Imaging was performed on a slide scanner Olympus Slideview VS200 at 20x magnification. Images were visualized and polygons around plaques were determined using the open source QuPath software. IF images were registered to Xenium morphology images and polygon coordinates were transformed to enable downstream visualization in an internal build of Xenium Explorer.
How to view data
Select a tab at the top of the page to view outputs for each section. Interactively explore data with Xenium Explorer by downloading the Xenium Output Bundle file. See the Getting Started with Xenium Explorer page for more details. Follow these instructions to align the post-Xenium IF image in Xenium Explorer.
This dataset is licensed under the Creative Commons Attribution 4.0 International (CC BY 4.0) license. 10x citation guidelines available here.