Note: 10x Genomics does not provide support for community-developed tools and makes no guarantees regarding their function or performance. Please contact tool developers with any questions. If you have feedback about Analysis Guides, please email analysis-guides@10xgenomics.com.
This tutorial uses the 10x Genomics Cloud Analysis platform to perform raw data processing for a set of human PBMCs with the intent to explore neutrophil maturation. The goals are to demonstrate the following:
- Analysis begins with design: the goals of the experiment will determine how the data should be processed and analyzed.
- Signing in and creating a project
- Using the web based FASTQ uploader
- Creating a new analysis
- Downloading output files
Note: these instructions are preforming double duty as a stand alone resource and a workshop module. Workshop participants should have already created accounts and sent us their email addresses, so we can transfer a completed project to them prior to the workshop. This completed project will get around having to upload a full-sized set of FASTQs during the workshop.
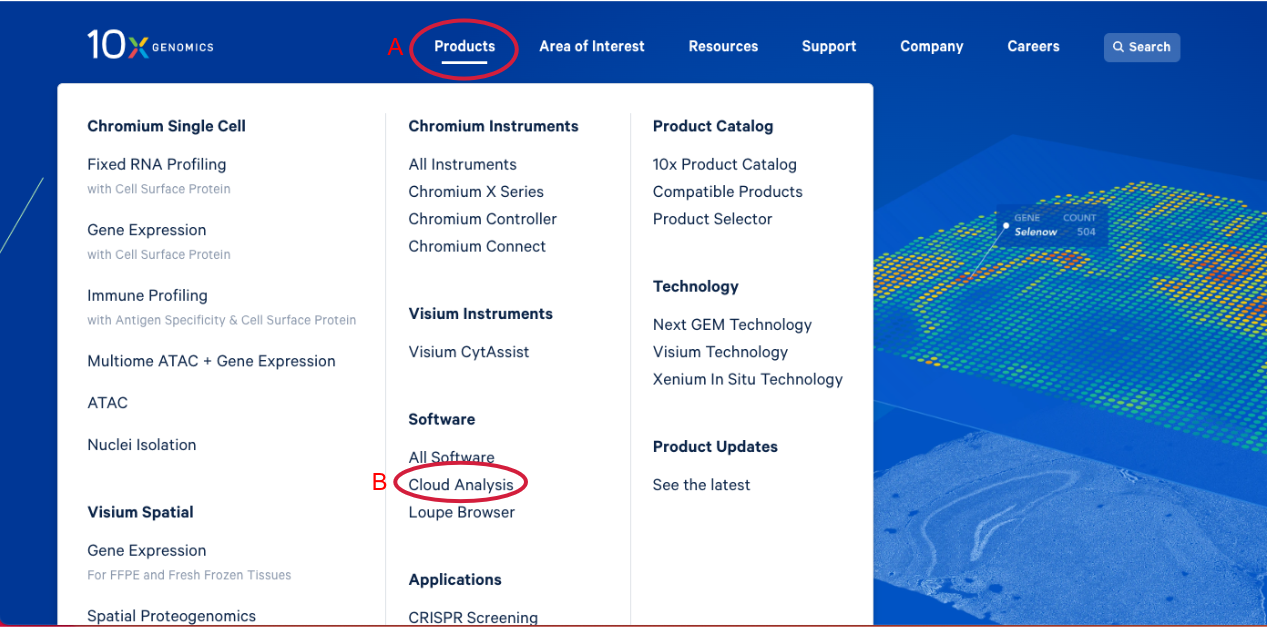
1.1. Navigate to the 10x Genomics Cloud Analysis webpage, by going to 10x Genomics.com. Hover over the "Products" tab (A in the Figure below). Click on "Cloud Analysis" (B).
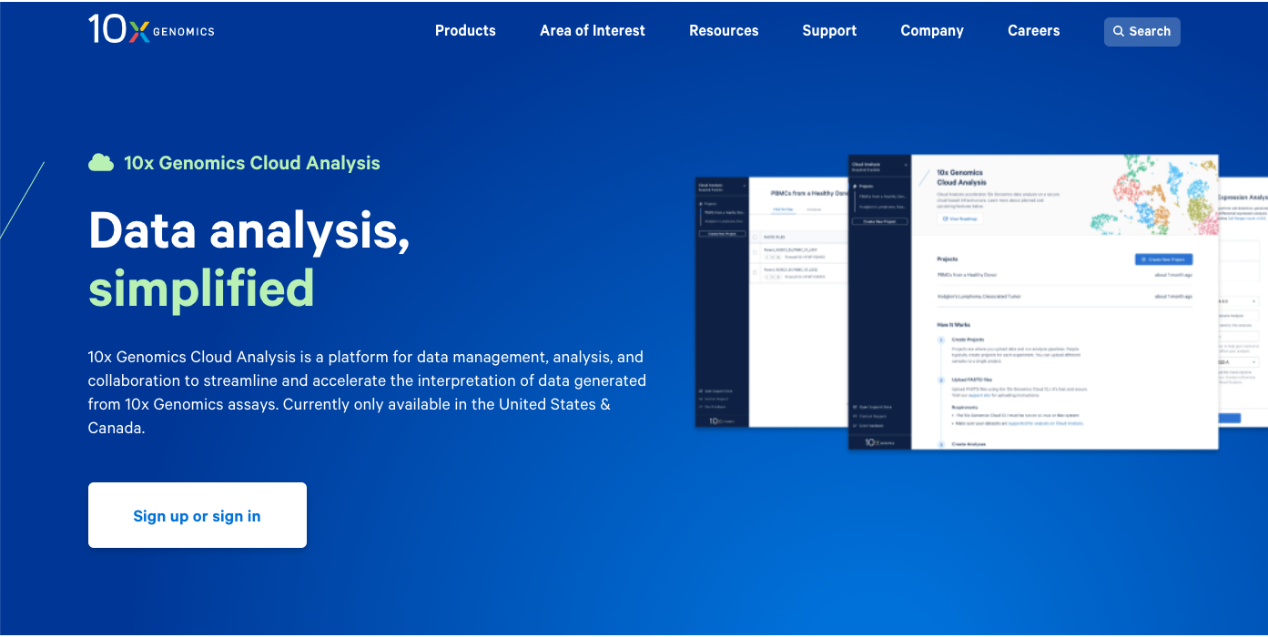
1.2. Click the button to move to the sign up /sign in page. Here is a direct link to the sign in page: https://cloud.10xgenomics.com/signin.
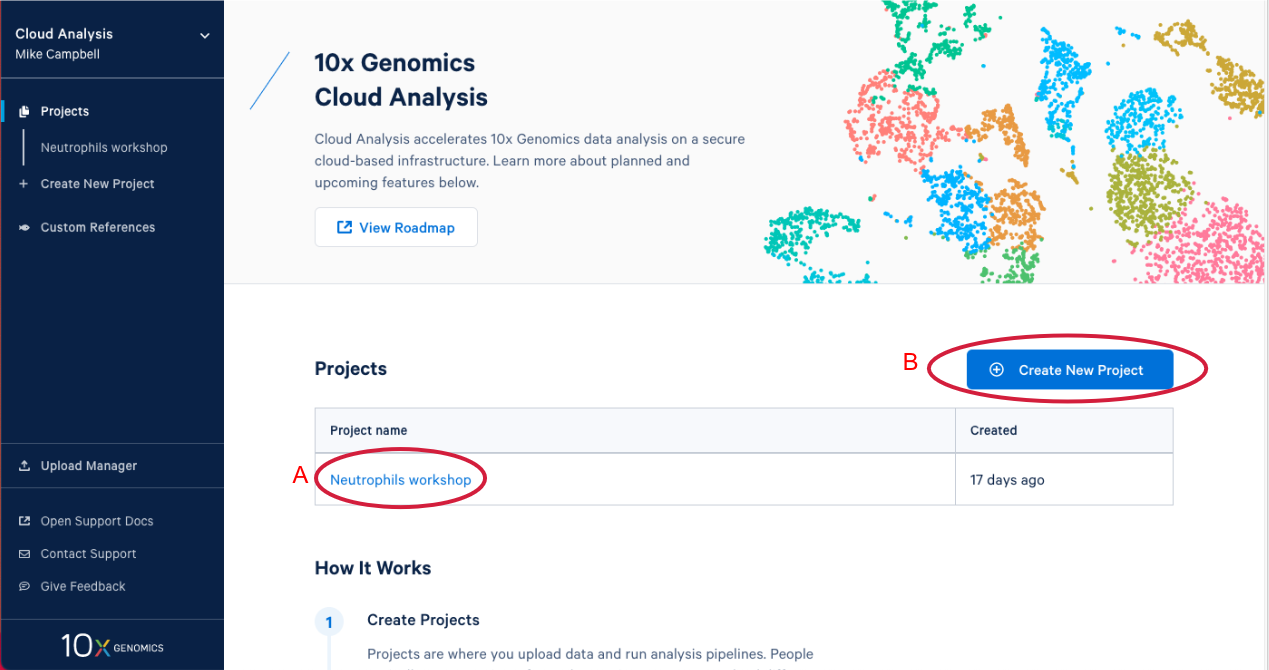
1.3. After you have signed in, the first thing you are going to see is the 10x Cloud projects page. Here you can see that I have one project that already exists (A in the Figure below). If you are participating in this workshop live you will have an existing project as well. We will come back to this later. Now let’s create a new project by clicking on "Create New Project." There are two places you can click to create a new project (B).
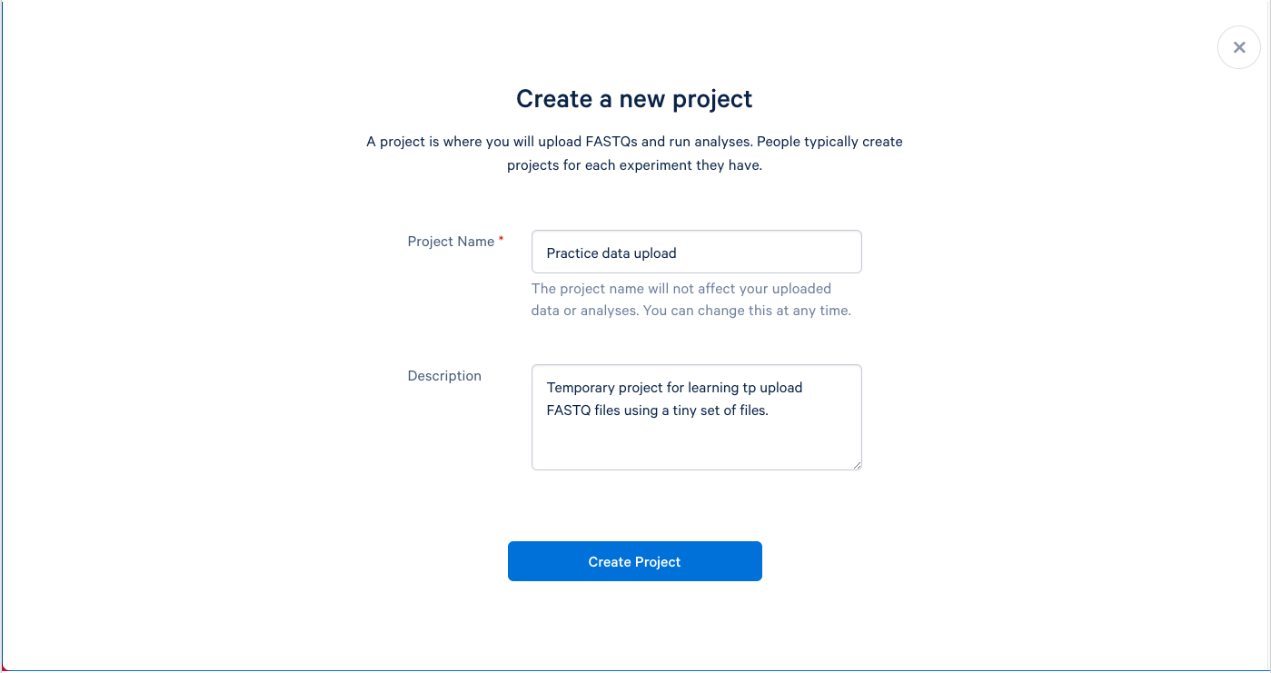
1.4. We can now name and describe our new project. Try to name your projects and provide descriptions that will make sense to you, and others, months from now. A good description can help not only you, but others that may be working on your project. The description is optional, but recommended.
1.5. After you click "Create Project" you will be taken to your project. On this page you can see the name of your project, the description, and the Project ID assigned to your project by the system. From here you are set up to upload your FASTQ files.
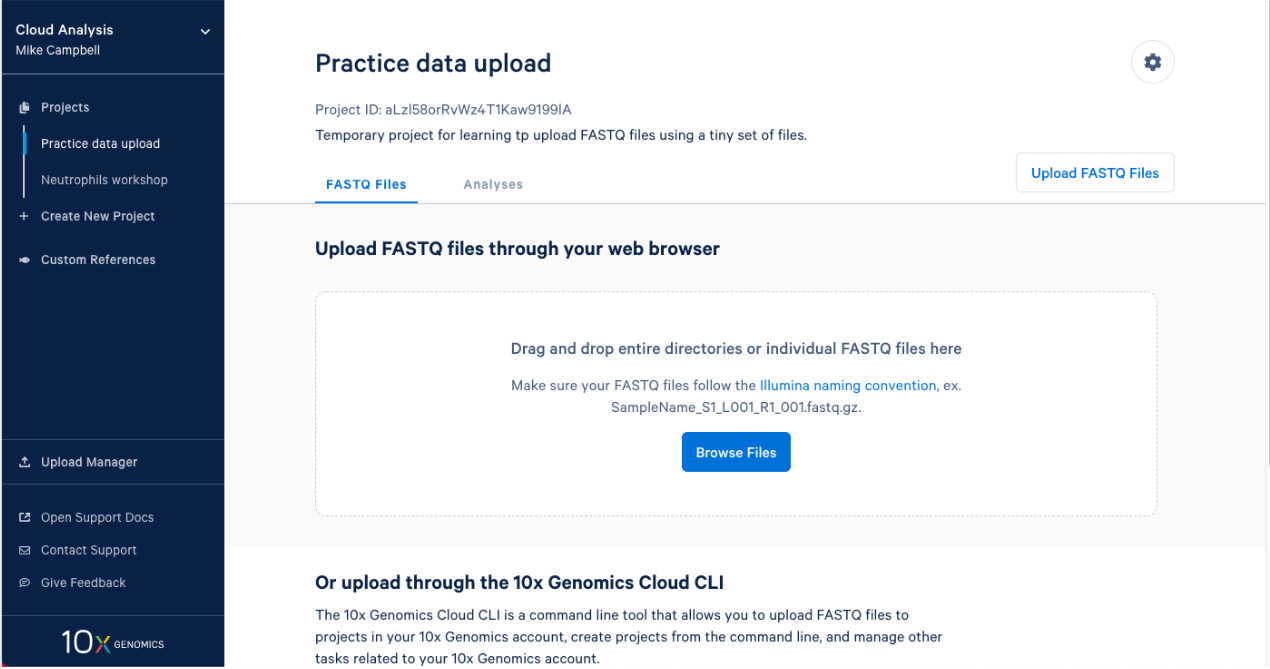
2.1. After you create a project it will take you right to the next step. To upload your input FASTQs, you can use the 10x Cloud web uploader or the command line uploader. For today, let’s use the web uploader with a set of tiny FASTQ files. If you are participating in this workshop live, you were sent the Tiny FASTQ set before the workshop. If you are following this workshop on your own (or missed the email) you can download the tiny FASTQs here. If I open the directory that contains the FASTQ files in finder this is what I see.
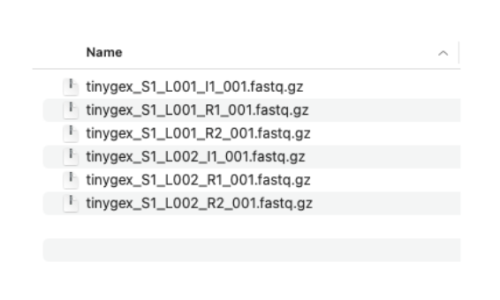
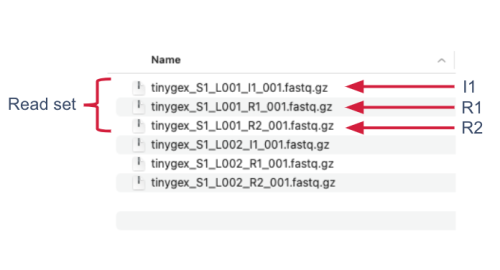
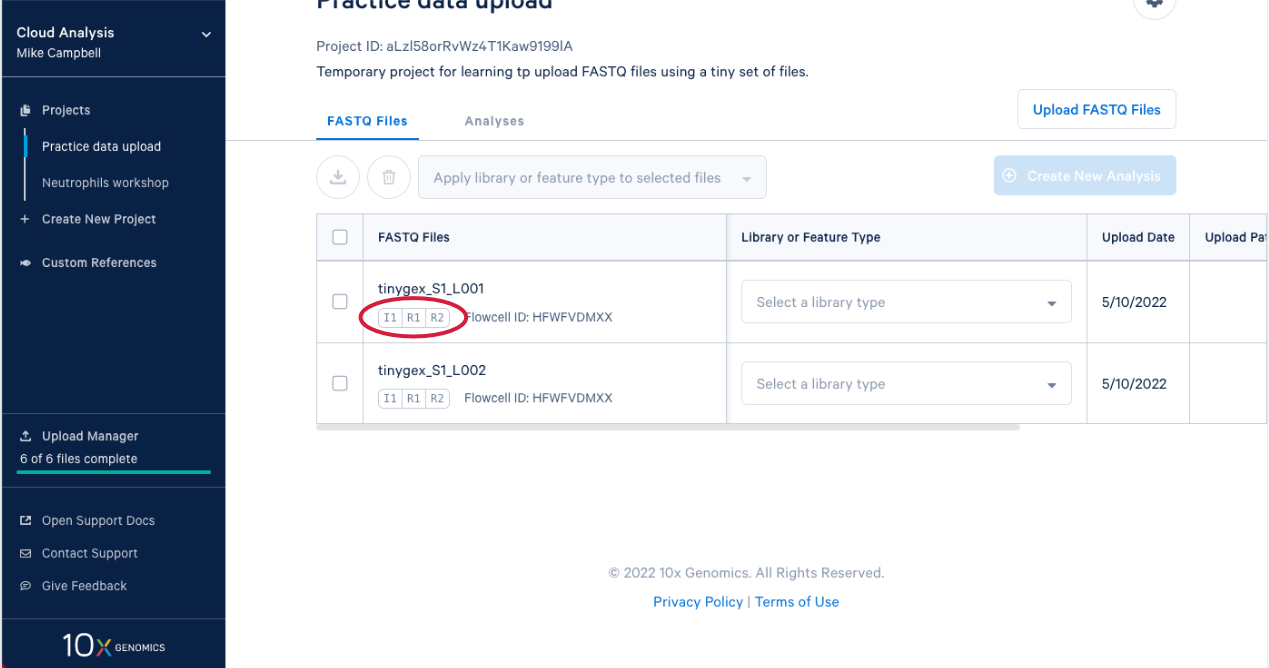
2.2. We have two sets of reads. Each set has three files. The R1 and R2 files contain the paired sequencing reads. The I1 files have the sequencing indices and are optional in our three prime gene expression assay. I’m showing them here because most sequencing providers deliver the I files along with R1 and R2 files. These files need to follow specific naming convention:
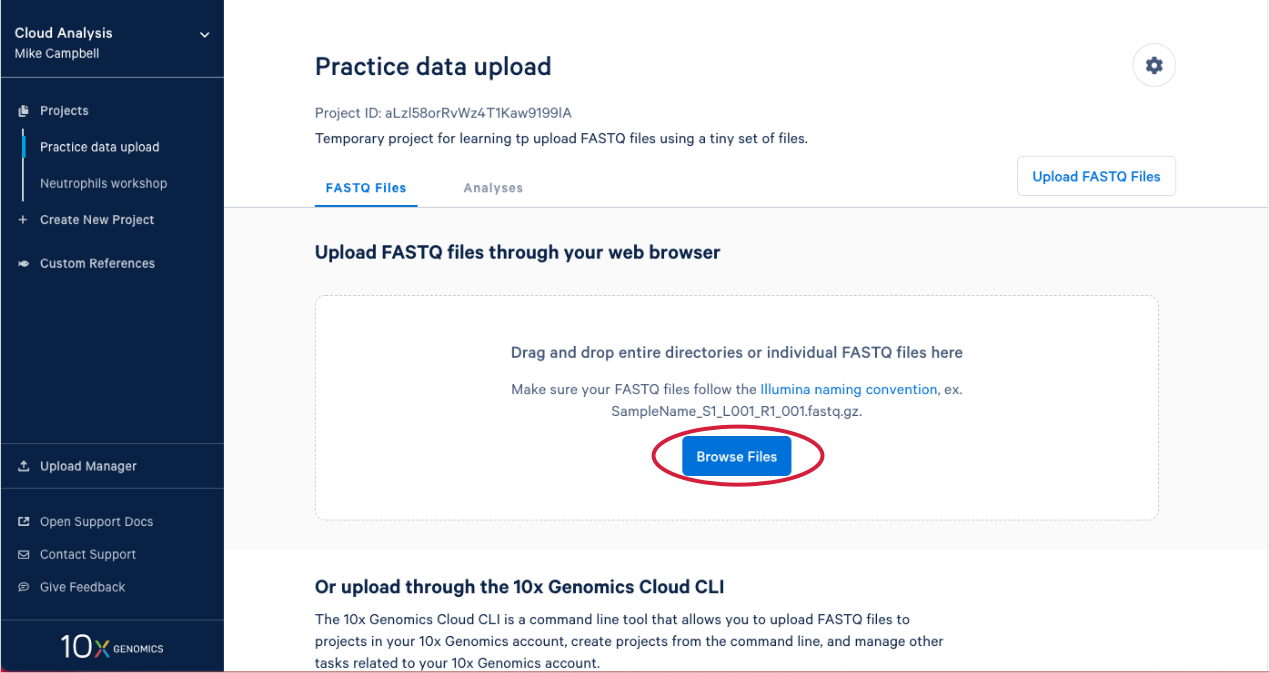
2.3. Click on "Browse Files" to use the web uploader to upload our tiny FASTQ files.
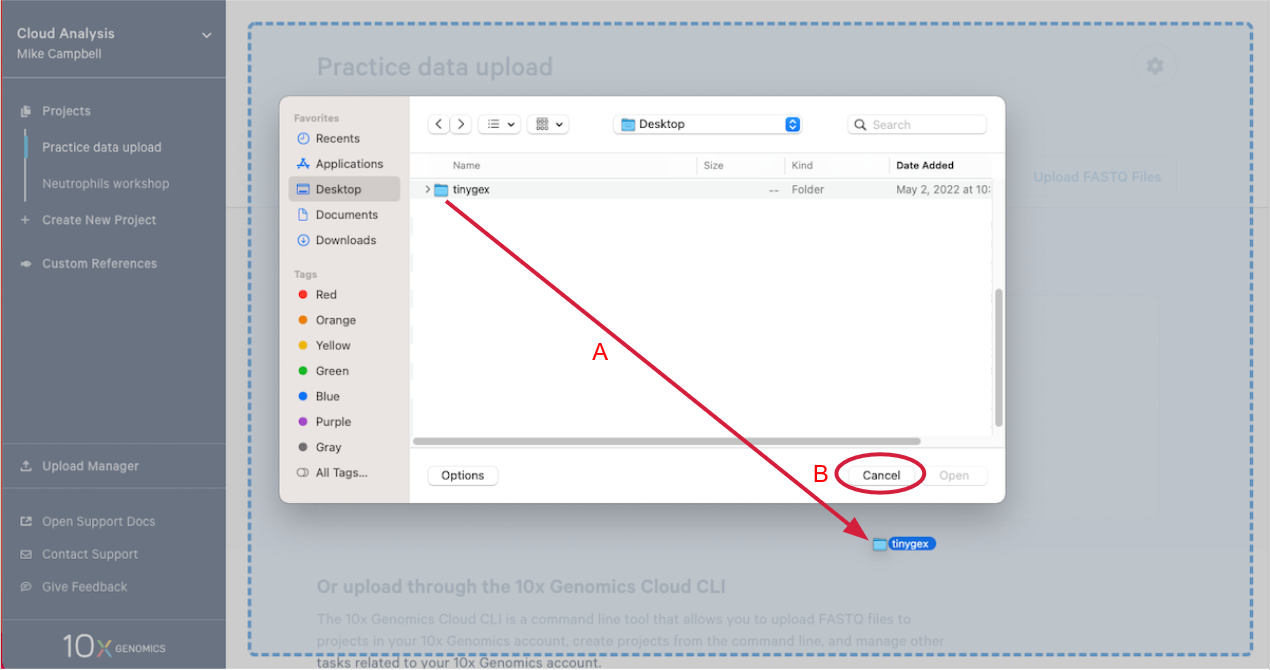
2.4. This will open your computer's file browser. Navigate to the directory that contains your FASTQ files. Drag it to your project window (A in the Figure below). This queues the FASTQ files for upload. Click "Cancel" on the file browser to return to your project (B).
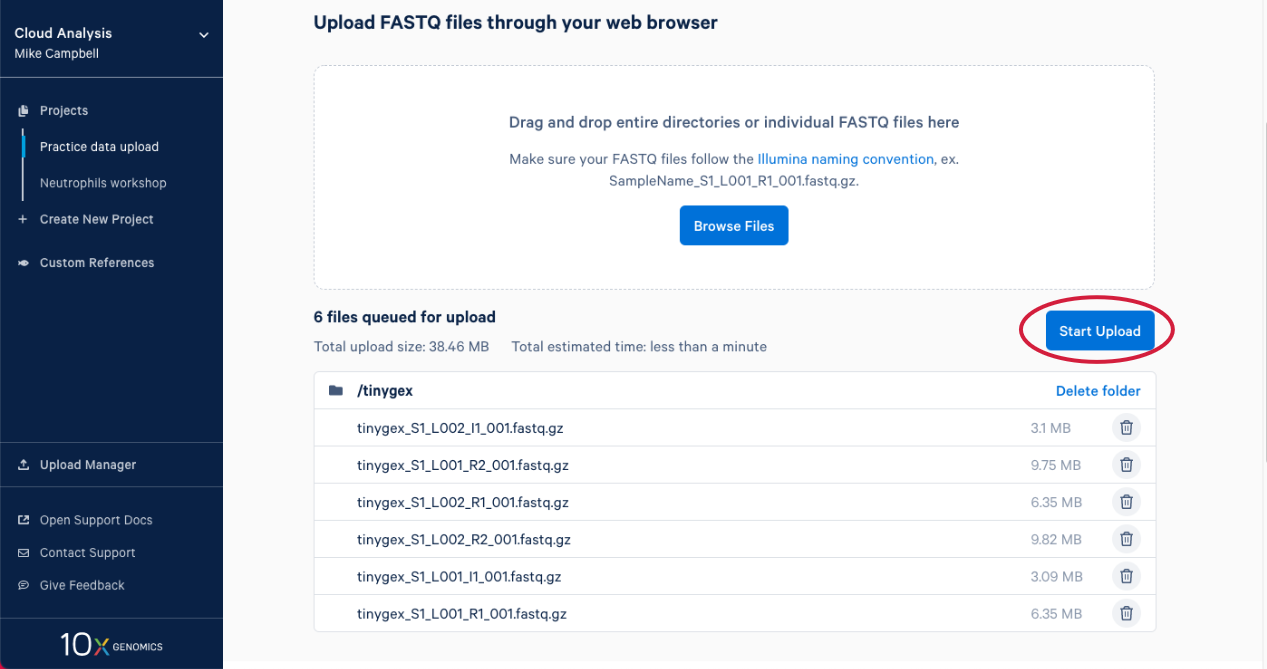
2.5. Click "Start Upload" to start the upload.
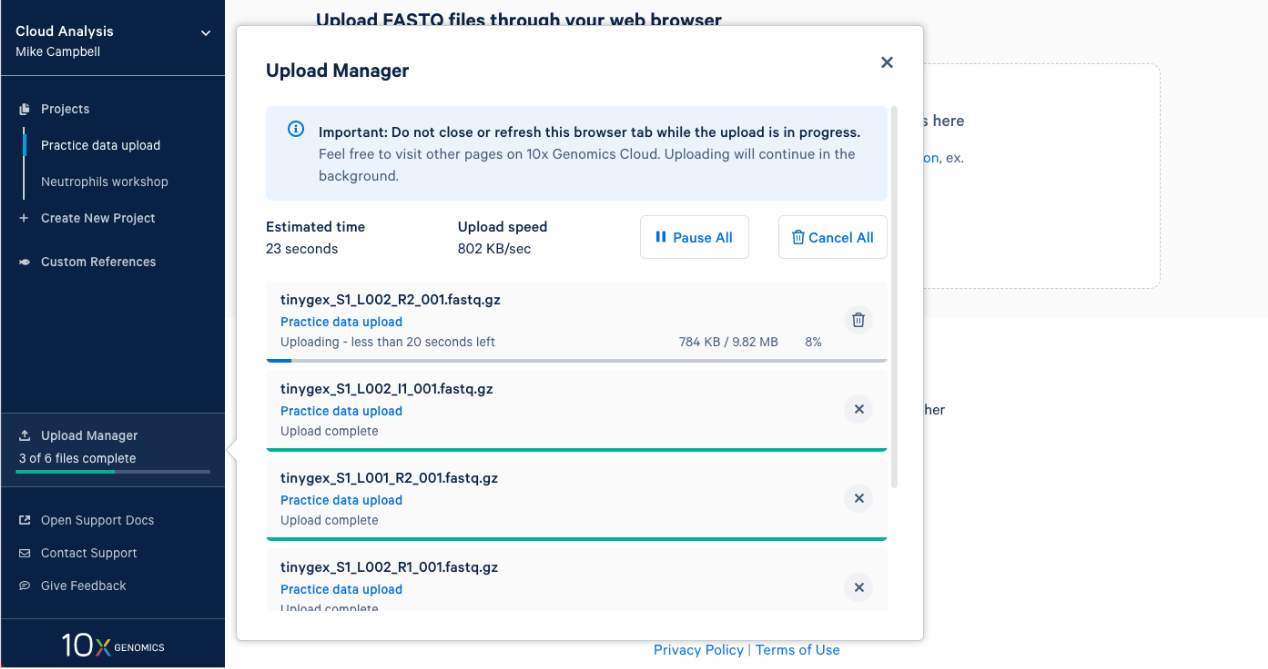
2.6. The upload manager opens, and we can monitor the progress of the upload from here. After a bit you will get an estimate for how long the data upload is going to take.
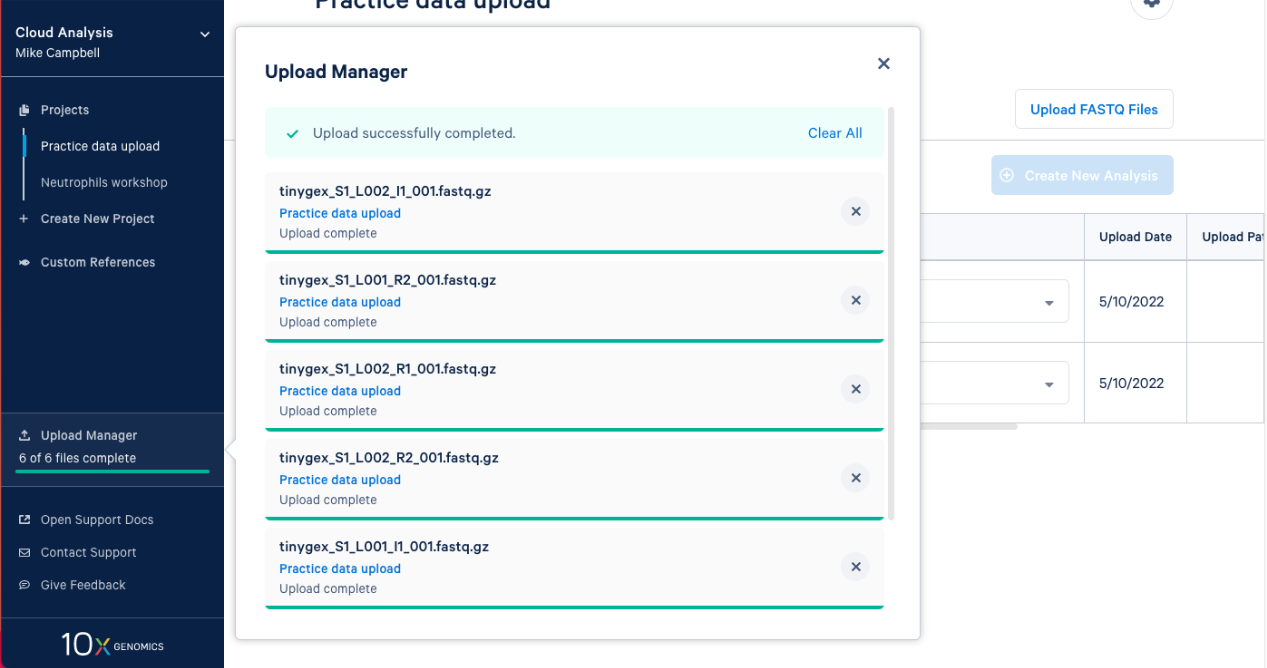
2.7. Once complete you will get an "Upload Successfully Completed" message. Then you can close the upload manager.
2.8. The FASTQs are now visible in your project. Based on the file naming, 10x Cloud Analysis will group sets of FASTQ files together. We can see that each set has an I1, R1, and R2 file associated with it. Now, you are ready to move on to analysis.
Note: If you would like a command line option for uploading FASTQ files, you can find detailed instructions here.
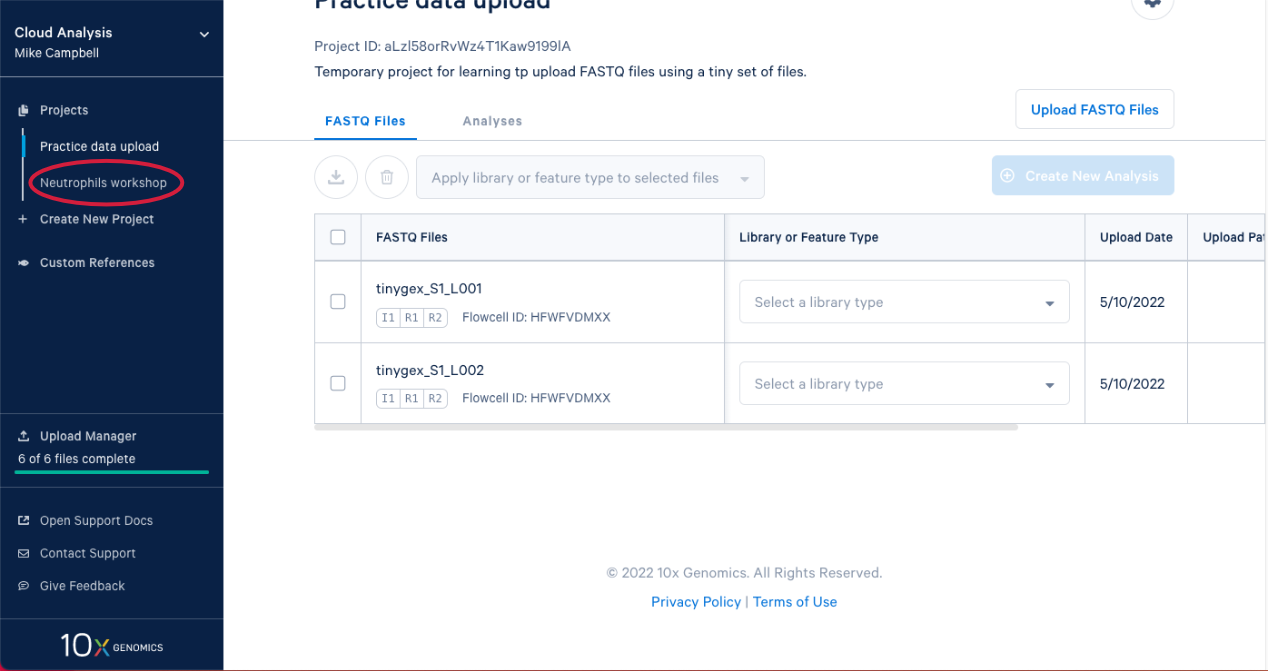
3.1. The Tiny FASTQ data set is great for learning to use the uploader, but it isn’t very useful for doing analysis. So let’s move over to the Neutrophils workshop project by clicking on it. Note: if you are working through this on your own, you can find the input FASTQ files for this data set here.
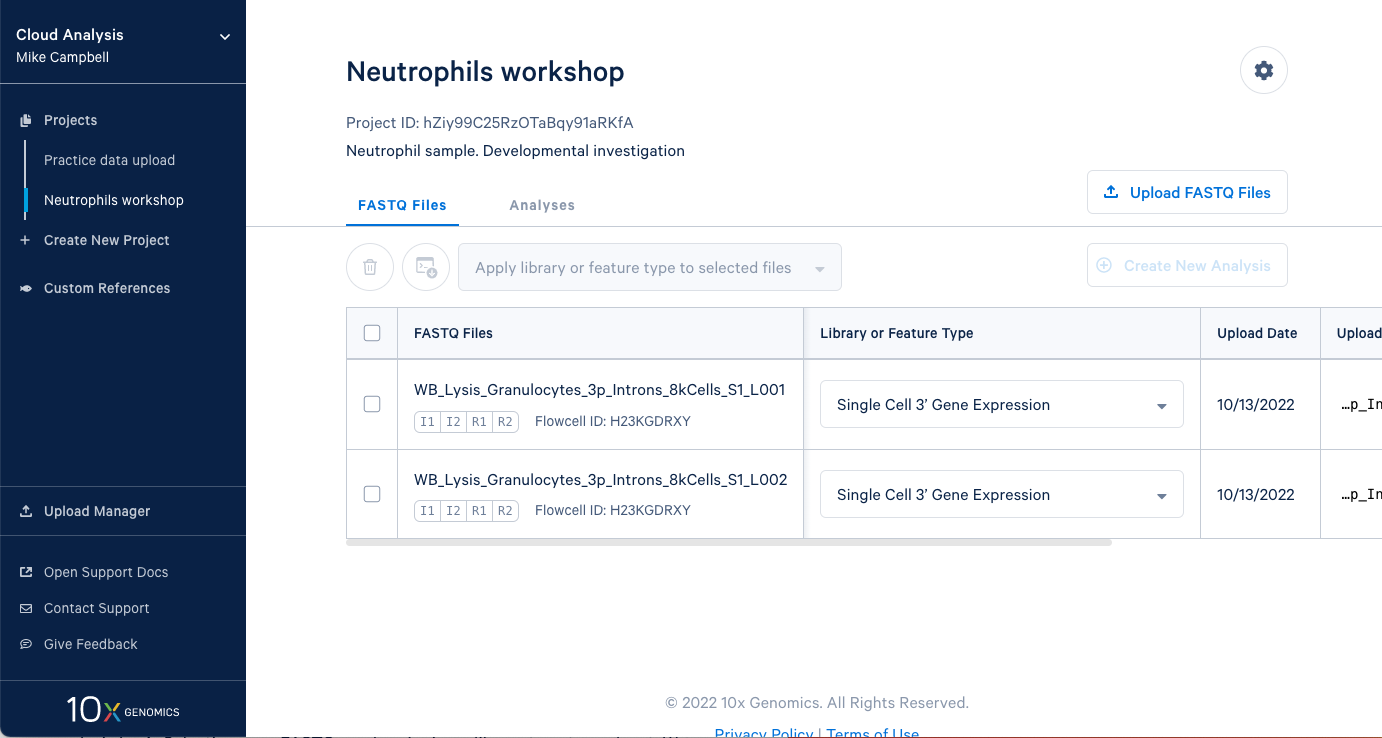
3.2. In this project we have two sets of FASTQ files as well. We also have an I2 file in these sets because the sequencing library and run was dual indexed.
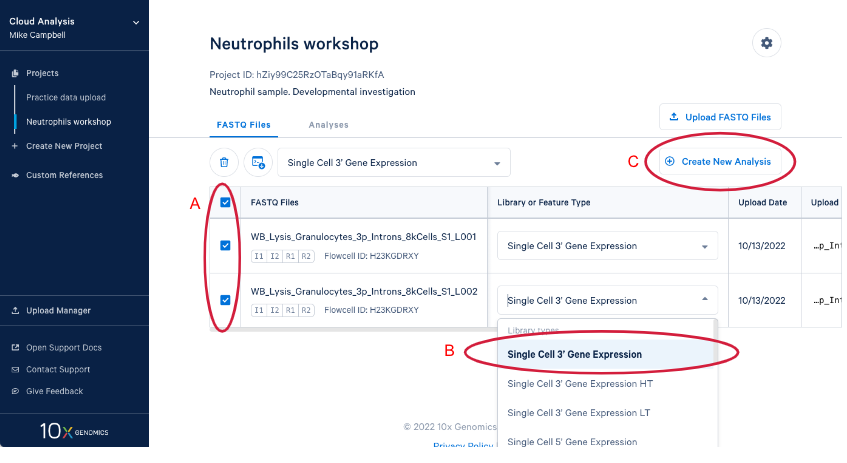
3.3. Create a new analysis by (A) Selecting your FASTQs and assigning a library type to each set. We are including both sets of FASTQ in our analysis and the library type is "Single Cell 3' Gene Expression." (B) If we had just uploaded these reads we would have to set library type before we could create the new analysis. Now (C) Enter the analysis wizard by clicking on the "Create New Analysis" button.
3.4. The analysis wizard shows you the FASTQs you are analyzing and selects a pipeline based on the library type you assigned to the FASTQ files. The Run Analysis button will remain inactive until we have filled in the minimum required parameters.
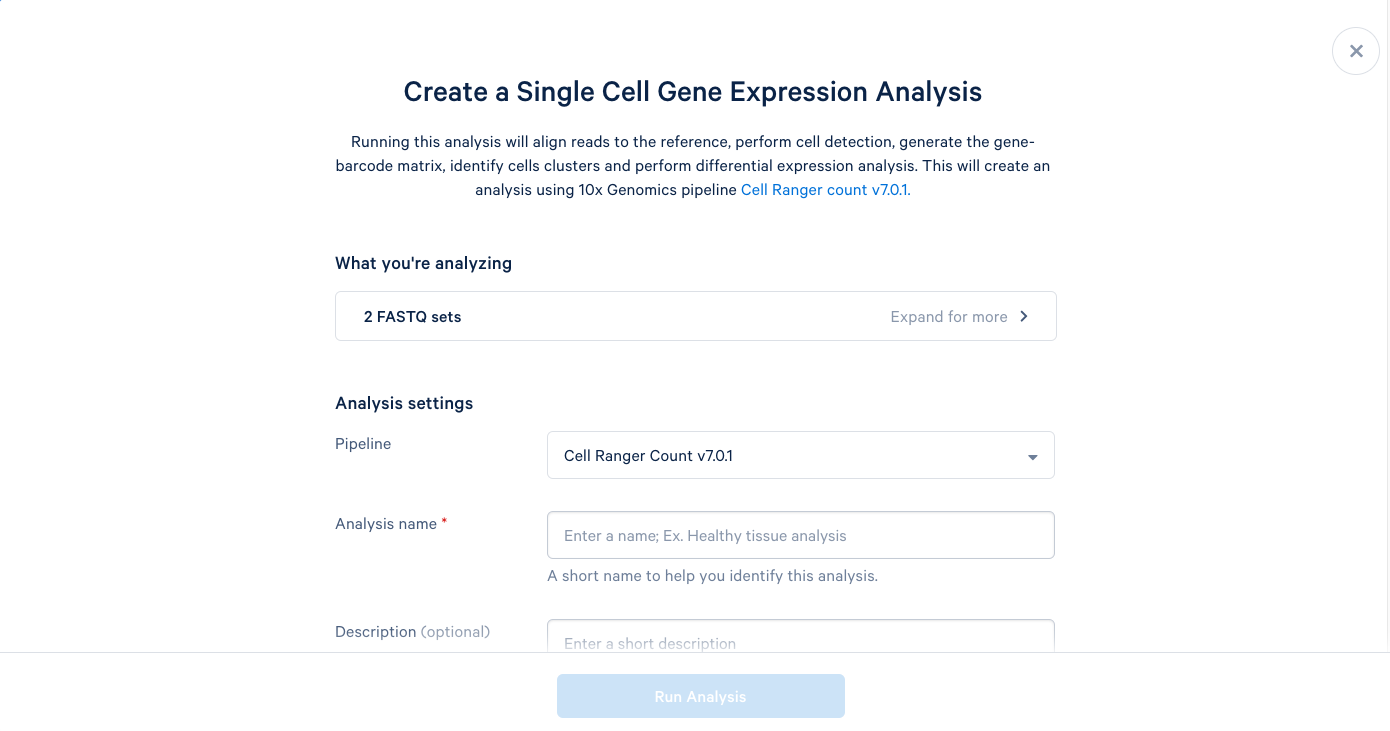
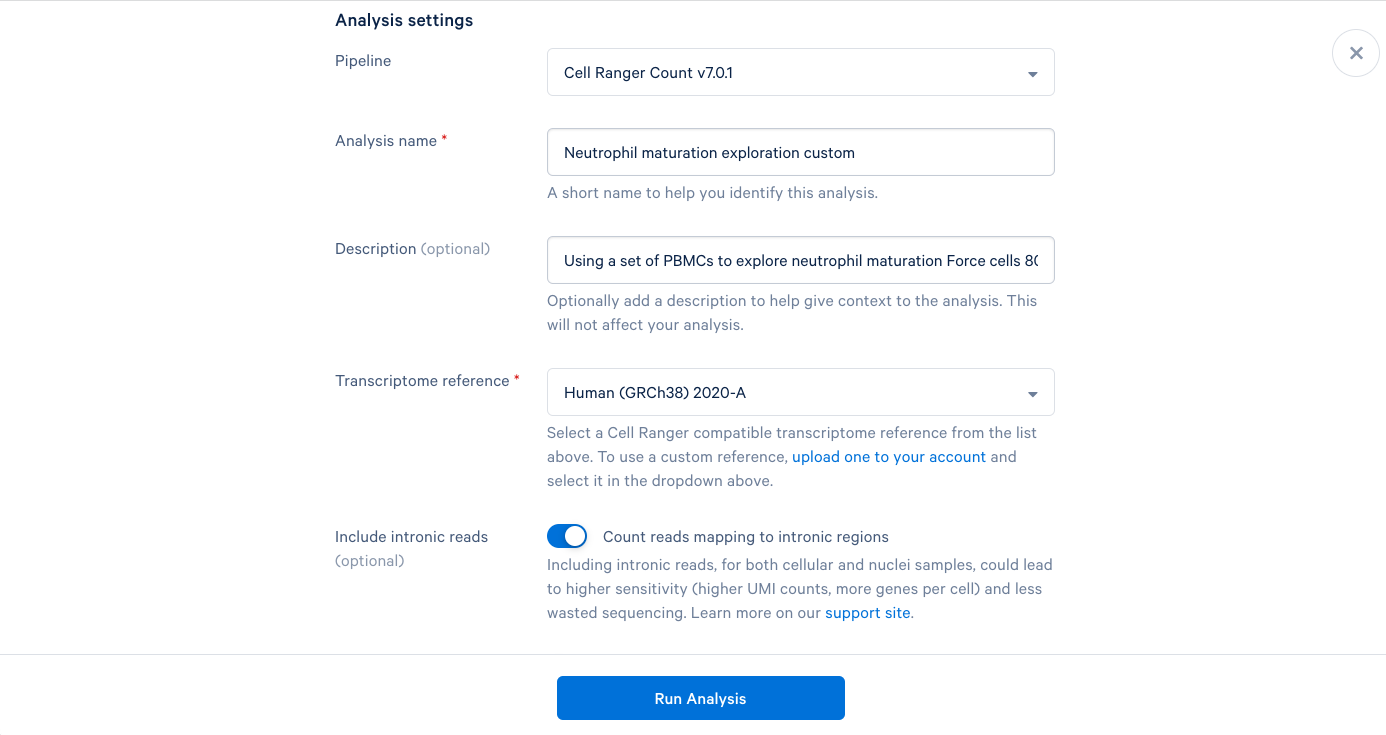
3.5. We can now add a name and a description to our analysis, just like the project name and description. It is recommended to use the default parameters the first time you run a new pipeline, which will provide a good baseline for determining what parameters should be modified in subsequent runs. Including this bit of information in the description can be helpful later.
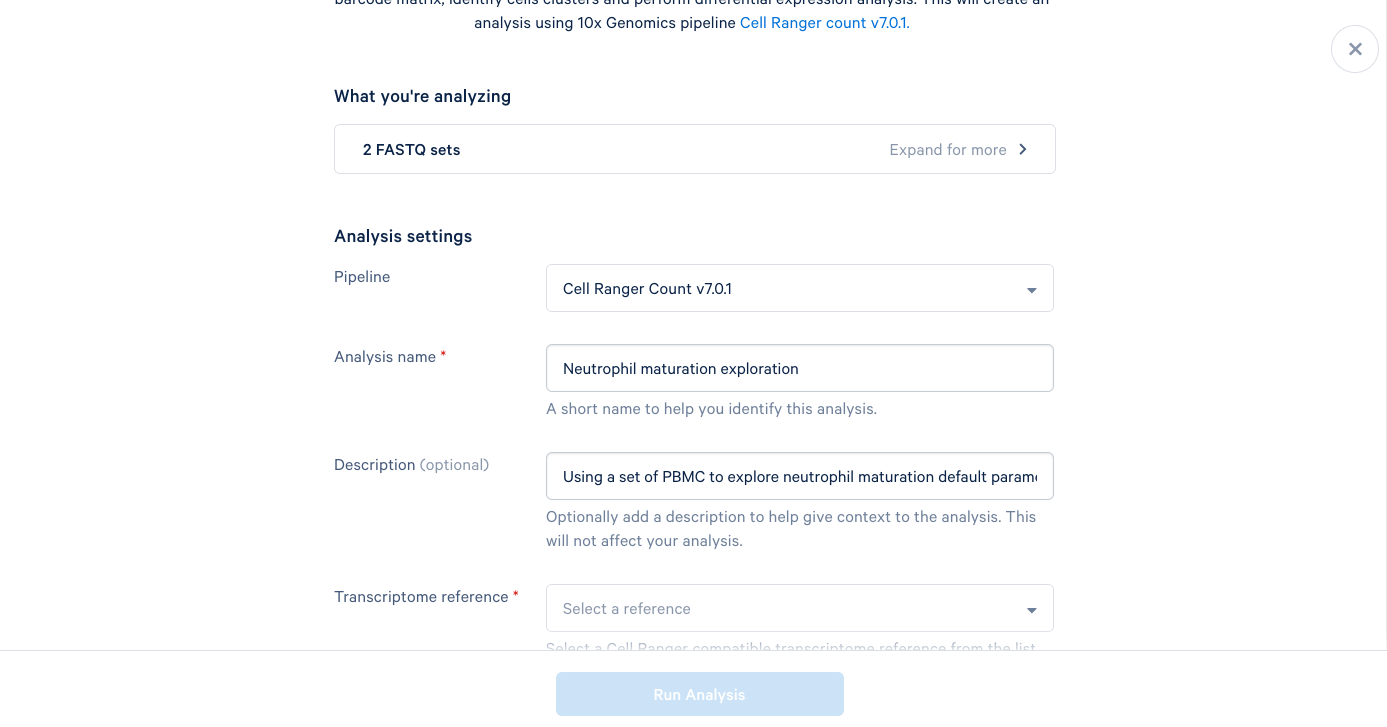
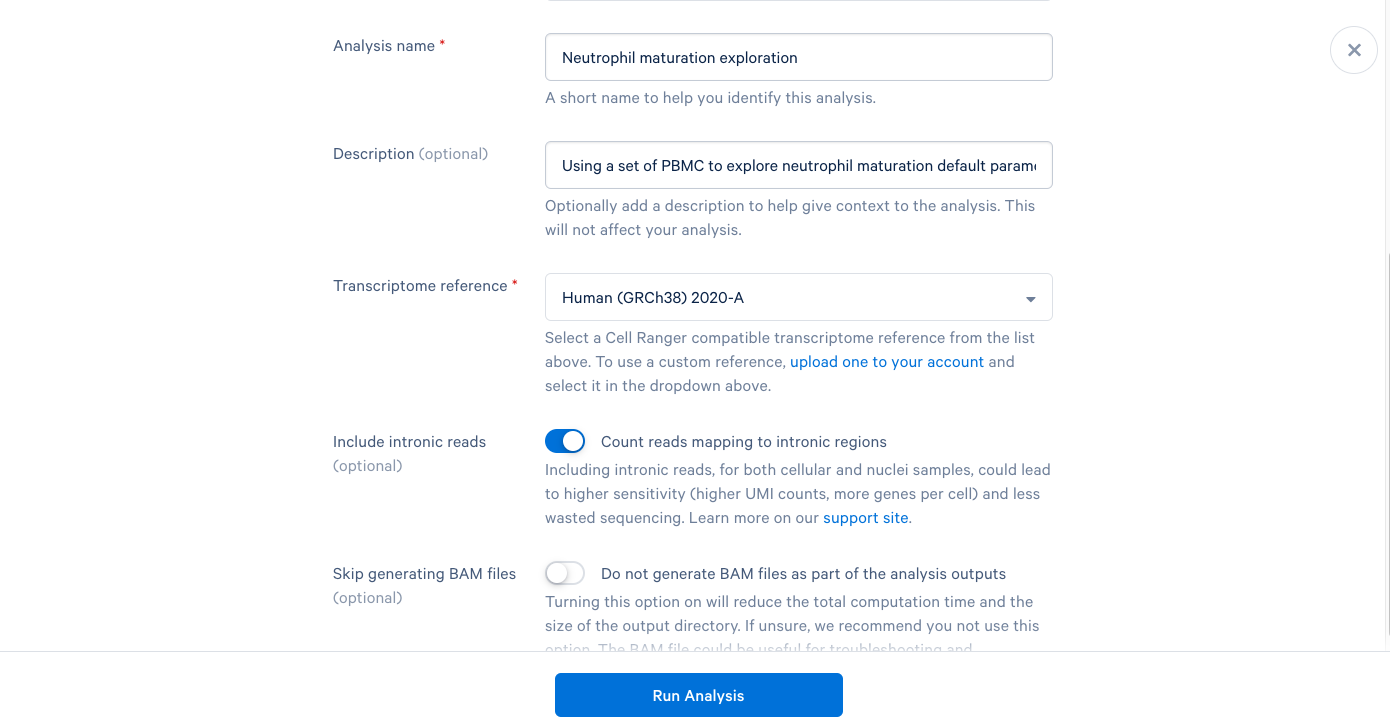
3.6. The only required field left is the Transcriptome reference. These are human PBMCs, so we will select the most recent human reference from the dropdown list. At this point, the "Run Analysis" button becomes active, and since we are running this one with default parameters, we are ready to click run.
3.7. We are now presented with a screen telling us that our analysis has started and that we will be notified by email once it is complete. Now click "Back to Project".
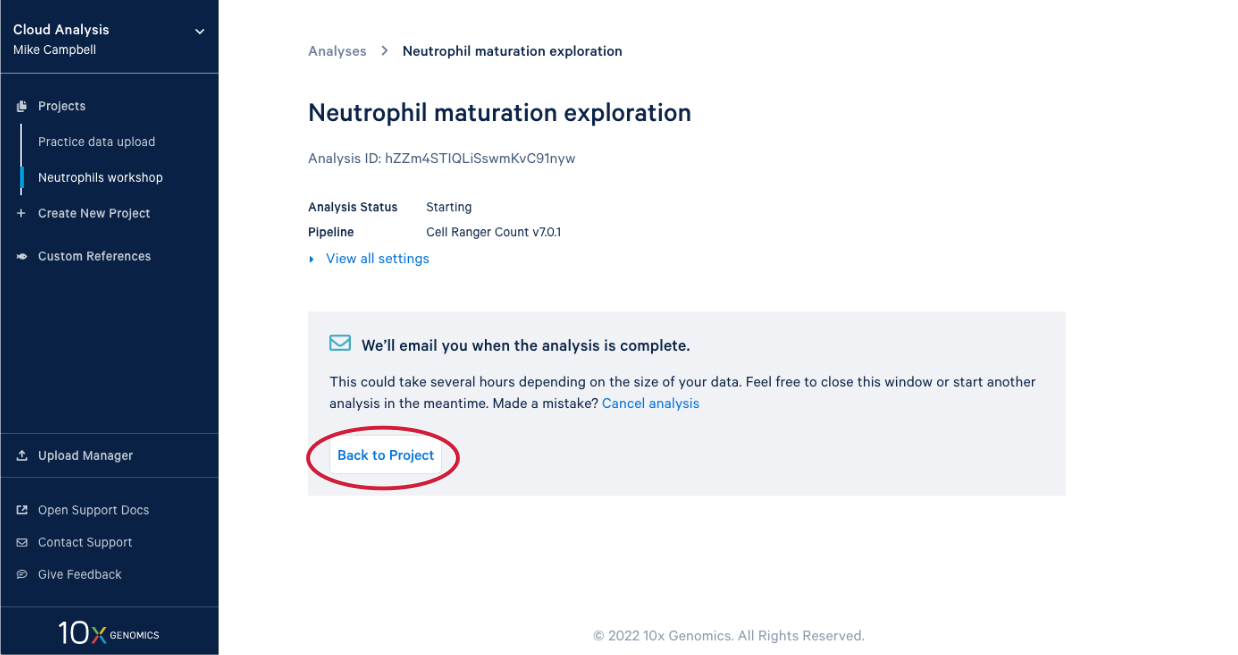
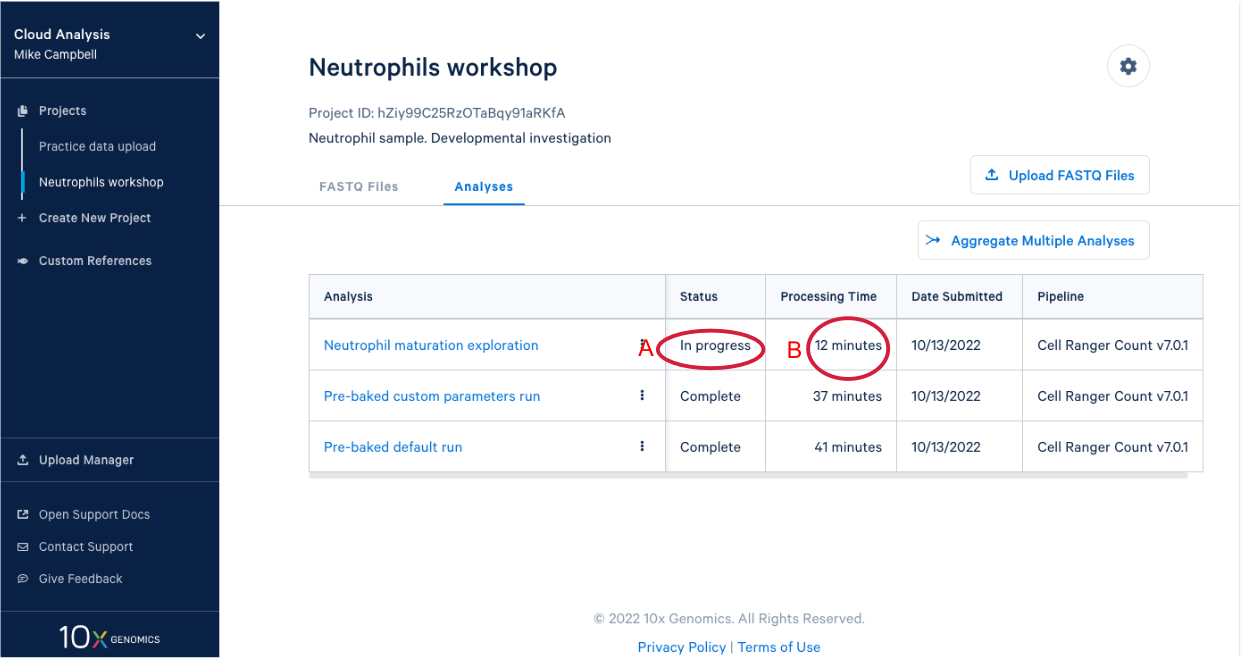
3.8. In our project we see our new analysis. (A) The status is "In progress". (B) We can see it has been running for 12 minutes, enough time for a quick break after starting the analysis.
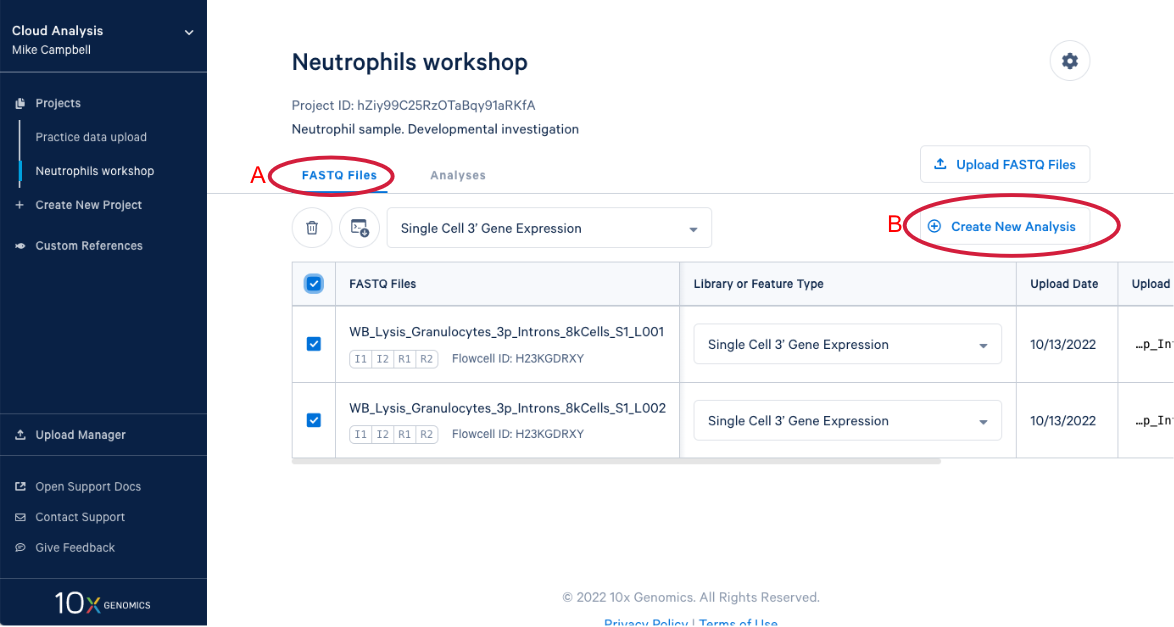
3.9 We know a few things about neutrophils that suggest we should run the pipeline again and modify one of the command line parameters. Start by (A) going back to the FASTQ files, and (B) click “Create New Analysis”.
3.10 Starting with the same steps as before, give the analysis a name, a description, and select a reference. But don’t click “Run Analysis” yet.
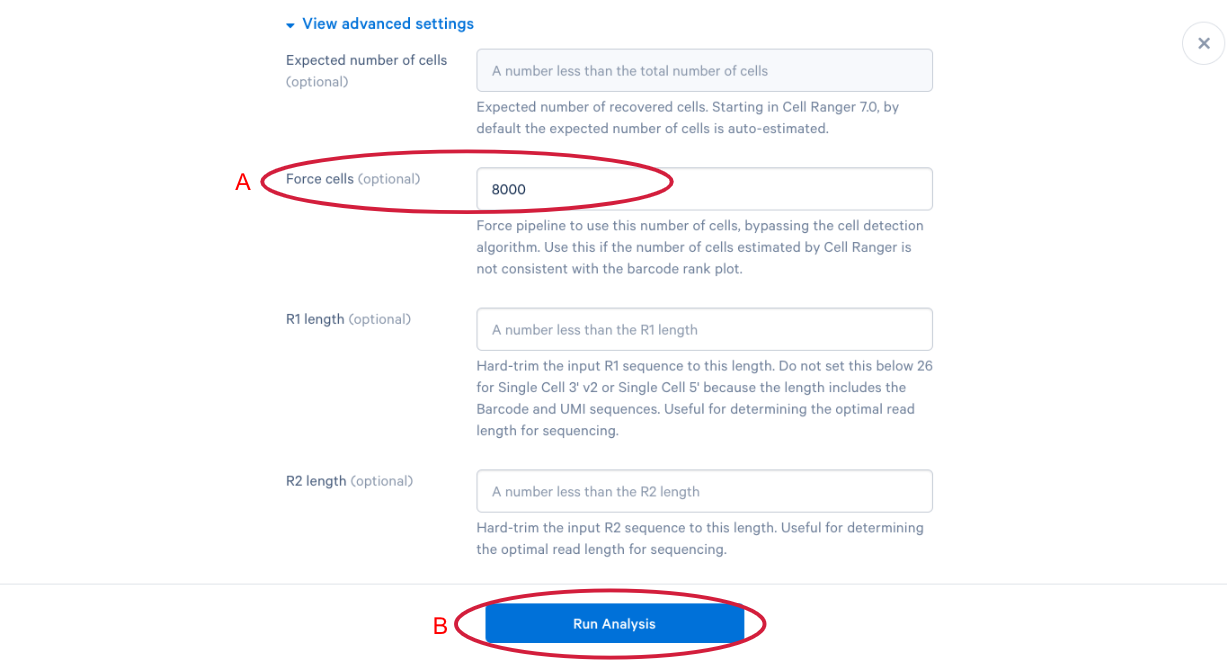
3.11 scroll down and click “View advanced settings”
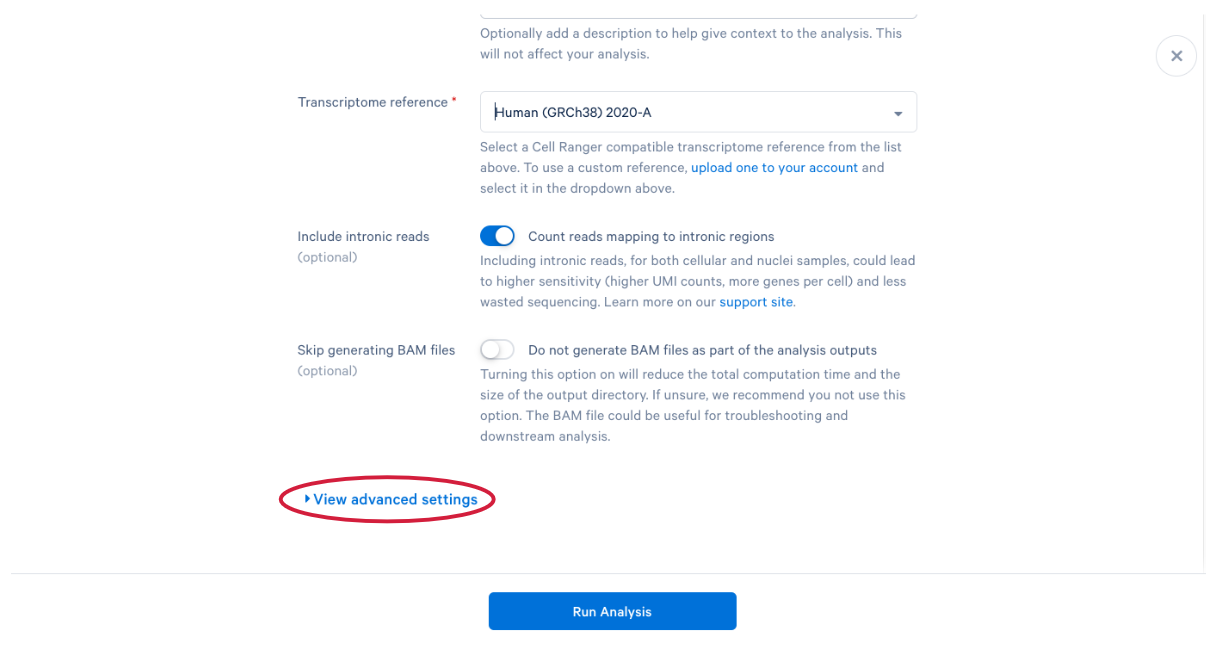
3.12 The parameter that we want to change is the (A) “Force cells” parameter. Neutrophils are know to express fewer genes and have lower RNA content than many of the other cell types in our PBMC sample. In order to capture these cells in our analysis, we need to bypass the pipeline cell calling. Later in this workshop, we will compare our modified run with our default run and show why the modification is necessary for this specific sample. This is also a great example of how your experimental design influences the way you approach analysis. At this point we can click (B) “Run Analysis”.
3.13 Our new analysis has been running for one minute, and the default run has already finished. It is worth mentioning that in an in-person workshop setting, we will have run over 60 Cell Ranger analyses simultaneously, and they all typically finish in about 45 minutes. This is all happening while other 10x Cloud users are also running analyses. This highlights the large computing infrastructure supporting your runs on 10x Cloud and the potential for rapidly running many samples in parallel.
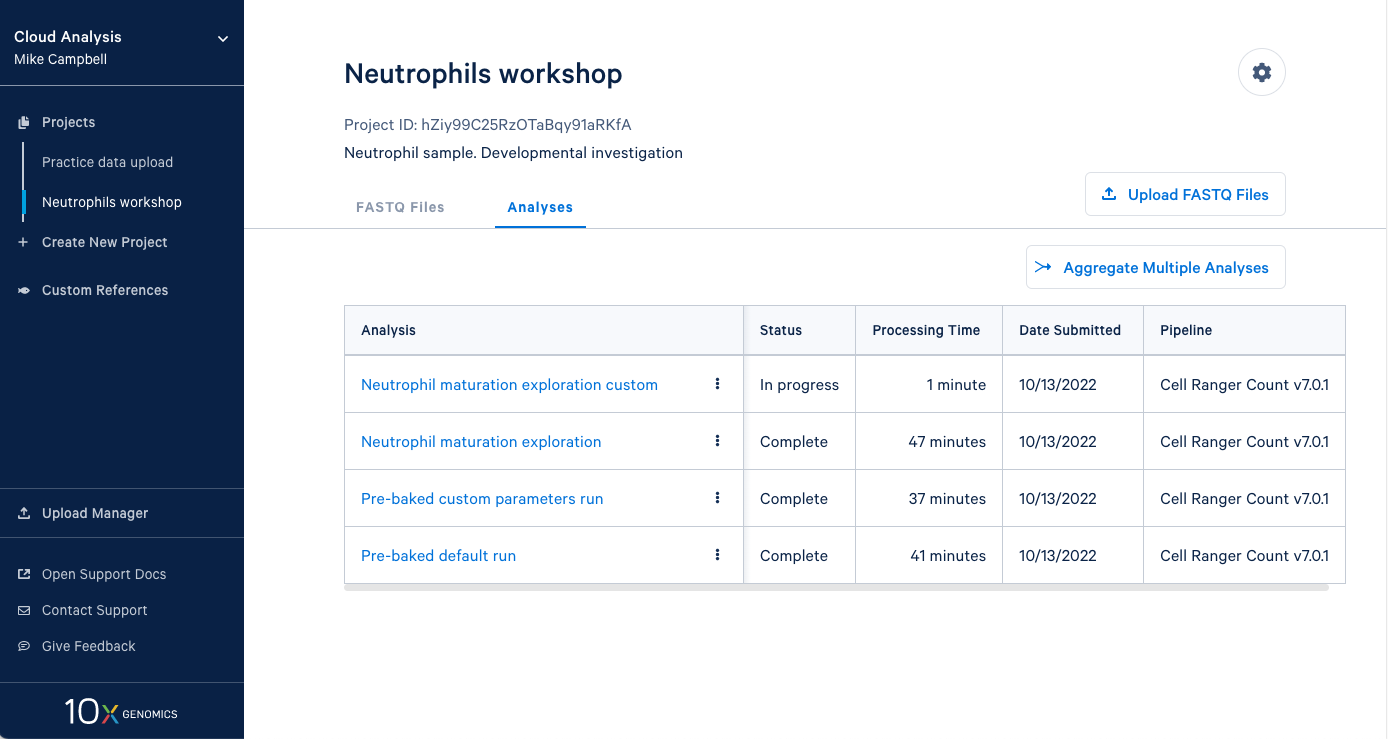
4.1. From here you can either wait for one of the runs to complete or, if you are in the live workshop, you can have a look at one of the preloaded runs that used the same data and parameters as the analyses we just started. Either way, click on the analysis to see the results.
4.2. There is a lot of information on this page. (A) By clicking the “View all settings” dropdown you can see all the parameters used in this run. (B) This button is for viewing the web summary. We will spend some time on the web summary a little later.
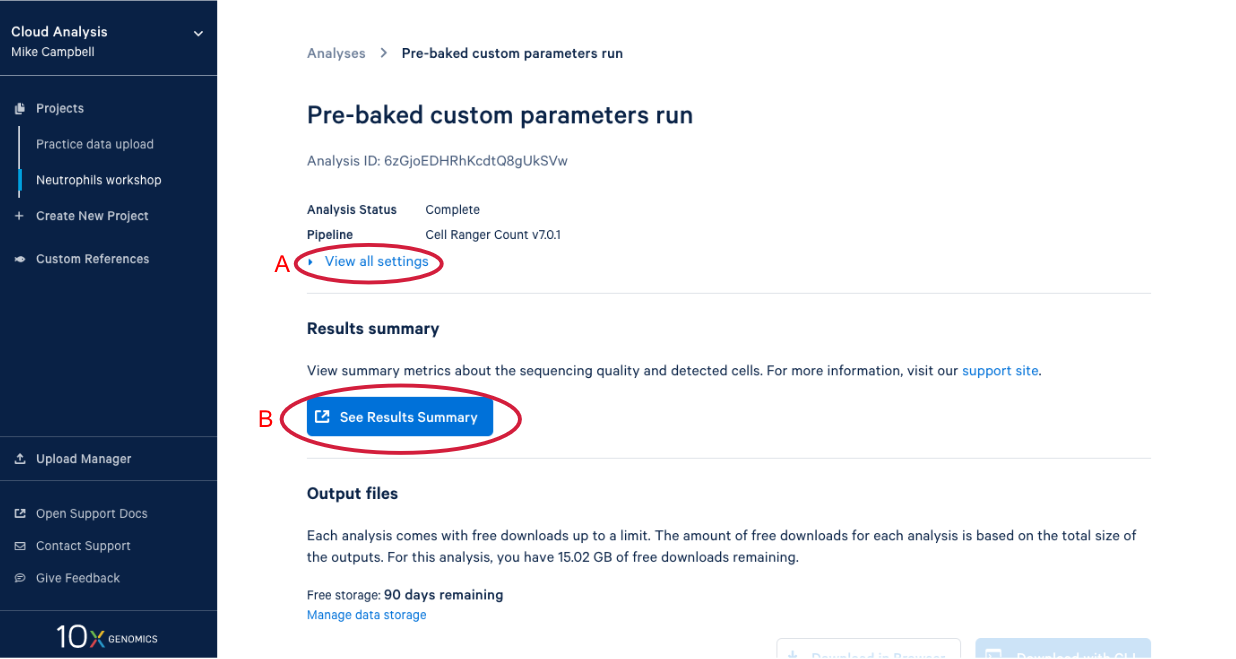
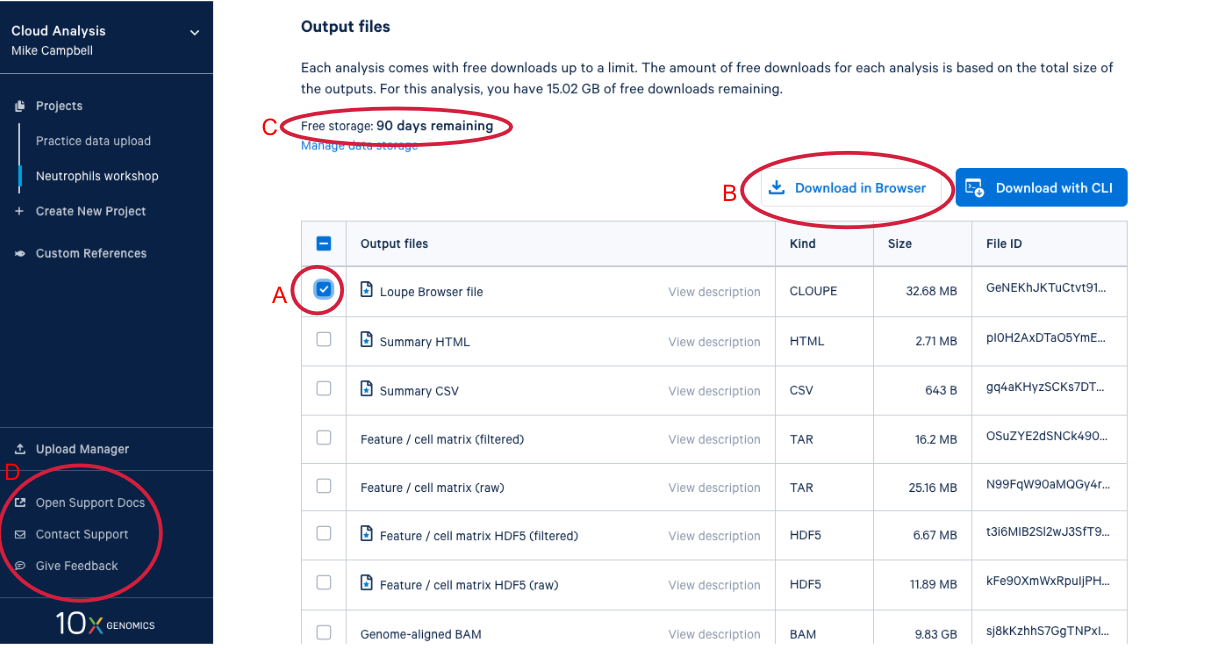
4.3. Scrolling down takes us to the output files where find a number of different file types. After we do a bit of QA with the web summary, we will use the Loupe file that you can see here. (A) While we are here, we might as well start downloading the Loupe file by checking the box next to the file and (B) clicking the download button. (C) We can also see on this page that we have a certain number of days of free storage left for this analysis. For more information on Cell Ranger output files, visit our support site here. For more information about 10x Genomics Cloud Analysis, please visit our website here. If you have questions about 10X Genomics Cloud Analysis, have an issue with your run, or want to provide feedback D. these three links are helpful for finding documentation, creating a ticket with 10x Genomics support, and/or sending in your feedback.
This concludes the raw data processing section of our workshop. Up next we have Quality Assessment using the Cell Ranger Web summary.