Xenium v1 Human Breast FFPE with Biomarkers & Housekeeping Genes Custom Panel
In Situ Gene Expression dataset analyzed using Xenium Onboard Analysis 4.0.0

Learn about Xenium Analysis
Overview
Dataset companion to the preprint, "Biomarker Quantification in Breast Cancer using Xenium In Situ", which explores: 1) housekeeping gene stability across 12 human breast samples and 2) biomarker normalization in tumor cells, myoepithelial cells, and the peritumoral space.
How to view data
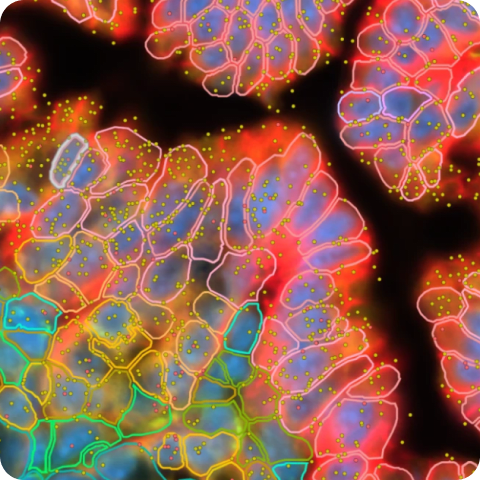
Interactively explore data with Xenium Explorer by downloading the Xenium Output Bundle (or Xenium Explorer subset) file. The subset bundle contains the experiment.xenium, gene_panel.json, morphology_focus/ directory of multi-file OME-TIFF files, analysis_summary.html, cells.zarr.zip, cell_feature_matrix.zarr.zip, transcripts.zarr.zip, and analysis.zarr.zip files.
See the Getting Started with Xenium Explorer page for more details. Follow these instructions to view the post-Xenium H&E image or image alignment file in Xenium Explorer.
Biomaterials
From Supplemental Table S1:
| Section | Disease | Tumor Staging | Grade | Hormone Status |
|---|---|---|---|---|
| S1-Top | IDC | T3 N0 M0 | G3 | HER2-Neg |
| S1-Middle | DCIS | T2 N0 M0 | G2 | ER+/PR+/HER2-2+ |
| S1-Bottom | DCIS | T1c N0 M0 | G3 | HER2-1+ |
| S2-Top | Normal | NA (Normal) | NA | HER2-Neg |
| S2-Middlle | DCIS | T1c N1 MX | G2 | HER2-2+ |
| S2-Bottom | DCIS | Tis NX MX | G3 | HER2-3+ |
| S3-Top | CCH/DCIS | Tis N0 | G2 | ER+/PR+/HER2-1+ |
| S3-Middle | DCIS | T4b N3a M1 | G2 | ER+/PR+/HER2-2+ |
| S3-Bottom | DCIS | TX NX M0 | G2 | ER-/PR-/HER2-2+ |
| S4-Top | IDC | Tis NX MX | G3 | ER+/PR+/HER2-1+ |
| S4-Middle | IDC | T2 N0 MX | Not provided | ER+/PR+/HER2-2+ |
| S4-Bottom | DCIS | T4a N2a | G3 | HER2-1+ |
Tissue preparation
Tissue sections were prepared following the Xenium In Situ for FFPE - Tissue Preparation Handbook (CG000578).
Probe hybridization, washing, ligation, amplification, and cell segmentation staining were performed following the Xenium In Situ Gene Expression with Cell Segmentation Staining User Guide (CG000749).
Post-instrument processing followed the Demonstrated Protocol Xenium In Situ Gene Expression - Post-Xenium Analyzer H&E Staining (CG000613).
Gene panels
A 280-gene fully custom standalone panel was designed for this study. The panel enables comprehensive cell type identification in human breast cancer with particular emphasis on basement membrane markers (see Supplemental Table S3) and myoepithelial genes, such as ACTA2, MYH11, KRT14/17, and CNN1. A number of human breast tumor biomarkers were included, such as ERBB2, PGR, ESR1, GATA3, and MKI67. The panel also includes 45 housekeeping (HK) genes that were derived from literature (Tilli et al. 2016; Jo et al. 2019; Jain et al. 2020), Oncogene Dx reference panel (Cronin et al. 2004), and internal 10x Genomics Flex Gene Expression or Xenium In Situ Gene Expression breast datasets. These genes were selected based on their low dispersion features observed in these datasets. Probe set numbers were reduced for some genes due to predicted high expression.
Xenium Analyzer
The instrument run was performed following the Xenium Analyzer User Guide (CG000584). The on-instrument analysis was run with Xenium Onboard Analysis version 4.0.0.
| Section | Median transcripts per cell | Cells detected | Nuclear transcripts per 100 µm² | High quality decoded transcripts detected | Region area (µm²) |
|---|---|---|---|---|---|
| S1-Top | 137 | 209,467 | 361.0 | 55,283,583 | 60,267,079.8 |
| S1-Middle | 288 | 375,529 | 497.5 | 151,961,258 | 79,408,960.4 |
| S1-Bottom | 241 | 254,480 | 517.9 | 117,652,311 | 88,981,827.0 |
| S2-Top | 88 | 301,854 | 275.5 | 41,712,807 | 75,507,037.7 |
| S2-Middlle | 73 | 380,739 | 269.5 | 65,062,084 | 66,827,148.0 |
| S2-Bottom | 83 | 358,519 | 295.4 | 92,260,459 | 99,470,825.5 |
| S3-Top | 124 | 308,531 | 273.2 | 57,809,585 | 99,869,377.4 |
| S3-Middle | 304 | 373,150 | 526.7 | 177,879,847 | 82,010,605.8 |
| S3-Bottom | 168 | 150,145 | 343.6 | 37,555,926 | 31,953,714.8 |
| S4-Top | 123 | 192,898 | 351.0 | 55,927,783 | 62,975,500.6 |
| S4-Middle | 246 | 335,709 | 422.3 | 111,763,697 | 68,547,410.3 |
| S4-Bottom | 218 | 201,955 | 314.8 | 80,016,546 | 55,029,208.1 |
Custom Cell Groups
Xenium data was imported into Seurat v5.0.1.9007, without transcript coordinate data, according to the vignette, "Analysis of Image-based Spatial Data in Seurat". Cells were retained for downstream analysis only if they contained more than 10 total transcripts and detected over five unique genes. We normalized the data using SCTransform. Using the FindClusters function (resolution = 0.3, dimensionality determined via elbow plot ranking of principle components), the major cell type groups were manually annotated based on differentially expressed genes (using the FindMarkers function). Additional subclustering was performed in one instance: myoepithelial cells from the S1-Top section were subdivided into normal-adjacent and tumor-adjacent populations.
References
- Cronin M, et al. Measurement of Gene Expression in Archival Paraffin-Embedded Tissues: Development and Performance of a 92-Gene Reverse Transcriptase-Polymerase Chain Reaction Assay. The American Journal of Pathology 164 (1): 35–42, 2004.
- Jain N, et al. Selecting Suitable Reference Genes for qPCR Normalization: A Comprehensive Analysis in MCF-7 Breast Cancer Cell Line. BMC Molecular and Cell Biology 21 (1): 1–19, 2020.
- Jo, J, et al. Conventionally Used Reference Genes Are Not Outstanding for Normalization of Gene Expression in Human Cancer Research. BMC Bioinformatics 20 (10): 13–21, 2019.
- Tilli T, et al. A Strategy to Identify Housekeeping Genes Suitable for Analysis in Breast Cancer Diseases. BMC Genomics 17 (1): 639, 2016.
This dataset is licensed under the Creative Commons Attribution 4.0 International (CC BY 4.0) license. 10x citation guidelines available here.