Atera World Tour 2026
Find a stop near youXenium Analysis
10x Genomicsが誇る最高のオンボード解析は、ランの実行中にデータを自動処理するため、ラン終了後に何時間もデータ処理を待つ必要がありません。直感的な視覚化ソフトウェアXenium Explorerと組み合わせることで、かつてないほど簡単なin situデータ探索が実現します。迅速なデータ探索と知見の取得
Xenium Analyzerオンボード解析
ランの完了直後にデータの探索を始めましょう
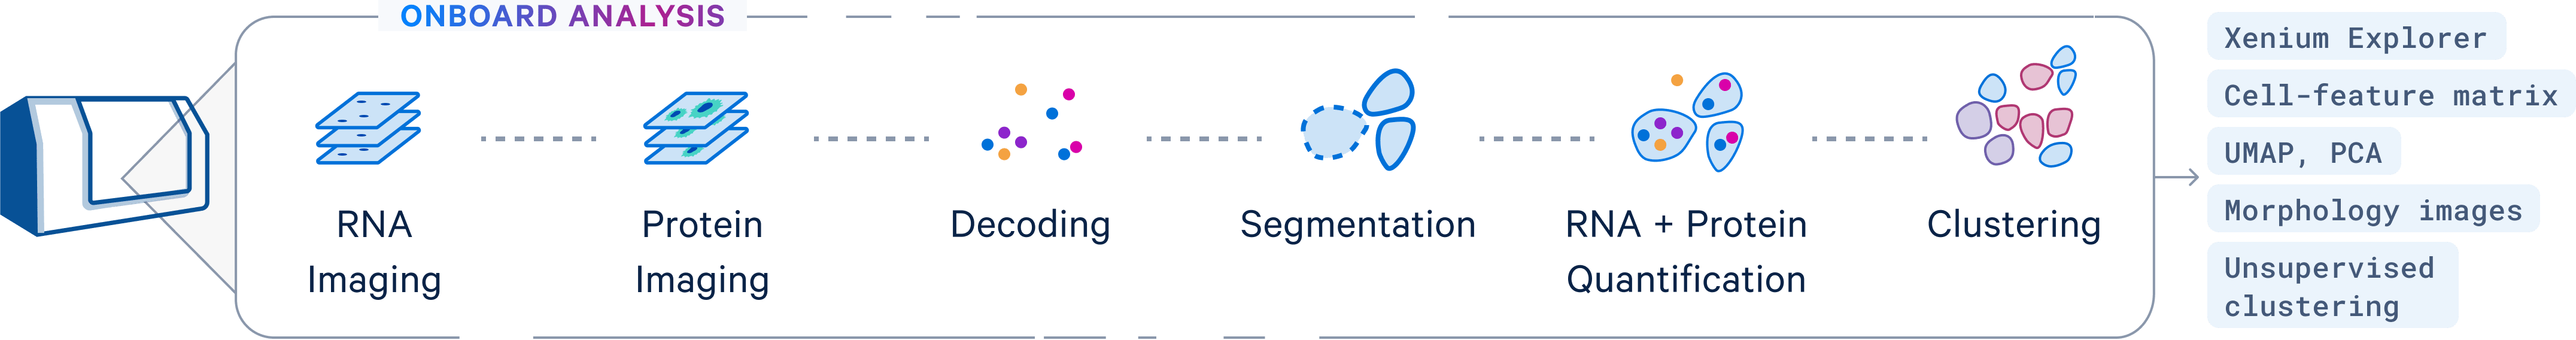
信頼性あるデータを迅速に
Xenium Explorerでデータを詳しく調べる前に、装置内でのQCを迅速かつ簡単に実行できます。マルチモーダル方式の細胞セグメンテーションを利用した真のシングルセル空間データの生成
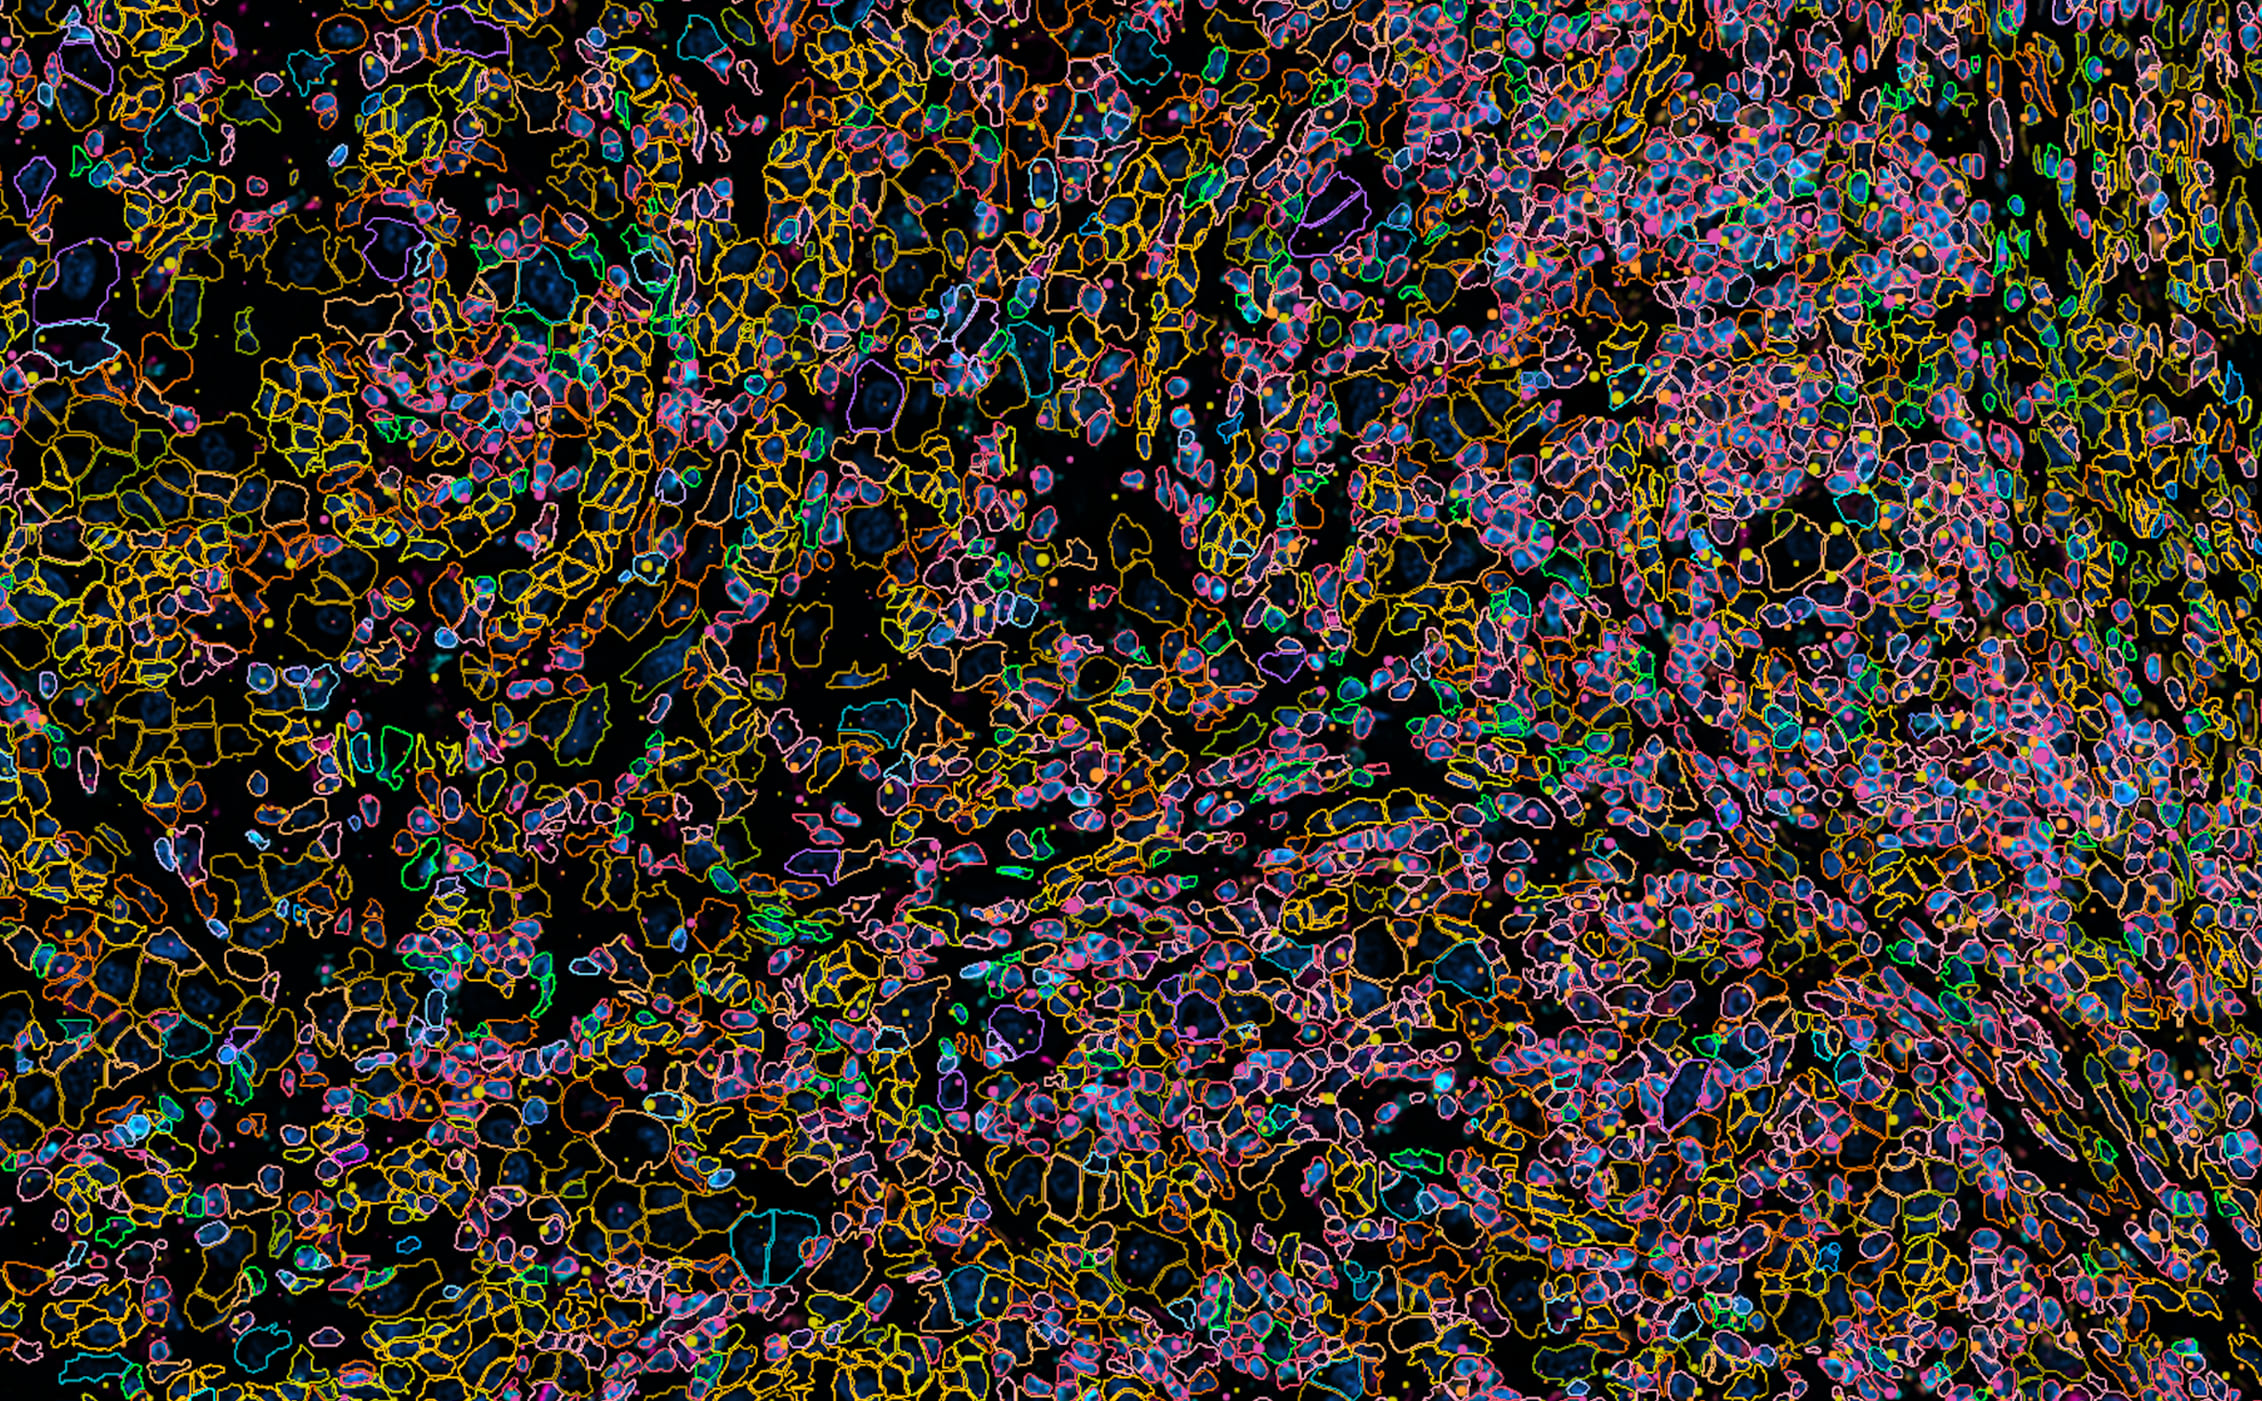
Xeniumデータで学習した10x GenomicsのAIアルゴリズムは、柔軟な細胞セグメンテーションを実現します。各細胞について利用可能な最良のシグナルを使用し、そのセグメンテーション法において各細胞にラベリングを実行します。どのような方法でもデータの保存/解析が自由に可能
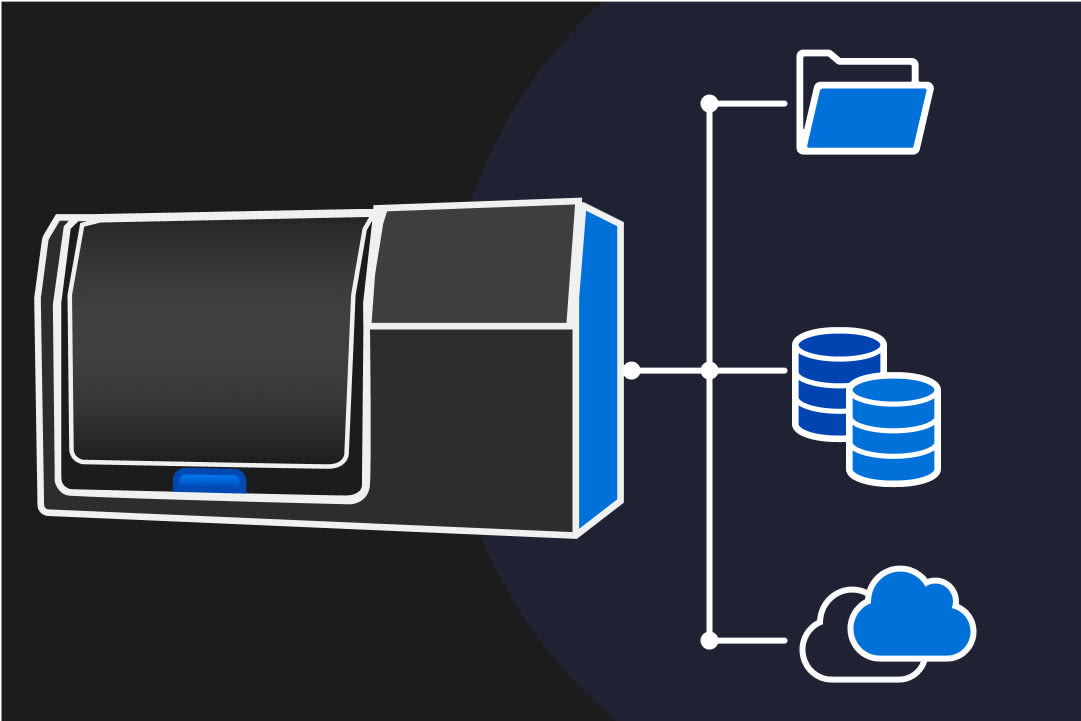
追加コストなしでデータを完全に所有
装置から取り出したデータをご指定の保存場所へ転送可能です。データはお客様のものであり、追加料金はかかりません。
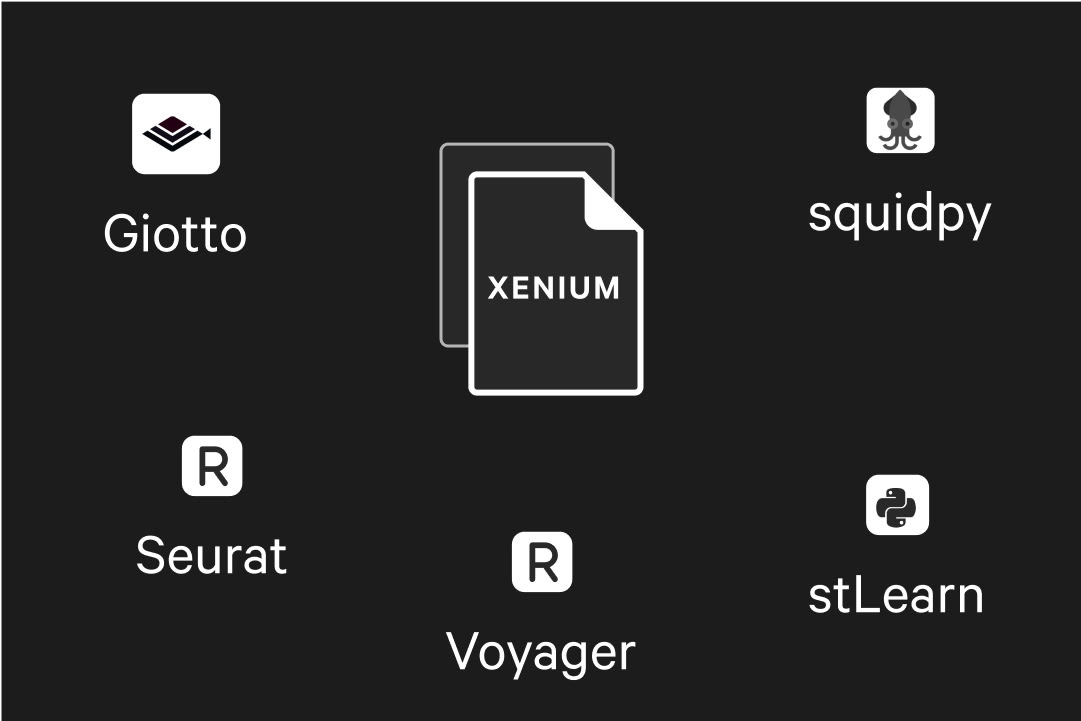
柔軟なオープンファイル形式により追加処理は不要
Xenium Analyzerはオープン形式でデータを生成するため、Xenium Explorerはもちろん、コミュニティソフトウェアでも利用できます。
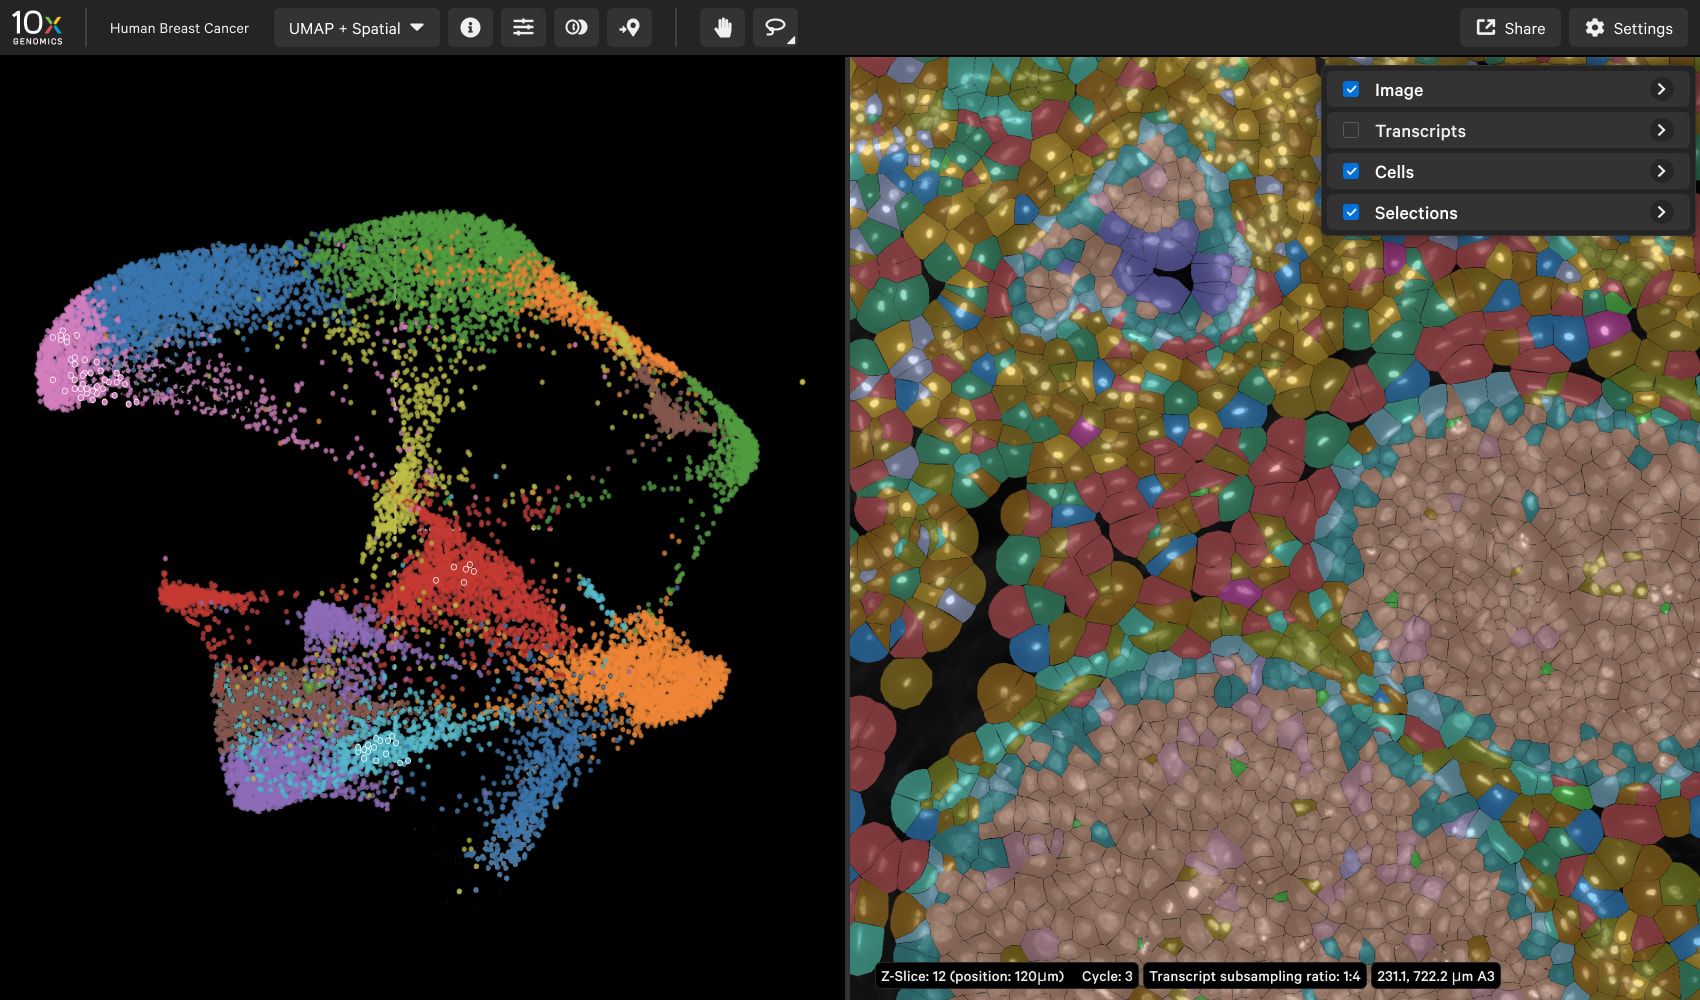
Xenium Explorer
全組織からシングル転写物までのシームレスな探索
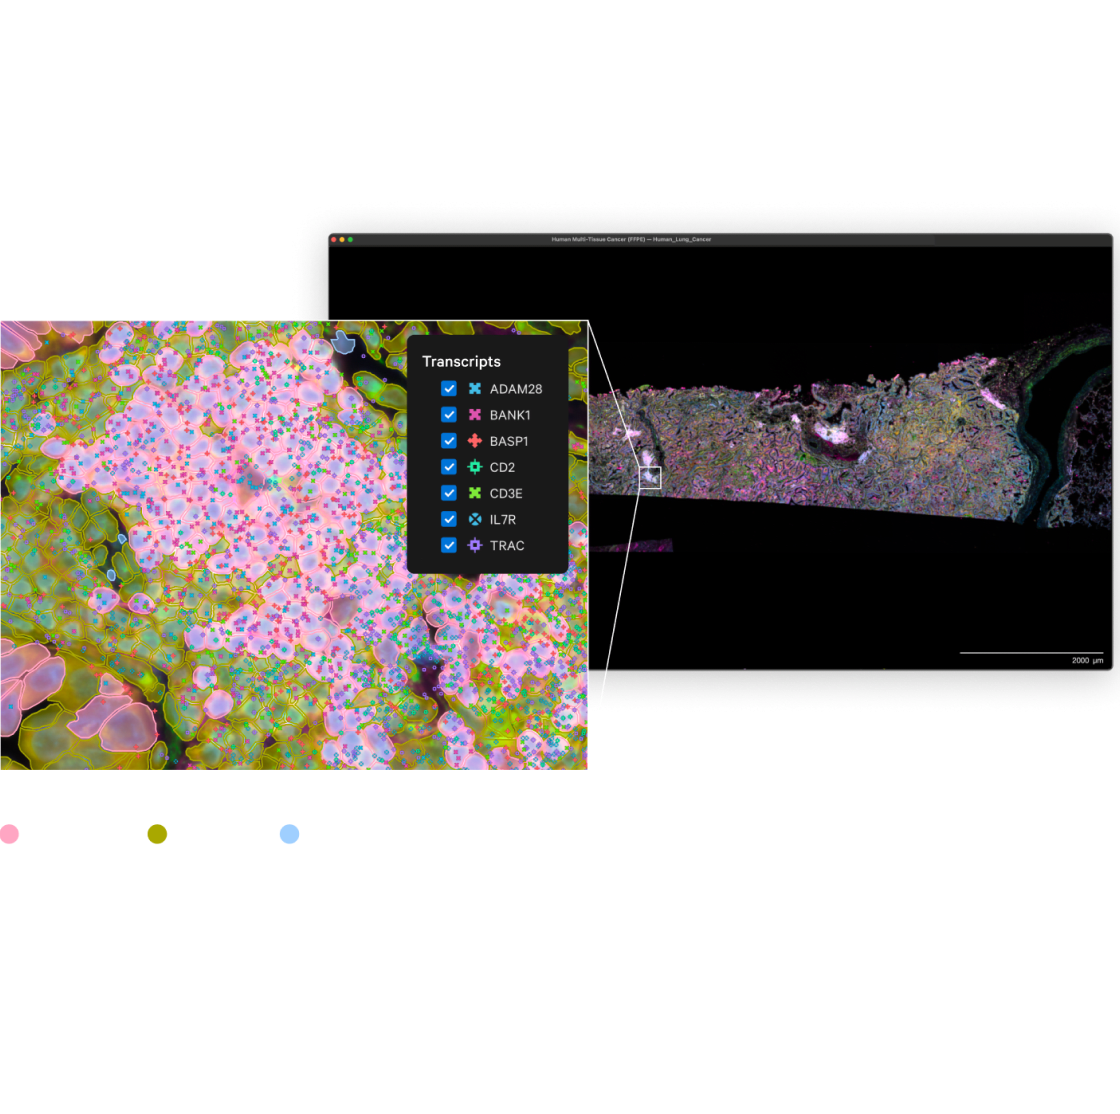
転写物の局在をあらゆるスケールで観察
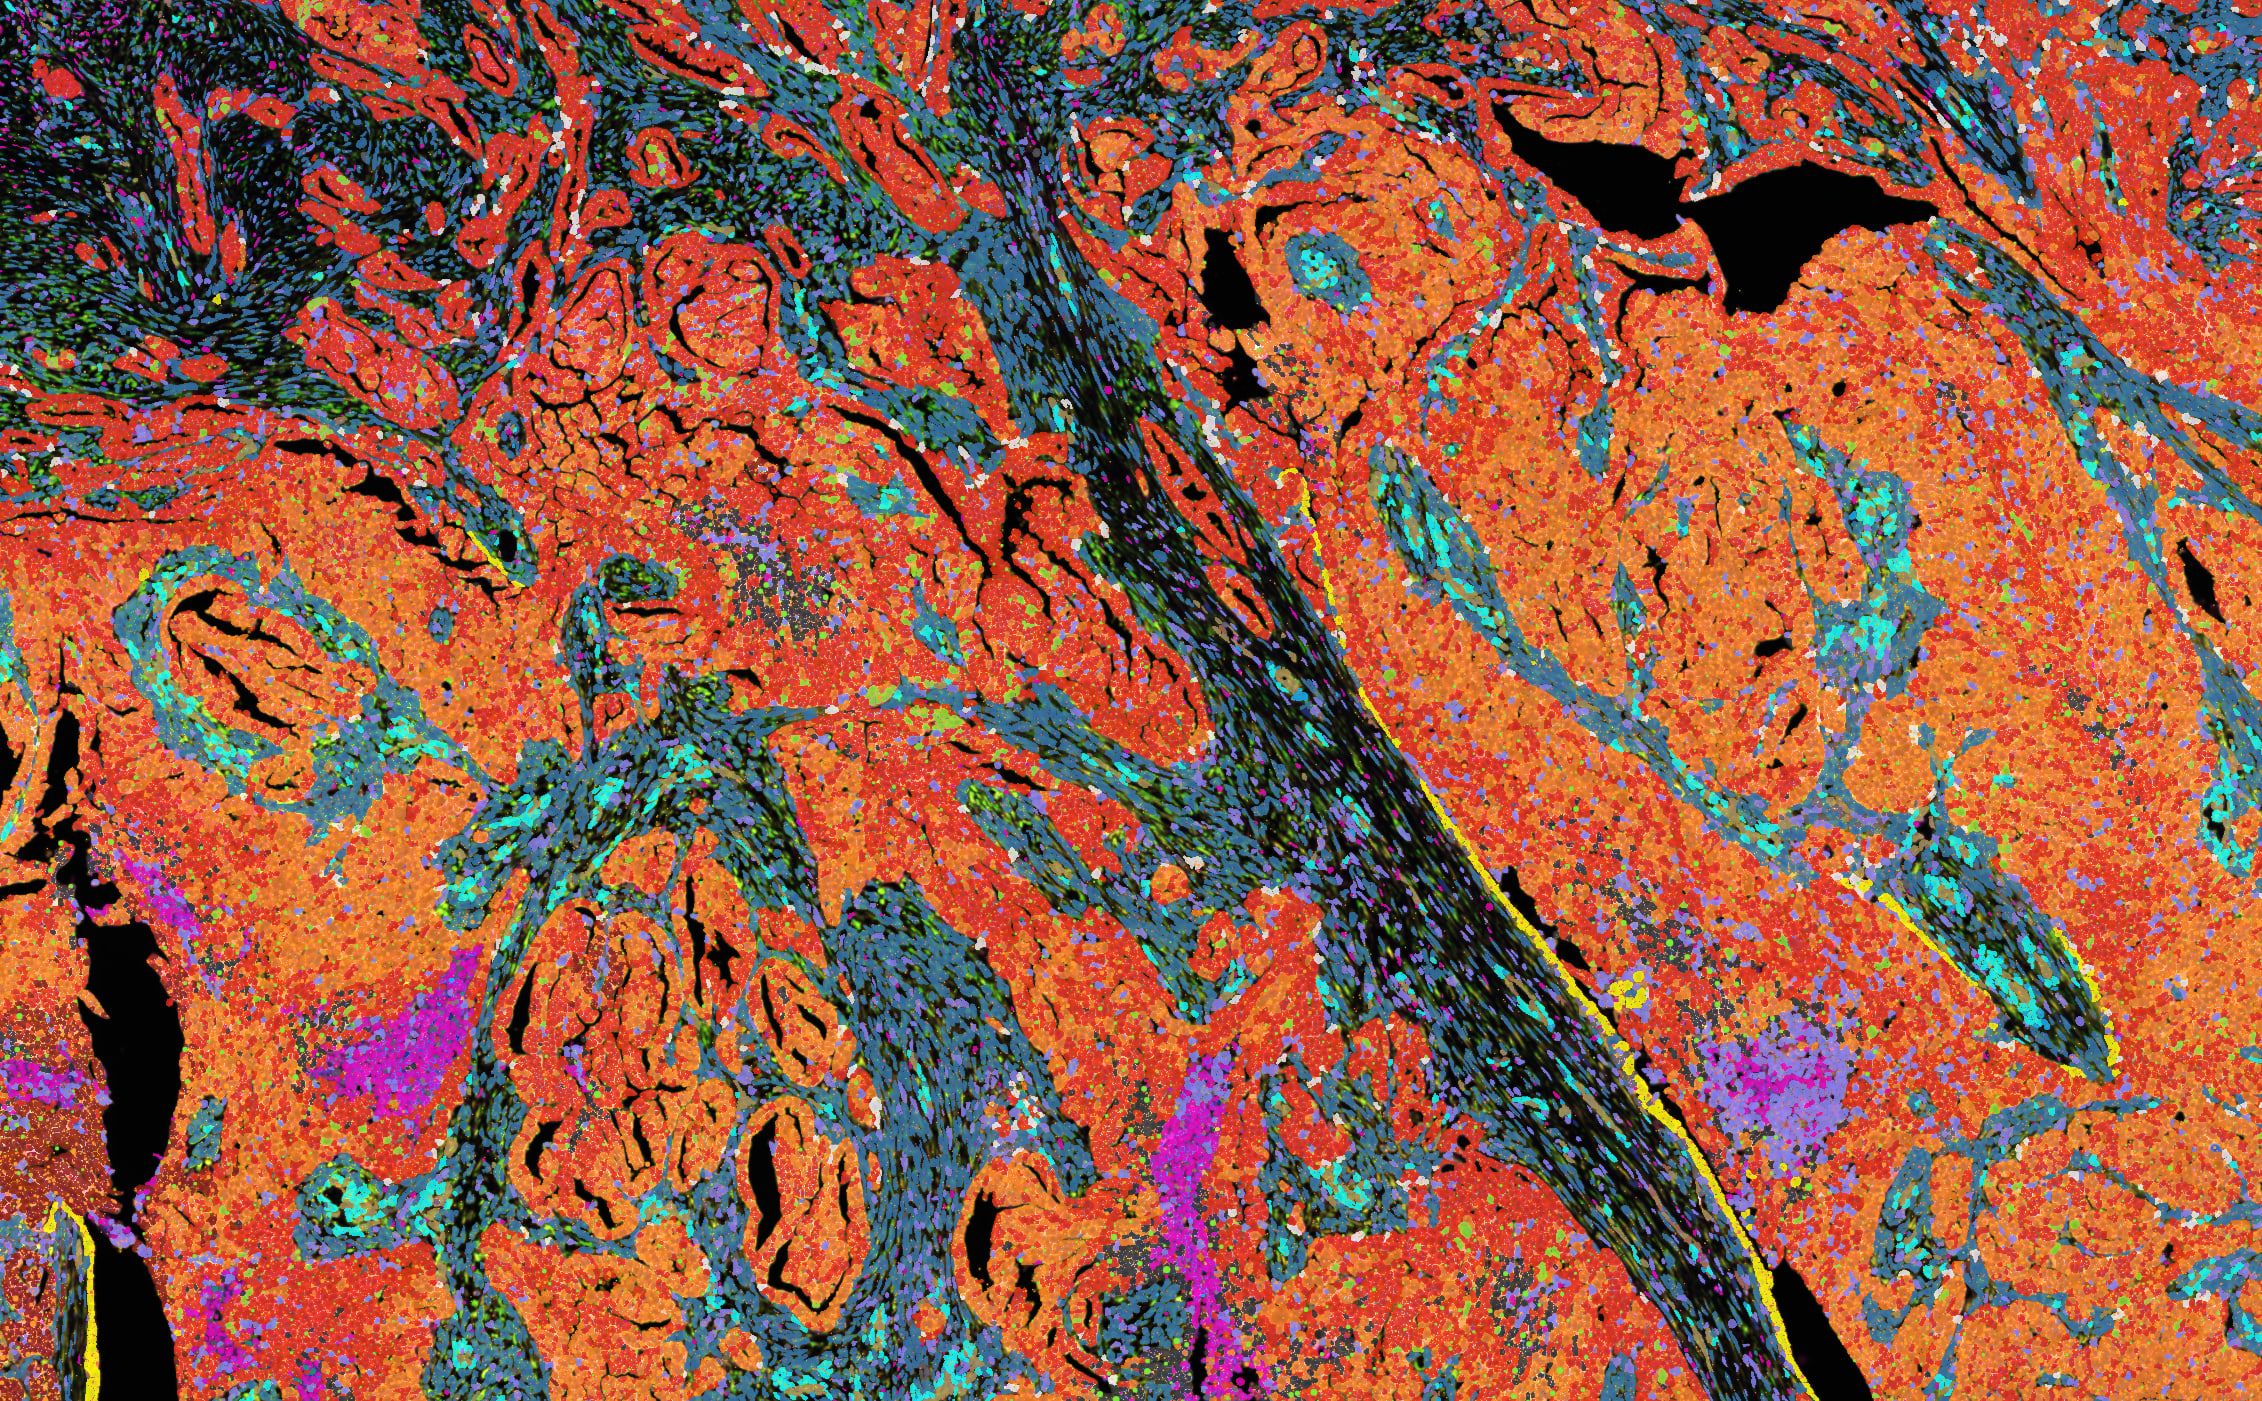
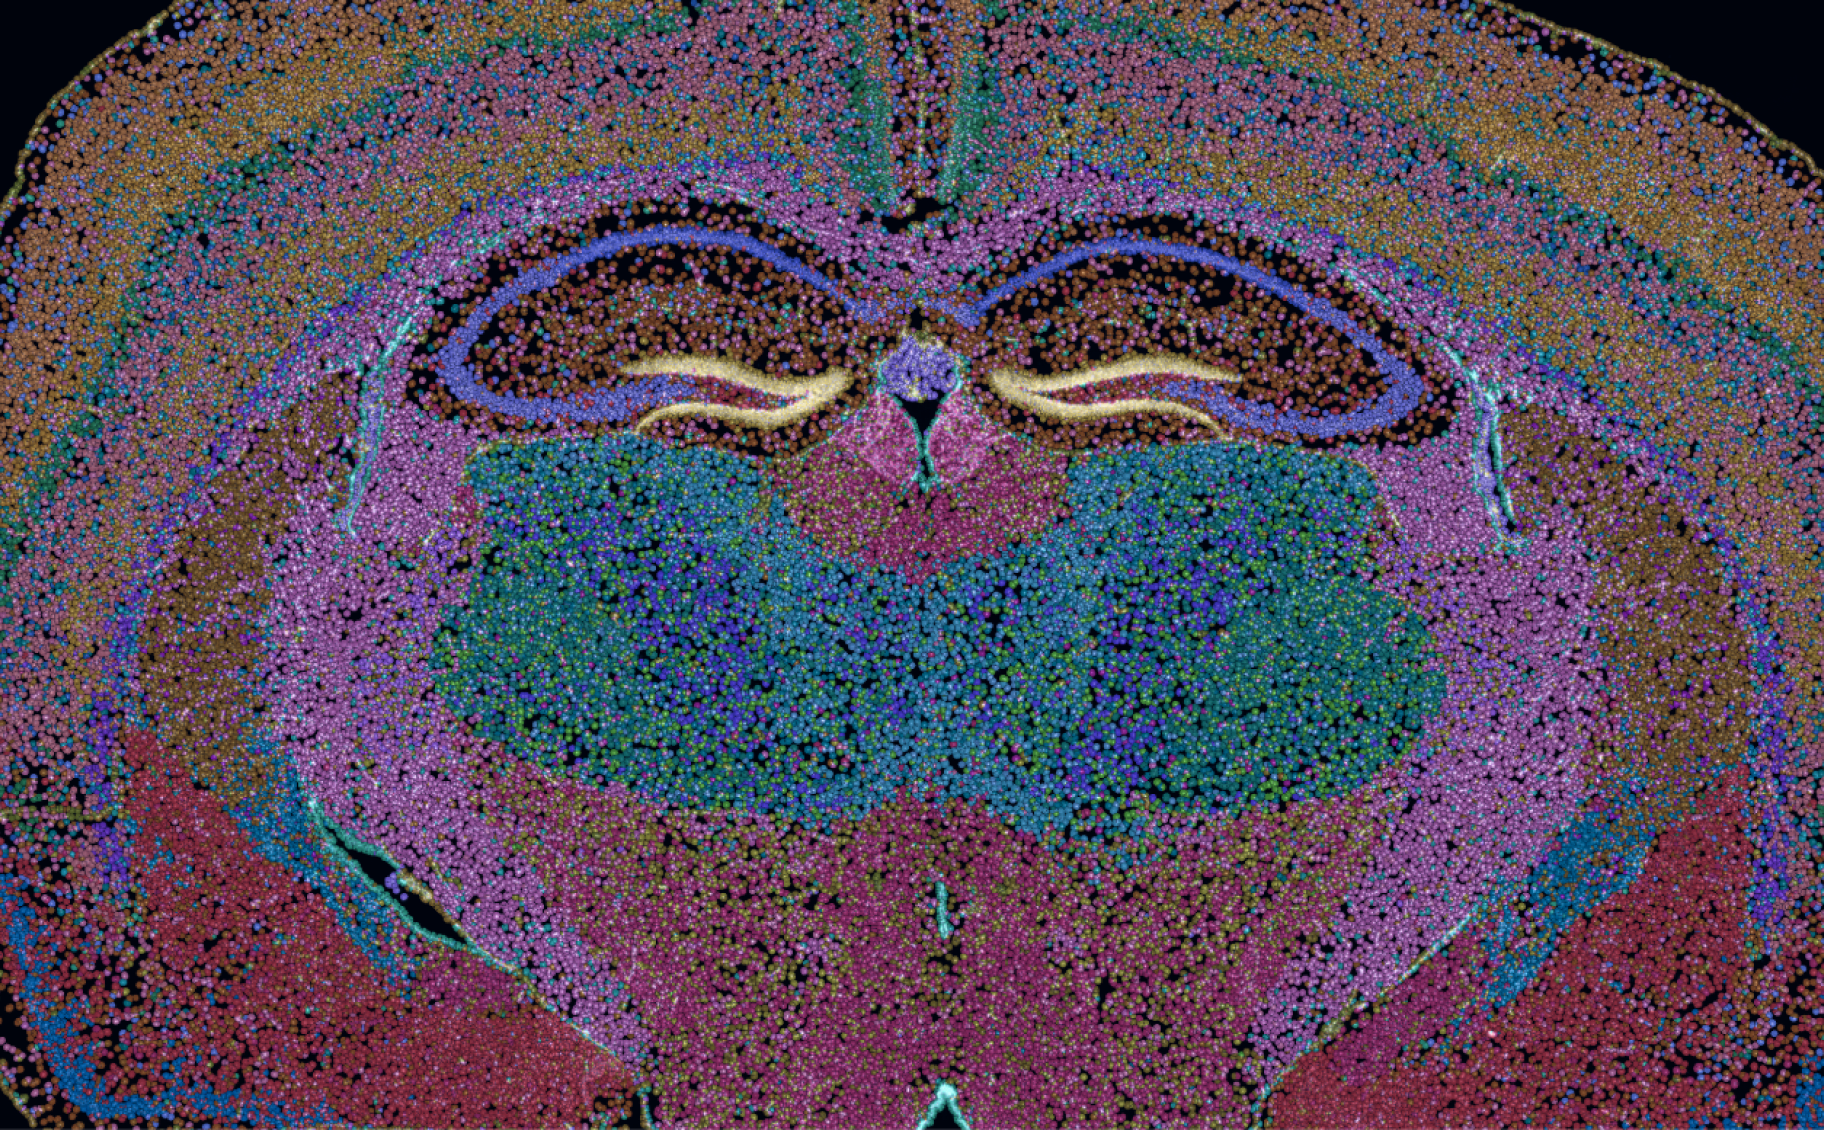
Xenium Explorerは、転写物のデータを視覚化するための高機能オプションを複数備えています。組織レベルでは、転写物の密度マップの表示や、転写物密度に基づく細胞の色分け表示が可能です。細胞レベルでは、個々の転写物情報を拡大表示できます。遺伝子発現とタンパク質発現の相関
Xenium Explorerで、細胞ごとの遺伝子発現とタンパク質発現を単一のキャンバスで視覚化します。遺伝子発現およびcellular neighborhood(細胞の近接関係)を比較
ユニークな空間的ニッチを見つけたら、なげなわツールを利用することで、さまざまな組織微小環境における遺伝子発現を簡単に比較することができます。病理ワークフローとの統合
Xeniumのデータを同一切片のHE画像やDAPI画像とシームレスに重ね合わせて探索することができます。IF画像を重ねてRNAとタンパク質の関連性を探索
シンプルなインターフェースで、同じ切片のHE画像とIF画像をXenium Explorerに直接登録して表示できます。
今後リリース予定
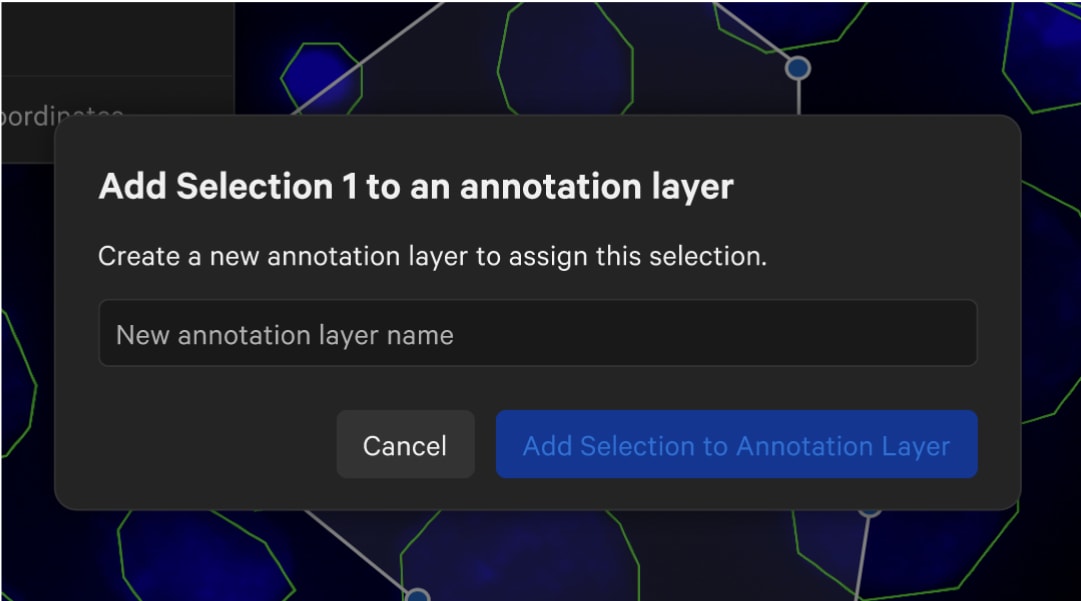
病理学的アノテーションの作成
HEまたはIFの画像における組織構造にアノテーションを加え、分子的な測定結果と直接比較します。
UMAPの投影を探索
Xeniumのシングルセルデータを使い慣れた次元圧縮法で投影し探索する。
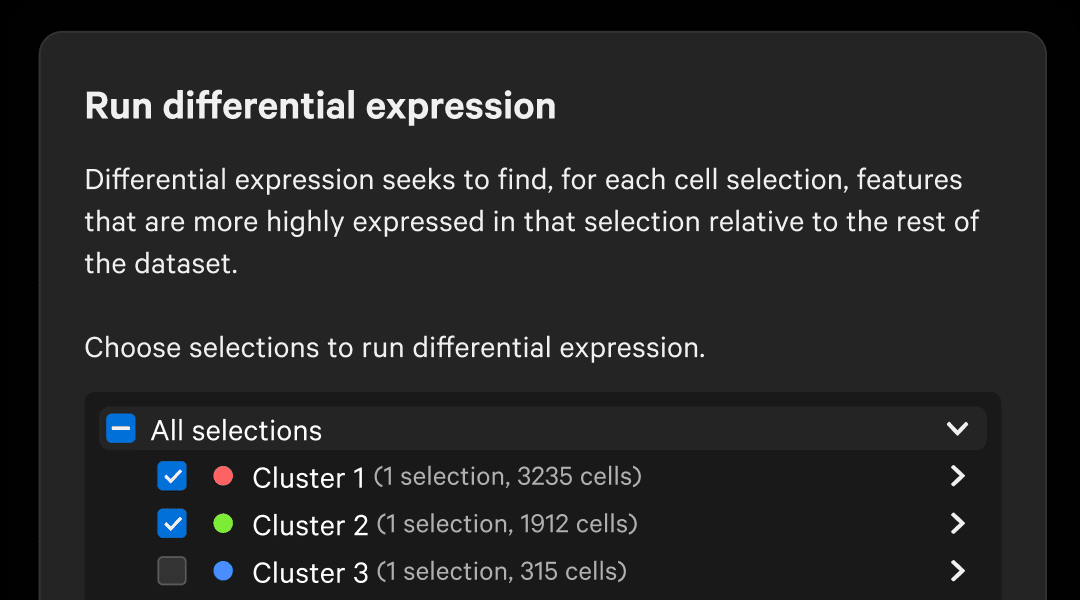
シングルセルに似たような解析
細胞の種類やクラスターの定義づけ、領域間の発現変動解析、高解像度な図の出力が可能です。
Xenium Ranger
Xenium Rangerでデータを再解析し、Xenium Explorerで視覚化する
セグメンテーションのインポート
サードパーティーのツールで作成したセグメンテーション結果を用いてXenium Rangerで転写物を再割り当てし、Xenium Explorerで視覚化できます。
再セグメント
最新の細胞セグメンテーションモデルとアルゴリズムを使用し、最適な染色法を選択し、パラメーターをカスタマイズして、Xeniumデータを再セグメンテーションします。
再ラベリング
Xenium Analyzerのランの後、転写物に再ラベリングが必要な場合は、「再ラベリング用パイプライン」を使用してXeniumデータの修正を行います。