Atera World Tour 2026
Find a stop near youBuilt for rapid data exploration and insights
Start exploring the data right after a run completes
Immediate confidence in your data
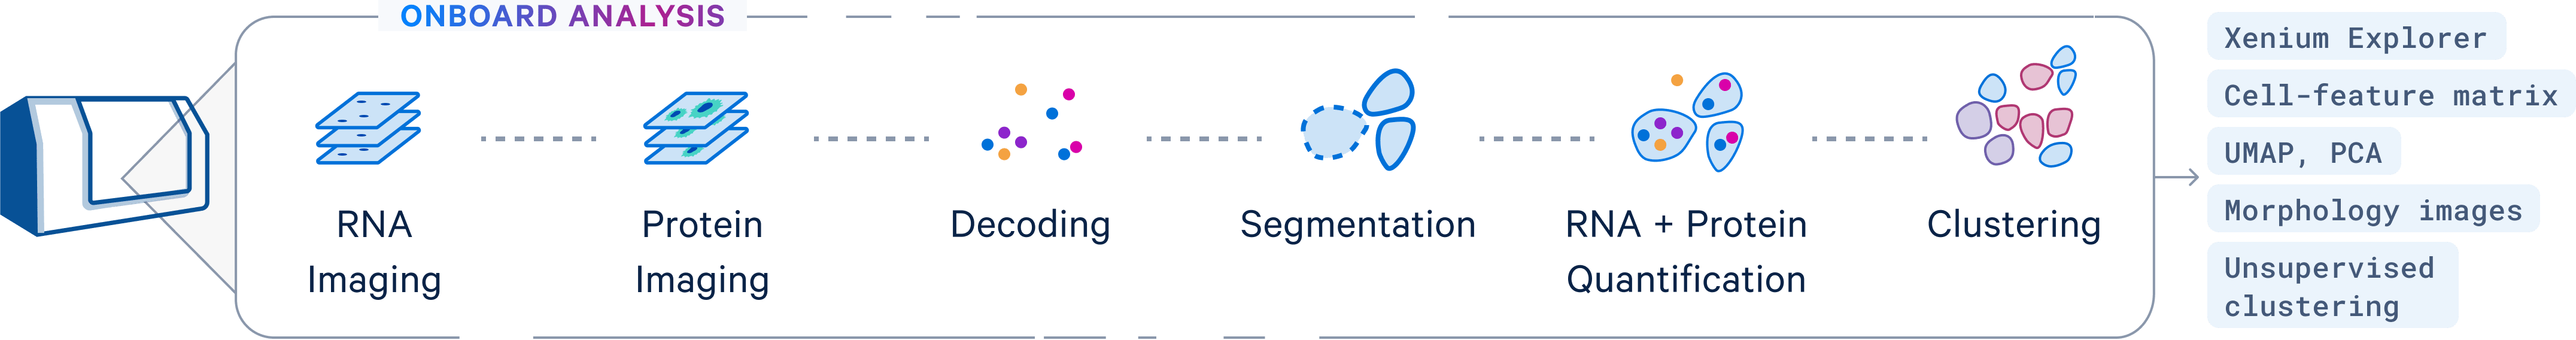
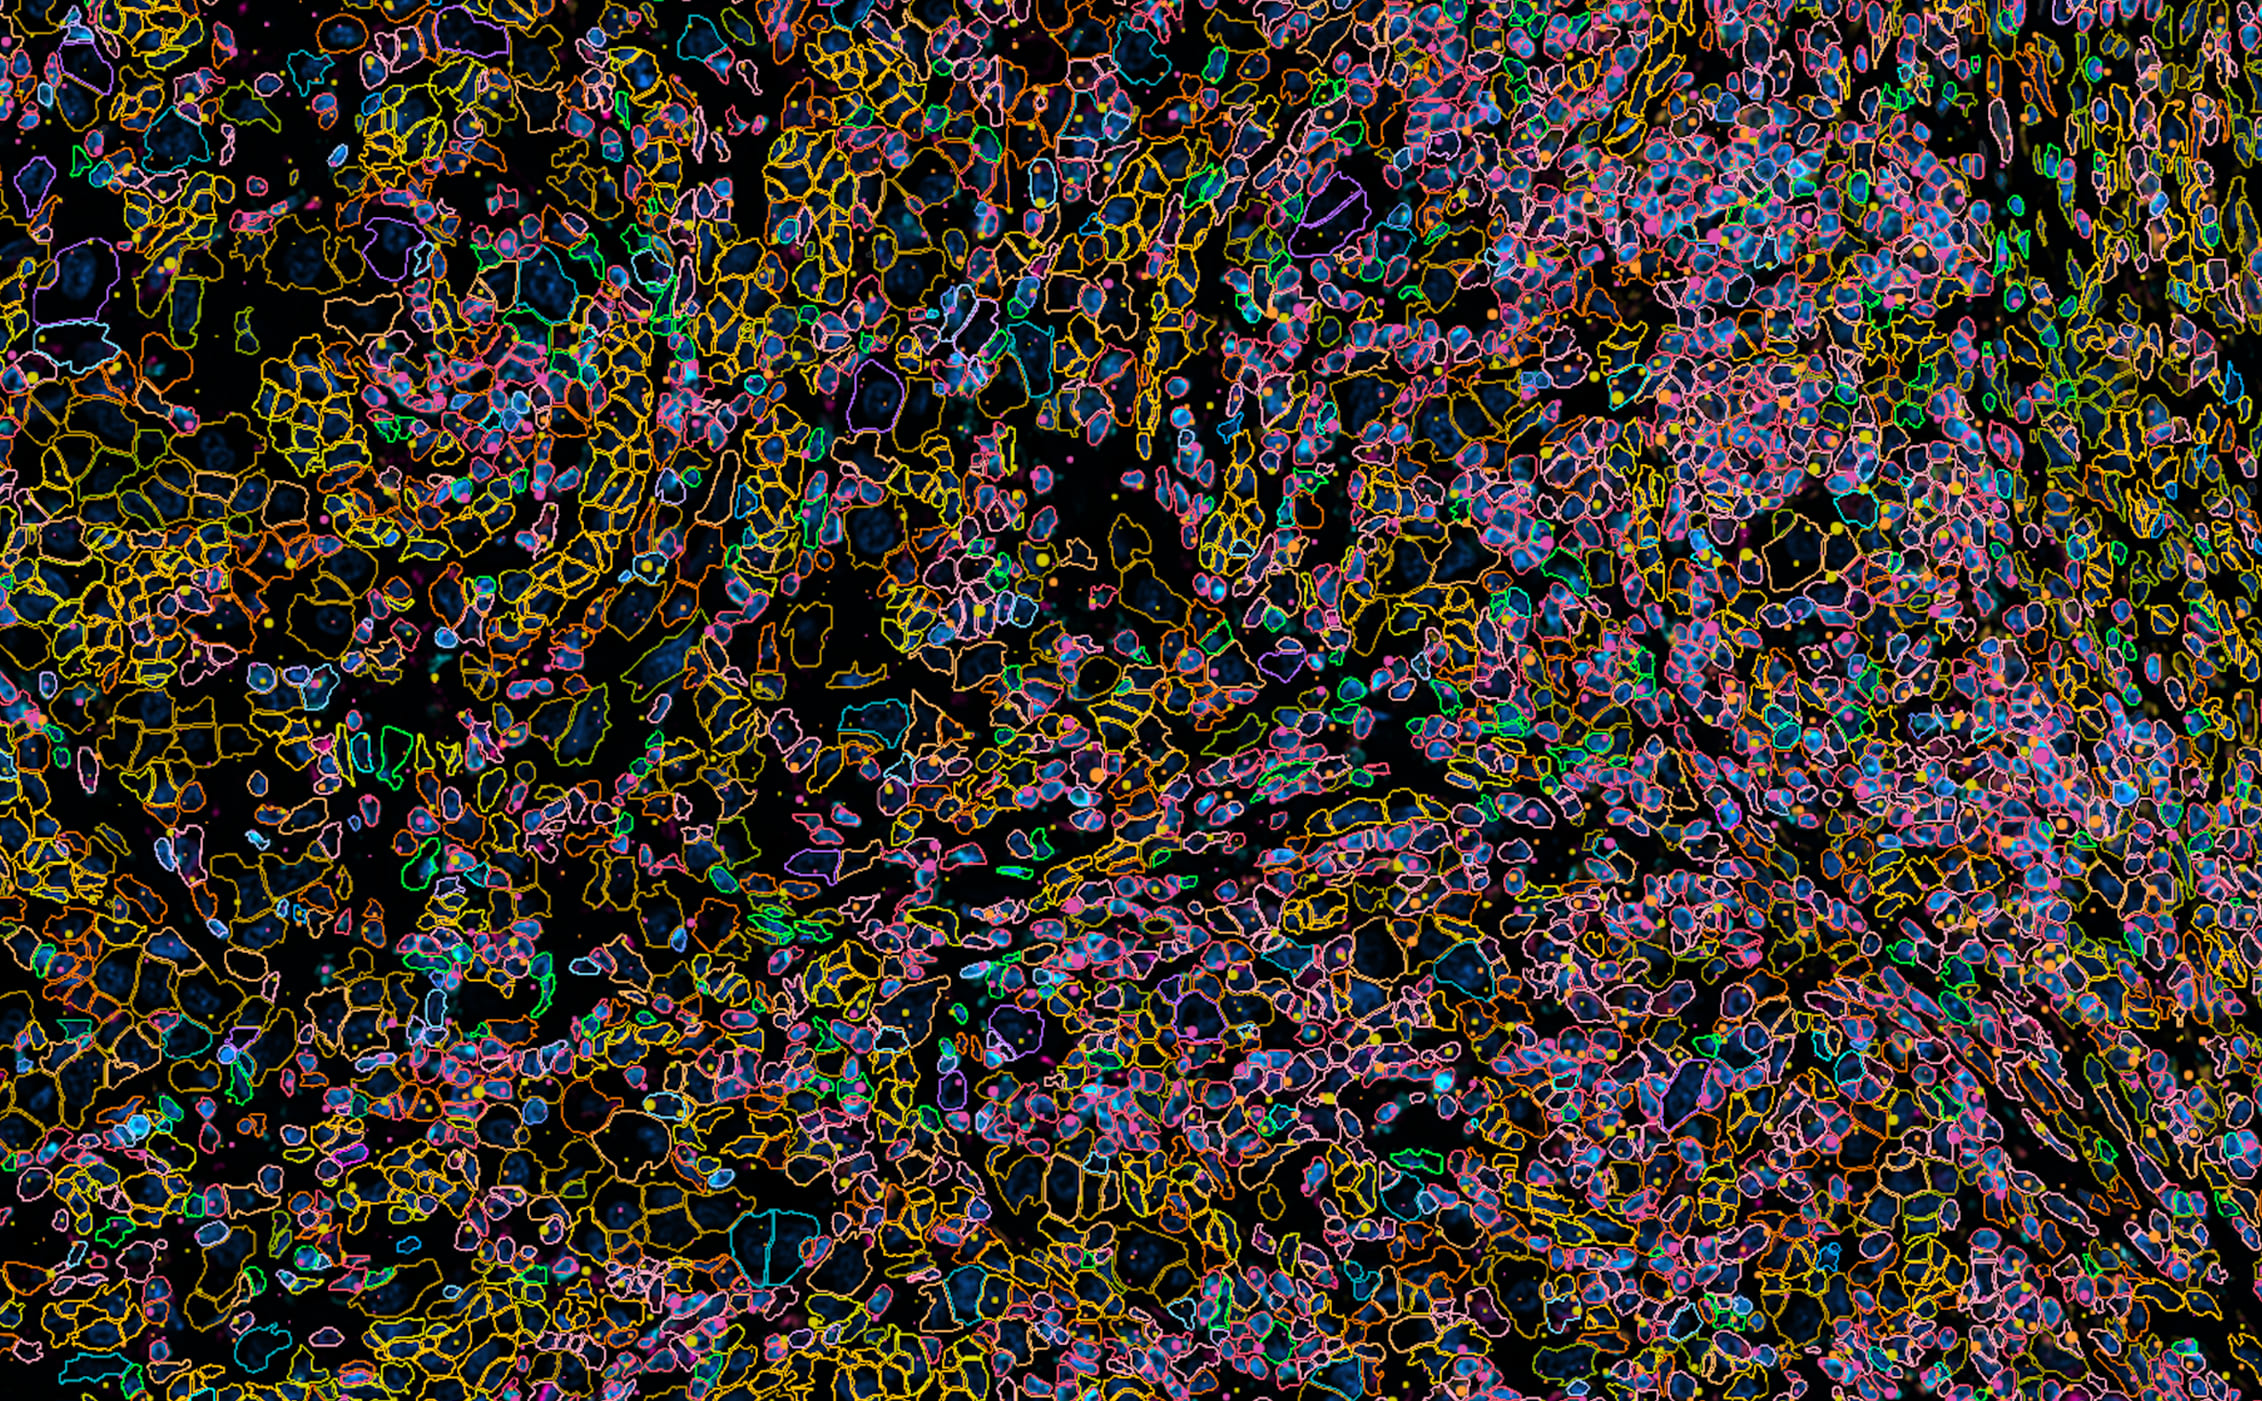
Perform on instrument QC quickly and easily before exploring the data further in Xenium Explorer.Generate true single cell spatial data with multimodal segmentation
Trained on Xenium data, our AI algorithm provides flexible segmentation. It uses the best available signal for each cell and labels each cell with its segmentation method.Freedom to store and analyze your data however you choose
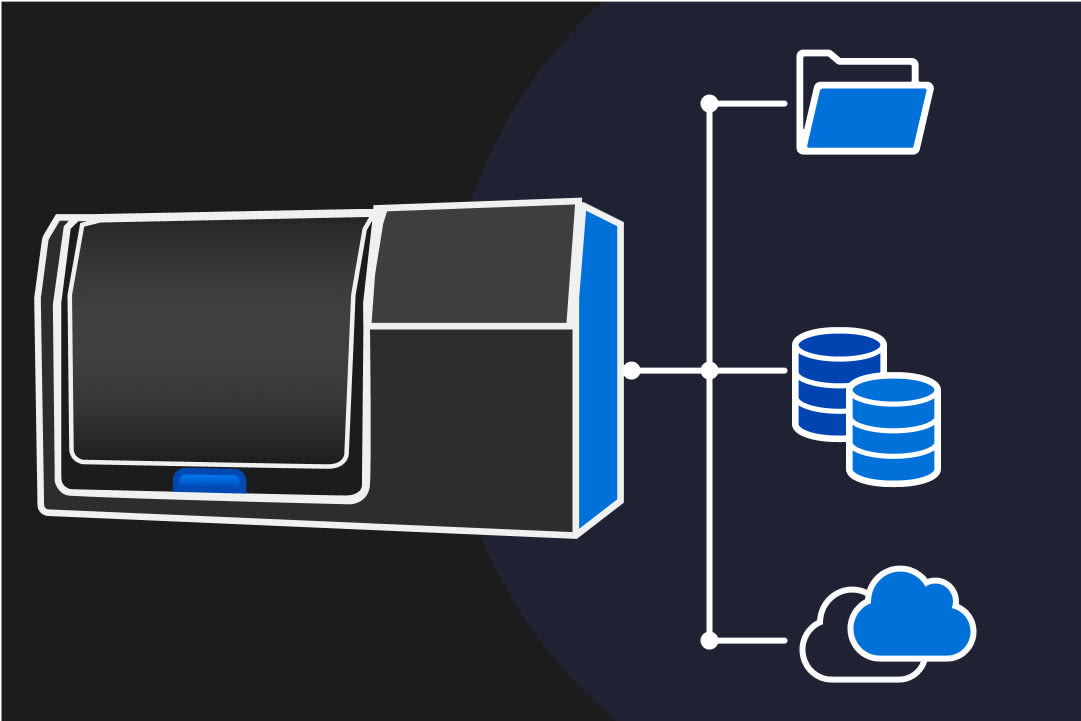
Keep full ownership of your data at no extra cost
Transfer data from the instrument to a storage location of your choosing. Your data is yours, at no additional charge.
Flexible open file formats without additional processing
Xenium Analyzer generates data in open formats, allowing you to use them with Xenium Explorer or community software.
Seamless exploration for spatial discovery
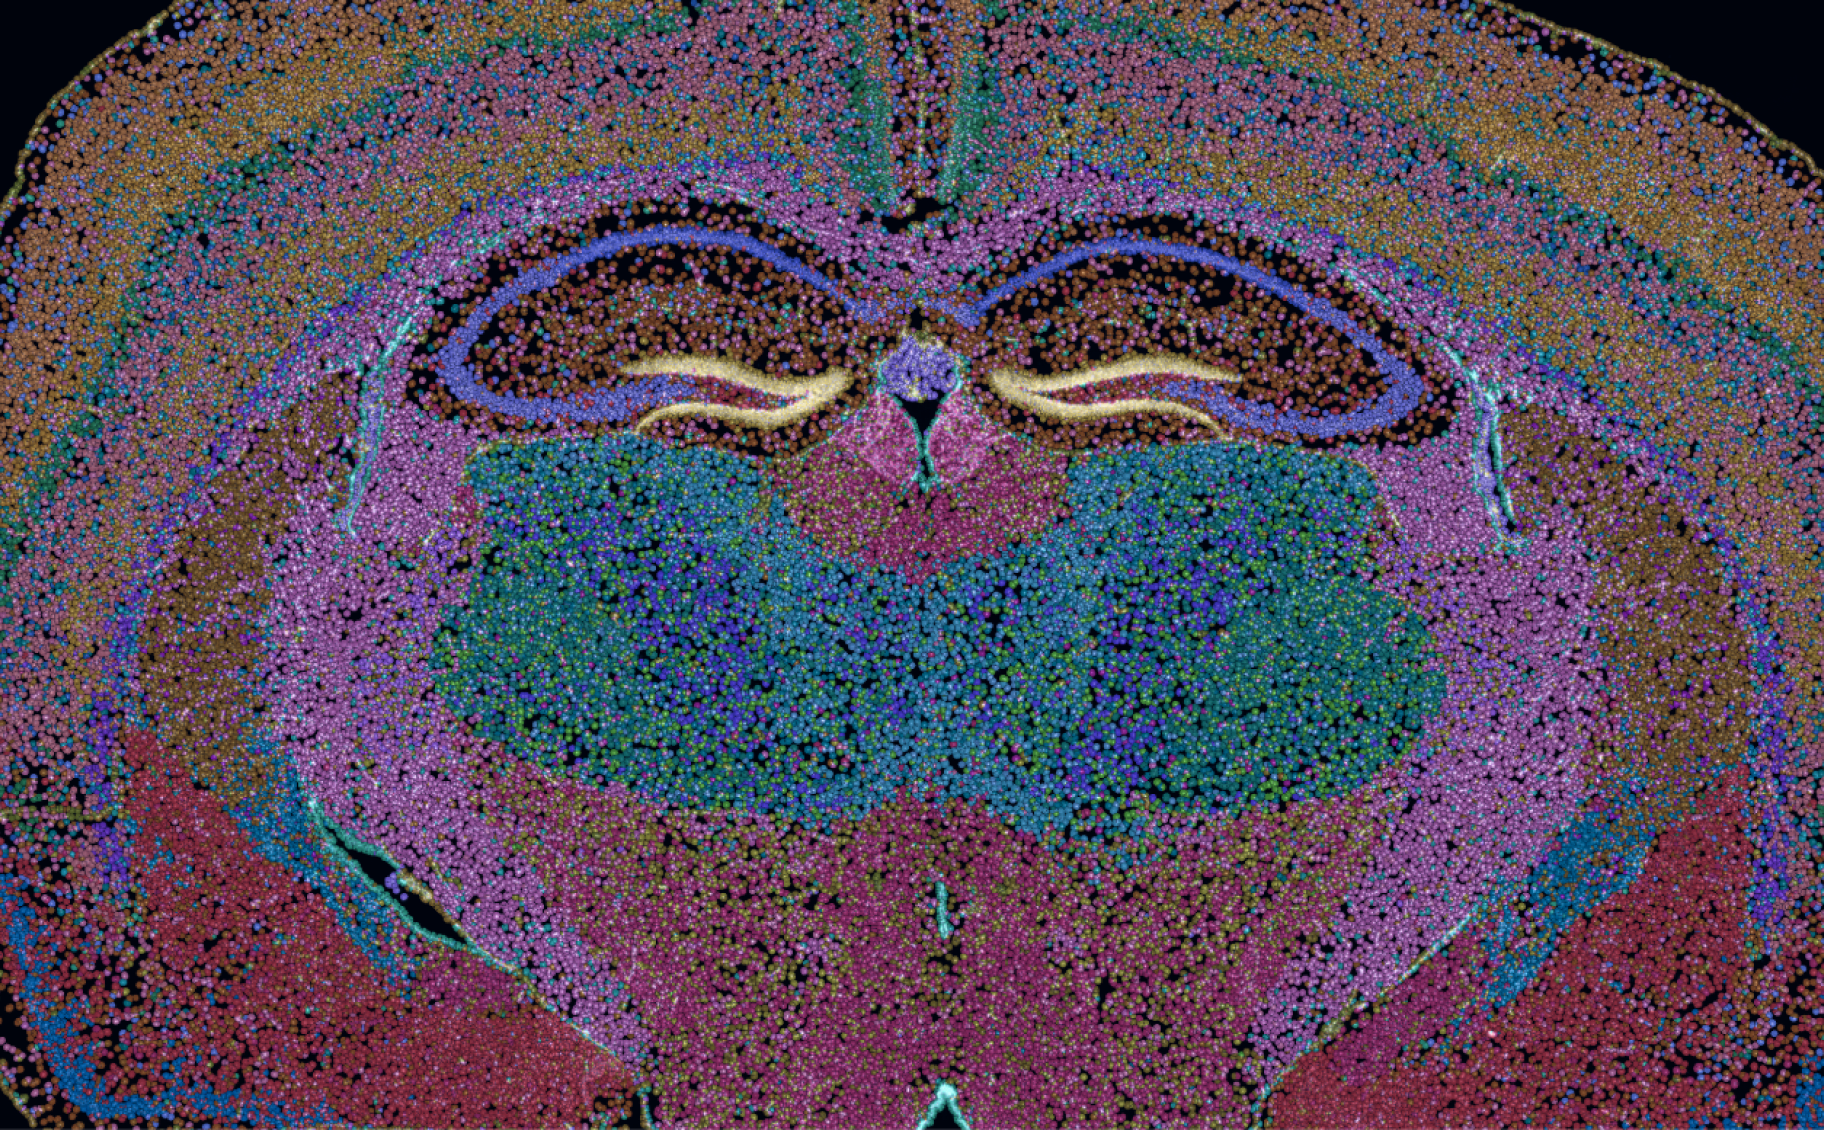
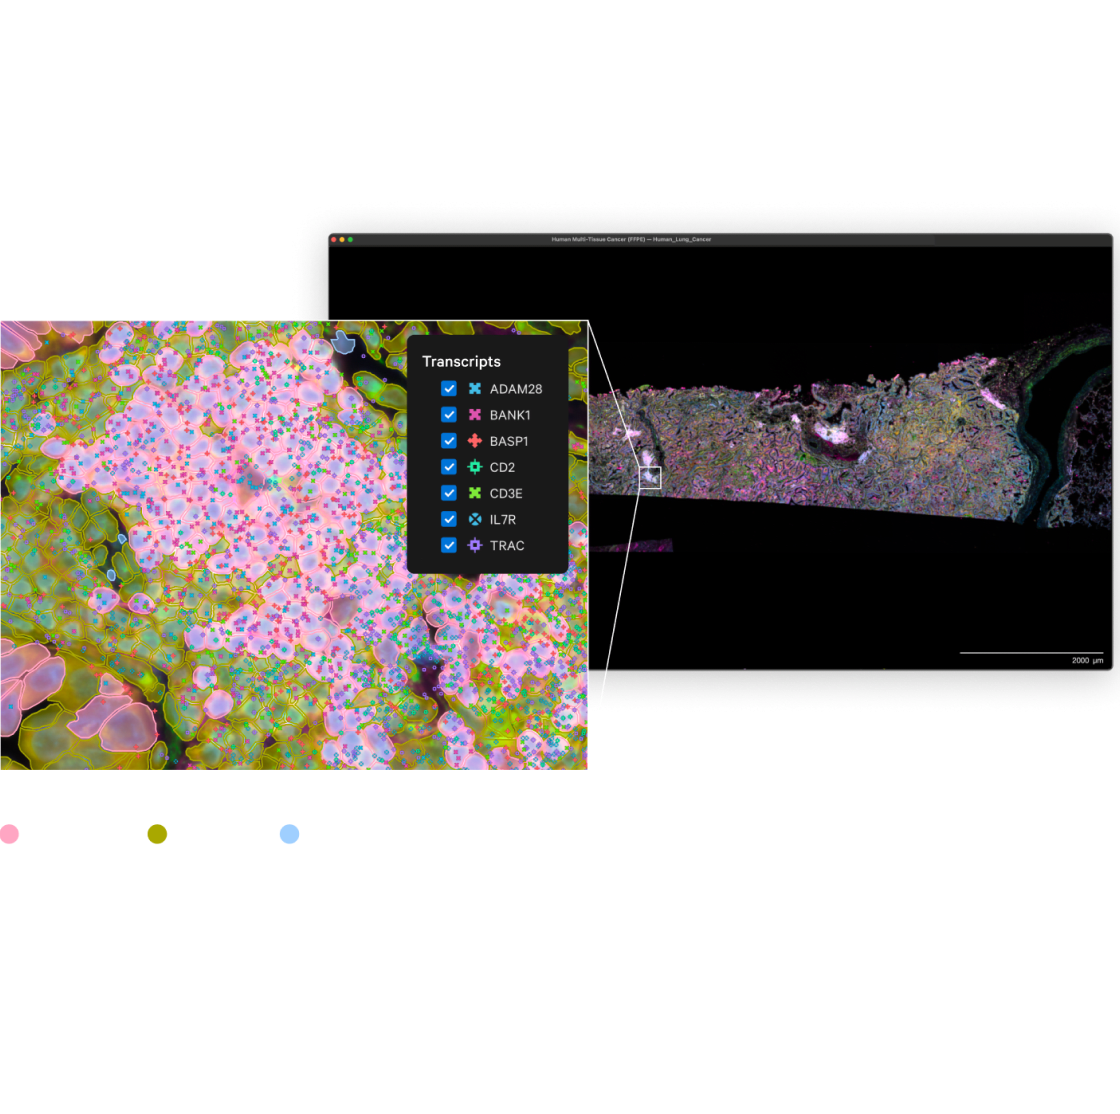
View transcript localization at any scale
Xenium Explorer provides multiple high-performance options to visualize transcript data. At the tissue level, view a transcript density map or color cells by transcript density. At the cell level, zoom in to individual transcripts.Correlate gene and protein expression
Visualize per-cell gene and protein expression in a single canvas in Xenium Explorer.Compare gene and protein expression in cellular neighborhoods
Locate unique spatial niches then leverage the lasso tool to easily compare gene and optional protein expression in different tissue microenvironments.Integrate with pathology workflows
Seamlessly import, align, and explore Xenium data directly overlaid on post-Xenium H&E or IF images from the same section.
More features coming in future releases
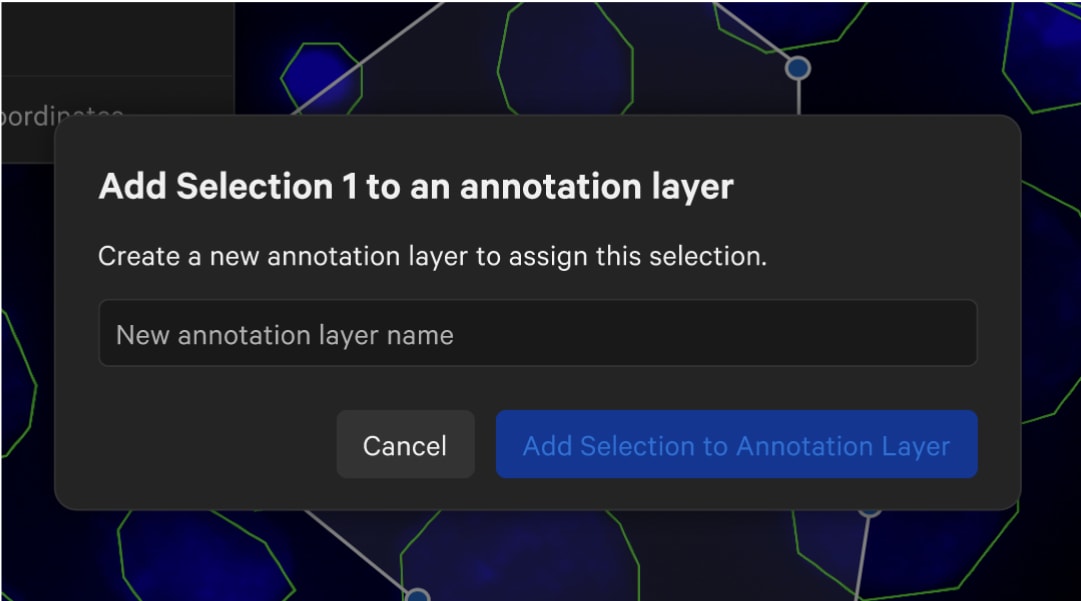
Create pathology annotations
Annotate structures on H&E or IF images and compare to the molecular readout.
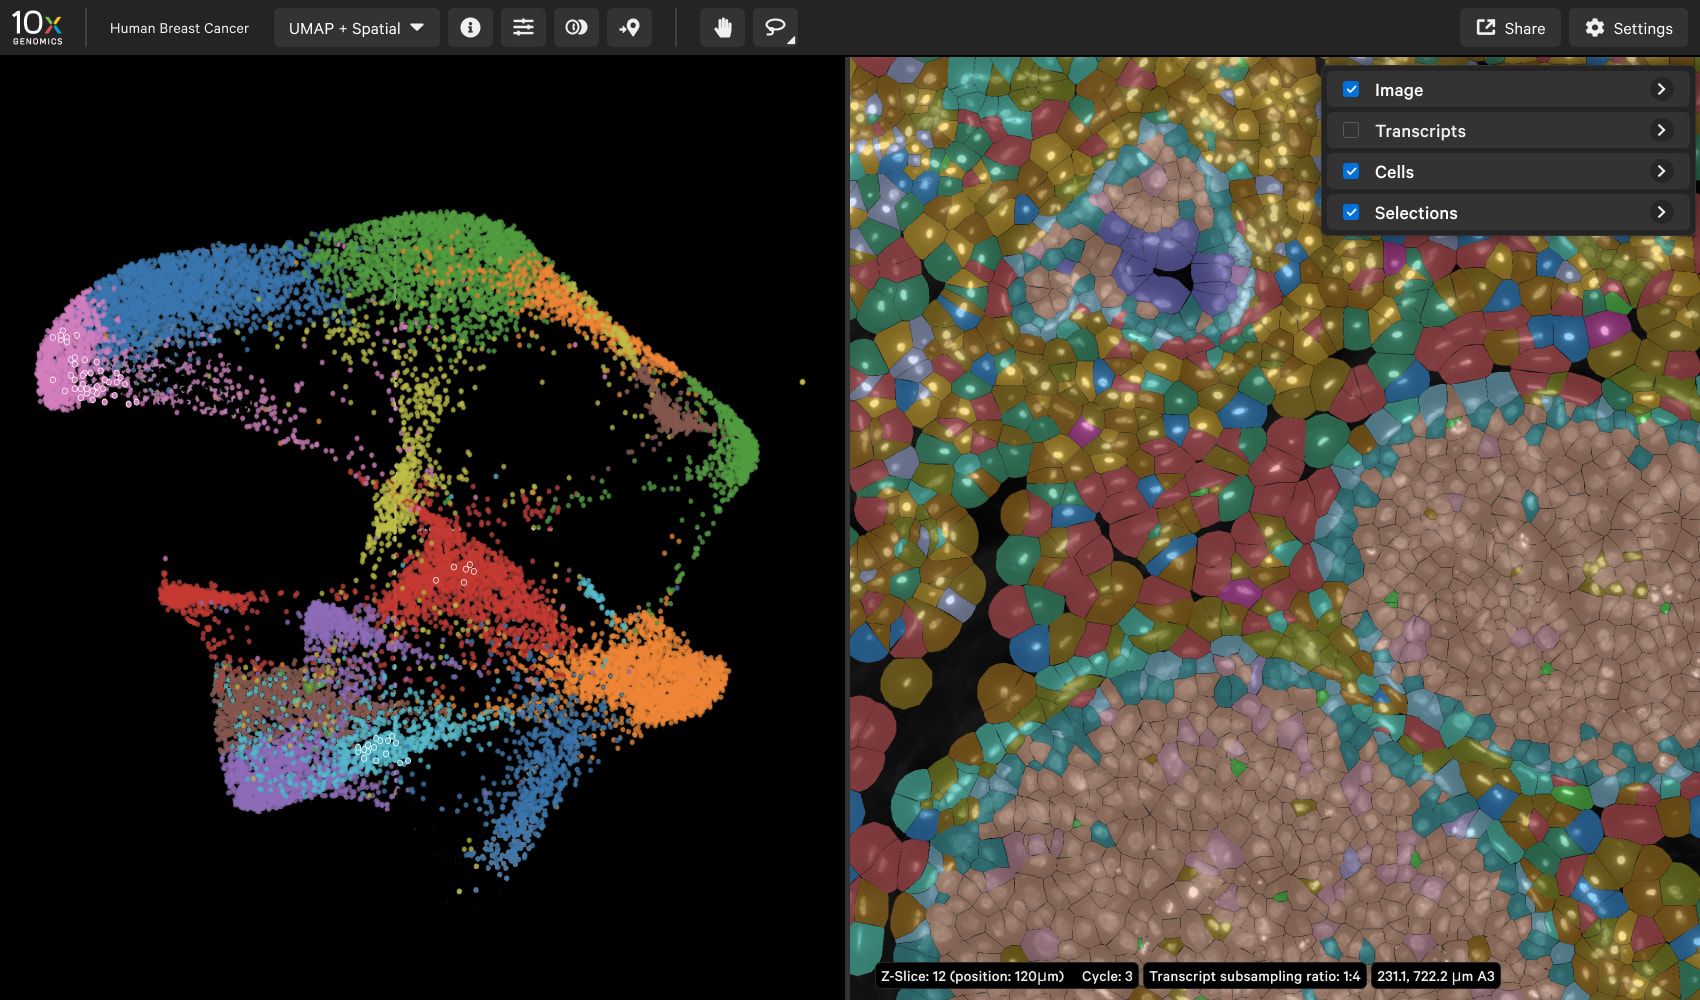
Explore UMAP projection
Explore Xenium single cell data in a familiar dimensionality reduced projection.
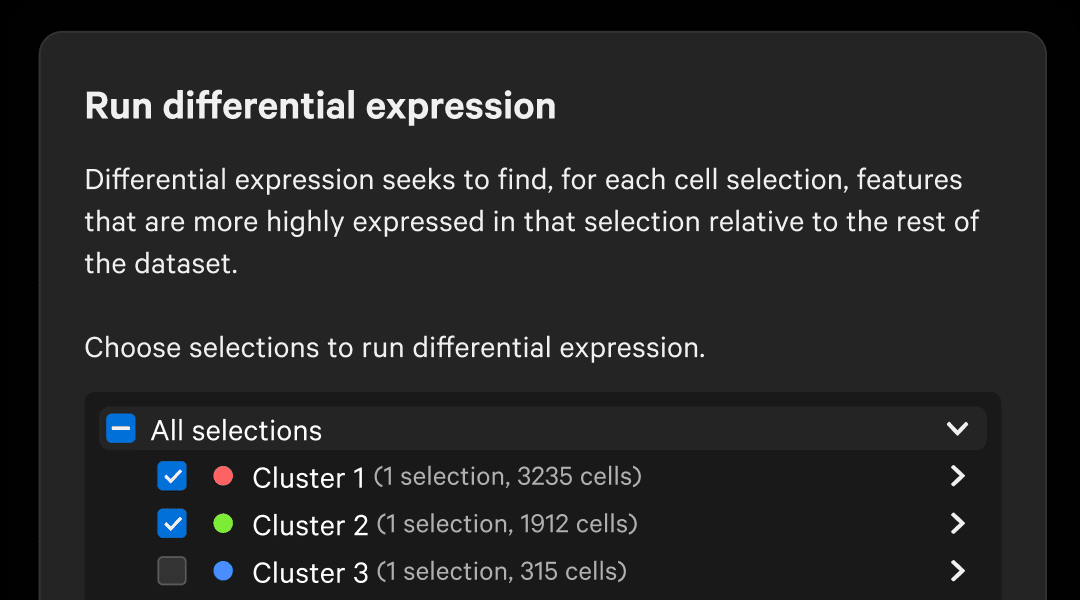
Perform single cell style analysis
Define cell types and clusters, run differential expression, and export high-res figures.
Reanalyze data with Xenium Ranger then visualize in Xenium Explorer
Import segmentation
Reassign transcripts in Xenium Ranger using segmentation results produced by a 3rd party tool and visualize in Xenium Explorer.
Resegment
Select the best stains and customize parameters to resegment Xenium data using our latest cell segmentation models and algorithm.
Relabel
Need to relabel transcripts after a Xenium Analyzer run? Use the Relabel pipeline to produce fully corrected Xenium data.
Discover Xenium data
Human Renal Cell Carcinoma
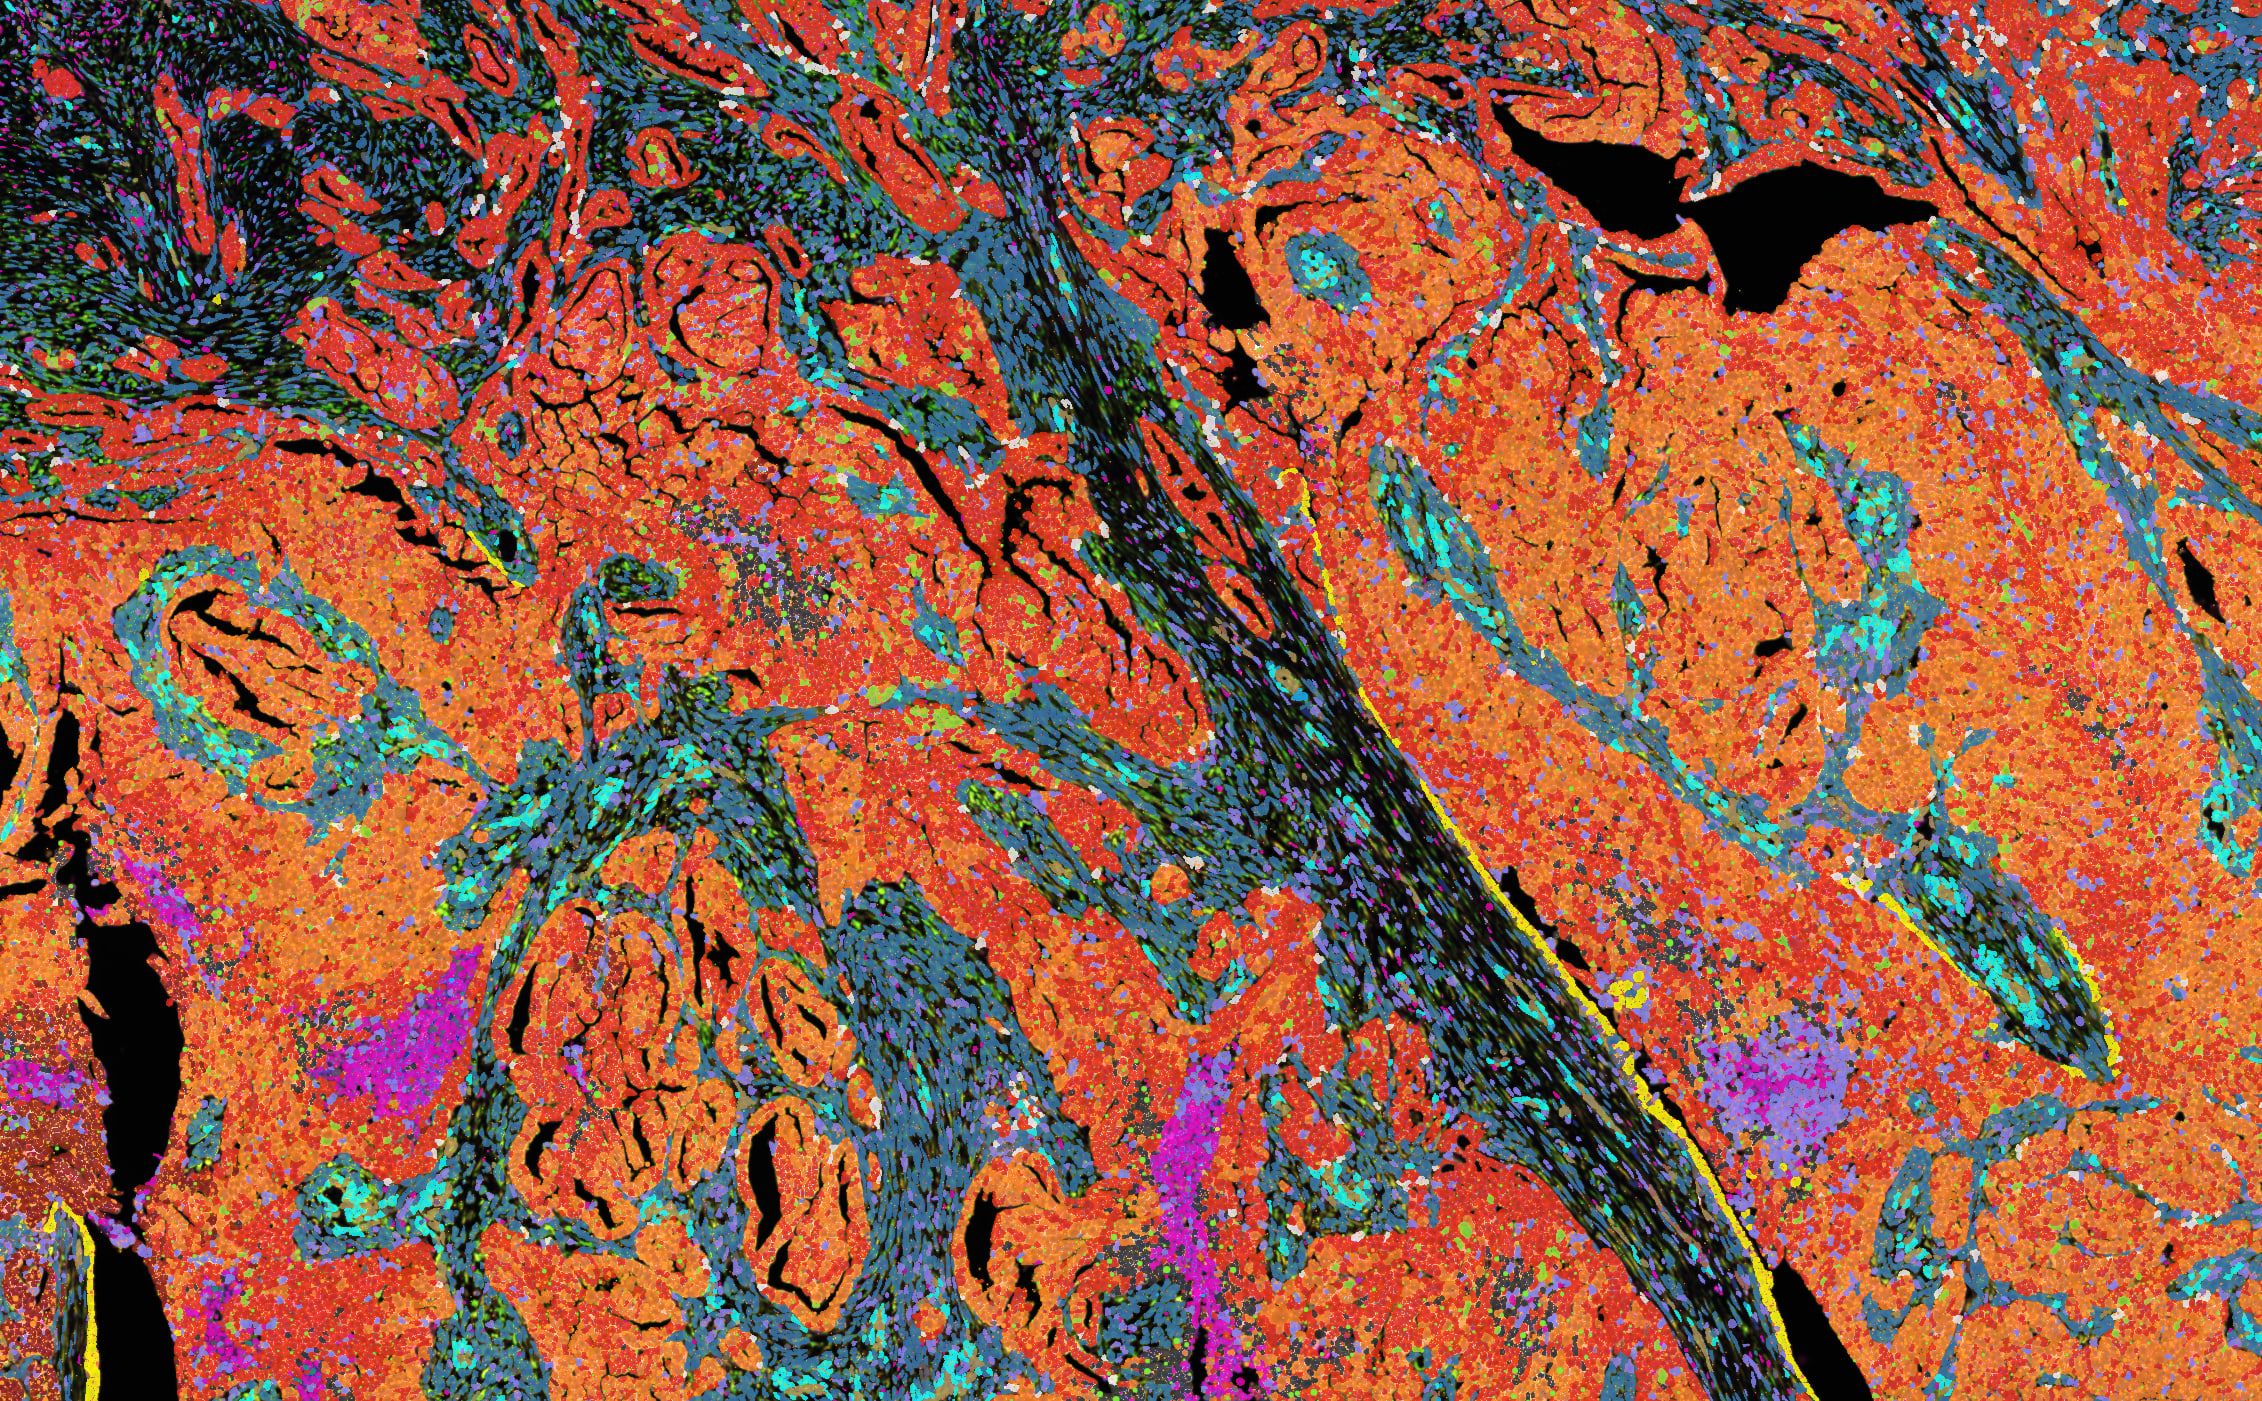
Human Ovarian Cancer