Xenium In Situ Gene and Protein Expression data for FFPE Human Renal Cell Carcinoma
In Situ Gene and Protein Expression dataset analyzed using Xenium Onboard Analysis 4.0.0

Learn about Xenium Analysis
Overview
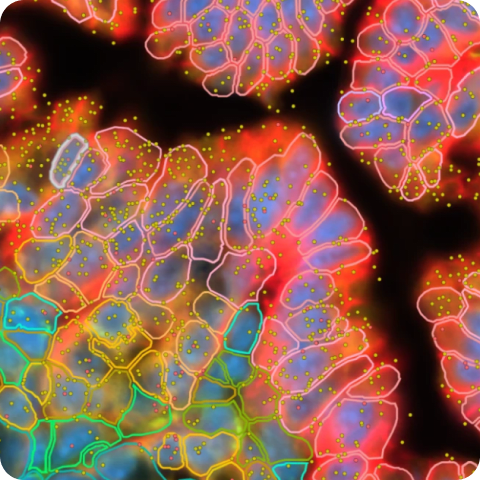
This human FFPE renal cell carcinoma dataset was generated following the Xenium In Situ Gene and Protein Expression with Cell Segmentation Staining workflow. The Xenium Human Multi-Tissue and Cancer Pre-designed Panel, supplemented with custom genes, was used to profile gene expression. The 27-plex Cell Typing & Functional State Marker Set was used to profile protein expression (immune cell types, functional states, and tissue microenvironment context). This set includes six subpanels and individually imaged cell segmentation markers.
The combined gene and protein expression data reveal that the sample’s composition differs from healthy kidney tissue. There are neoplastic "clear cells", which lack normal kidney cell type expression signatures. They are surrounded by extensive, expanded vasculature, numerous immune cells types, and exhausted T cells. There are distinct heterogenous cellular neighborhoods that vary in tumor and immune cell infiltration surrounded by stromal cells. The Ki-67 protein marker identifies proliferating cells and a rare subset of apoptotic endothelial cells. This pattern aligns with the MKI67 gene expression, potentially indicating rapid proliferation, gene expression, and cell death in this cell population.
How to view data
Interactively explore data with Xenium Explorer by downloading the Xenium Output Bundle (or Xenium Explorer subset) file. The subset bundle contains the experiment.xenium, gene_panel.json, morphology_focus/ directory of multi-file OME-TIFF files, analysis_summary.html, cells.zarr.zip, cell_feature_matrix.zarr.zip, transcripts.zarr.zip, and analysis.zarr.zip files.
See the Getting Started with Xenium Explorer page for more details. Follow these instructions to view the post-Xenium H&E image or image alignment file in Xenium Explorer.
Biomaterials
FFPE tissue blocks were purchased from Discovery Life Sciences (kidney cancer, Renal Cell Carcinoma: Stage III (T3a N1 MX)).
Tissue preparation
Tissue was prepared following the Xenium In Situ for FFPE - Tissue Preparation Handbook (CG000578).
Probe hybridization, washing, ligation, amplification, and cell segmentation staining were performed following the Xenium In Situ Gene and Protein Expression with Cell Segmentation Staining User Guide (CG000819).
Post-instrument processing followed the Demonstrated Protocol Xenium In Situ Gene Expression - Post-Xenium Analyzer H&E Staining (CG000613).
Gene panel
The Xenium Human Multi-Tissue and Cancer Panel (377 genes) was pre-designed by 10x Genomics. The panel design was informed using single cell RNA sequencing data curated and reprocessed for standardization by the Human Protein Atlas. Genes were chosen to accurately type cells, and identify select immune, proliferation, and tumor markers, in human breast, lung, skin, liver, colon, kidney, lung cancer, and heart.
We added 28 new RNA targets to enable detection of genes that are translated into the assayed protein targets and genes useful for identifying relevant cell types. This includes probes targeting the splice isoforms that are translated into the CD45RA and CD45RO isoforms of the PTPRC gene. We also added probe sets to boost sensitivity for 25 genes in the Human Multi-Tissue and Cancer Panel that are associated with protein panel markers. Boosting genes in v1 gene panels can be requested via an advanced custom design.
Protein panel
The protein panel for this dataset consists of all six protein subpanels:
- Xenium Protein Immune Cell Subpanel A (CD4, CD20, CD8A, CD3E)
- Xenium Protein Immune Cell Subpanel B (CD138, HLA-DR, CD11c, CD68)
- Xenium Protein Immune Cell Subpanel C (CD16, GranzymeB, CD163)
- Xenium Protein Proliferation & Differentiation Subpanel (CD45RA, PCNA, CD45RO, Ki-67)
- Xenium Protein Immune Checkpoint Subpanel (PD-1, VISTA, PD-L1, LAG-3)
- Xenium Protein Tumor Subpanel (Beta-catenin, CD31, PTEN, PanCK)
It also includes separately imaged cell segmentation (Xenium Multi-Tissue Stain Mix) markers (E-cadherin, Vimentin, alphaSMA, CD45), which are labeled "Cellular Localization" markers in outputs.
Xenium Analyzer
The instrument run was performed following the Xenium Analyzer User Guide (CG000584). The on-instrument analysis was run with Xenium Onboard Analysis v4.0.
| Metric | Renal cell carcinoma |
|---|---|
| Median transcripts per cell | 70 |
| Cells detected | 465,534 |
| Nuclear transcripts per 100 µm² | 140.2 |
| High quality decoded transcripts detected | 62,948,437 |
| Region area (µm²) | 66,006,974.0 |
Pathology Annotations
Pathology annotations can be imported in GeoJSON format in Xenium Explorer v4.1 and later (see Annotation Layer documentation for details). The supplemental GeoJSON annotation file is aligned to the post-Xenium H&E image.
This dataset is licensed under the Creative Commons Attribution 4.0 International (CC BY 4.0) license. 10x citation guidelines available here.