Defining the cells driving disease-associated neuroinflammation with single cell sequencing

With over 600 syndromes impacting the central nervous system (CNS), an estimated one in three people worldwide are affected by some kind of neurological disorder (1, 2). Collectively, these disorders were the leading cause of disability and the second leading cause of death in 2016 (3). Although the symptoms and severity of each disorder vary greatly, the presence of chronic or uncontrolled neuroinflammation appears to be a common feature of many of these conditions.
As the innate immune cells of the CNS, responsible for immune surveillance and macrophage-like activities, microglia are a key cell population of interest to researchers studying neuroinflammatory processes (4). In this blog post, we review two recent studies aiming to dissect the role of microglia and neuroinflammation in multiple sclerosis and neurological disorders characterized by the accumulation of tau protein, or tauopathies.
Microglia, macrophages, and multiple sclerosis
Multiple sclerosis (MS) is a disorder in which damage to nerve connections results from immune attack of CNS tissue and cells (5). Spurred by evidence that microglia and macrophages are central effectors of neuroinflammation, Mimouna et al. sought to understand the specific contribution of each cell type to experimental autoimmune encephalomyelitis (EAE), a mouse model of MS (6). Specifically, the researchers investigated the role of glucocorticoid receptor interacting protein-1 (GRIP1), previously shown to activate anti-inflammatory genes and repress pro-inflammatory genes, in microglia and macrophages.
Intriguingly, functional knockout studies revealed that loss of GRIP1 reduced EAE symptom severity and likely facilitates the neuroinflammatory effector phase of the disease. To understand the transcriptomic impact of GRIP1 deletion, the researchers performed bulk RNA-seq on myeloid cells isolated from the spinal cords of wild-type (WT) and conditional knockout (cKO) mice with and without EAE. In WT EAE mice, there was an upregulation of the NODE-like receptor signaling pathway, a nuclear receptor transcription pathway, and the interferon (IFN) signaling pathway. This data indicated that loss of GRIP1 promotes the persistence of a homeostatic transcriptomic signature that fails to upregulate inflammatory and type I IFN in myeloid cells.
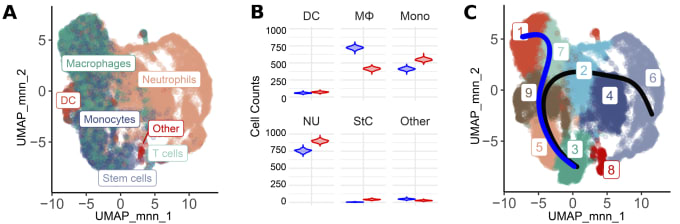
These insights wouldn't be complete without understanding the cell-specific impacts of GRIP1 loss on microglia and macrophages, which bulk RNA-seq data cannot distinguish. The researchers, therefore, turned to Chromium Single Cell Gene Expression to gain further clarity on this coregulator’s role in each cell type (Figure 2). Analysis of 6,427 WT and 11,949 cKO cells showed an increase in the proportion of macrophages in WT mice when compared to cKO mice which contained more monocytes and neutrophils (Figure 2, Panel B). Clustering was performed to tease out the presence of cell subpopulations or different cell differentiation/activation states. Nine distinct clusters were identified with clusters 1, 7, and 2 representing macrophage-like clusters (Figure 2, Panel B). Differential gene expression analysis revealed that, in cKO EAE mice, clusters 1, 7, 2, and 4 showed higher levels of expression signatures consistent with homeostatic microglia. Meanwhile, the same clusters exhibited upregulation of activated inflammatory macrophage signatures in WT EAE. A trajectory analysis anchored on cluster 3, which was enriched for proliferation markers, identified a monocyte-to-macrophage transition trajectory (Figure 2, Panel B, Blue trajectory). Altogether, the data points to the existence of several different states of activated myeloid cells that show a gradient of gene expression changes.
MS is a complex disease whose pathogenesis remains elusive, but single cell studies like these help increase our understanding of how specific cell types and their regulators influence its course. As we better dissect the immune cells and cell states involved in MS, it will be possible to identify novel therapeutic targets, such as the transcription programs impacted by GRIP1.
Microglia in tauopathies
Because it is the most common form of dementia, Alzheimer’s disease (AD) is arguably one of the most recognized neurodegenerative diseases associated with the accumulation of tau protein. There are, however, more than 20 clinical tauopathy classifications, including frontotemporal dementia (FTD) and progressive supranuclear palsy (PSP; 7). In a 2019 systems biology–based study led by Dr. Daniel H. Geschwind of the University of California, Los Angeles, researchers uncovered an evolutionarily conserved neurodegeneration-associated inflammatory gene network enriched for microglial markers. While the findings of this study form a good starting point for further investigations, the researchers noted that “Since our original study was based on bulk tissue RNA sequencing (RNA-seq), downregulated microglia gene expression trajectories were likely obscured by disease-related broad upregulation of microglial markers” (8). The group, therefore, sought to integrate cell type–specific gene expression data to get a deeper understanding of disease-relevant signaling networks.
Using gene expression data from purified microglia and bulk brain tissue, the team began their recent investigation by identifying 7 conserved modules enriched for microglial genes, named microglial neurodegeneration-associated modules (MNMs). A more in-depth analysis of early disease gene expression uncovered two new upregulated modules representing opposing pathways. The first module was named the neuroimmune activation (NAct) module because it represents early microglial innate immune activation. In contrast, the second was called the neuroimmune suppression (NSupp) module because it contained drivers of immune suppression.
With these modules defined, the researchers turned to single nuclei sequencing with Chromium Single Cell Gene Expression to evaluate microglial activity in human post-mortem samples. The NSupp module was found to be upregulated in the brain tissue of patients with AD and PSP. Quite promisingly, the authors found that these results were corroborated by other published AD single nuclei datasets (Grubman et al., 2019; Mathys et al., 2019). Single nuclei sequencing was also used to validate whether a biphasic type II interferon (IFN) response with early suppression and late increase was present in brain samples from patients with FTD. Genes observed to stimulate late interferon-gamma (IFN-𝝲) production and genes that mediate IFN-𝝲 response genes were, indeed, significantly upregulated in patients with FTD.
Altogether, this study’s results paint a detailed picture of how microglial response changes throughout the stages of various tauopathies. It also points to an important role of type II IFN responses in the later stages of these diseases. The findings serve to advance our knowledge of the differential impact of various protein aggregates on microglia responses and thereby pave the way for a deeper understanding of neurodegenerative disease pathogenesis.
Getting specific with single cell sequencing
Deciphering the intricate pathologies of neurodegenerative and chronic inflammatory neurological diseases requires neuroscientists to carefully dissect cell-type differences. Single cell technologies are building a path for us to better understand the underlying mechanisms of neuroinflammation and find better treatments that improve patient outcomes and quality of life.
Learn more about the single cell RNA-sequencing tools used in these studies by exploring these resources. And discover additional helpful neuroscience content here.
References
- Feigin VL et al. The global burden of neurological disorders: translating evidence into policy. Lancet Neurol 3: 255–265, 2020.
- Nervous system diseases | neurologic diseases. (2020, December 09). Retrieved February 23, 2021, from https://medlineplus.gov/neurologicdiseases.html
- Feigin VL & Vos T. Global burden of neurological disorders: from Global burden of disease estimates to actions. Neuroepidemiology 52: 1–2, 2019.
- DiSabato DJ, Quan N & Godbout JP. Neuroinflammation: the devil is in the details. J Neurochem 139: 136–153, 2016.
- National Multiple Sclerosis. (2018). Multiple Sclerosis: Just the Facts [Brochure]. Waltham, MA. Retrieved February 23, 2021, from https://www.nationalmssociety.org/nationalmssociety/media/msnationalfiles/brochures/brochure-just-the-facts.pdf
- Mimouna S et al. Transcription cofactor GRIP1 differentially affects myeloid cell–driven neuroinflammation and response to IFN-β therapy. J Exp Med 218(1): e20192386, 2020.
- Williams DR. Tauopathies: classification and clinical update on neurodegenerative diseases associated with microtubule‐associated protein tau. Intern Med J 36(10): 652–60, 2006.
- Swarup V et al. Identification of evolutionarily conserved gene networks mediating neurodegenerative dementia. Nat Med 25: 152–164, 2019.
- Rexach JE et al. Tau pathology drives dementia risk-associated gene networks toward chronic inflammatory states and immunosuppression. Cell Rep 33(7): 108398, 2020.