Reaching new heights—and new parameters—with Multiomic Cytometry

Single cell analysis tools have given us powerful insights into the vast heterogeneity and functional diversity of the most fundamental units of biology. But, as the classic parable of the blind men and the elephant depicts, complex systems often cannot be resolved by a single parameter. This fact has driven the technological innovations of generations of scientists looking for a better way to access more of the complex parameters that define cellular identity. With each advancement, cytometry—the measurement of the characteristics of cells—has taken a number of evolving forms. From cell counters, to cell sizers, to cell sorters, to cell profilers, each new form has built on its predecessor, culminating in the cytometric methods we know today.
What does the next frontier of cytometry look like and how will it continue to build on the innovations of the past? In the following sections, explore a brief history of cytometry, compare and contrast methods, and learn more about the next evolution of the technique, Multiomic Cytometry. With this tool, scientists can access multiomic profiles of thousands of single cells, including the abundance of hundreds of cell surface proteins and whole transcriptome gene expression.

A bloody trail: the origins of the cell counter
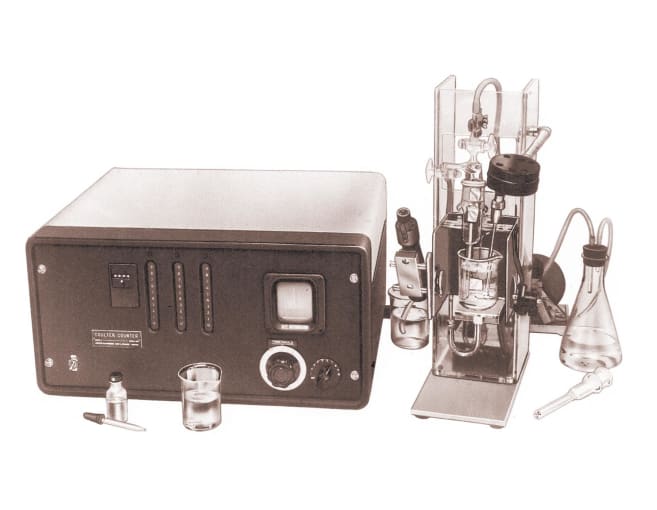
Though automated cell counting techniques did not have their origin in intrigue, secrecy, or murder, another bloody trail motivated the invention of the “Coulter Counter” in 1949. In an effort to accurately count red blood cells (RBCs) passing through a constricted pathway in suspension, Wallace Coulter created a machine that registered a change in the electrical characteristics of the flow path when a cell passed through. This allowed the machine to count and measure the size of the passing cells (1). Building on these principles, P.J. Crosland-Taylor optimized the flow of suspended RBCs through tubes with varying diameters and flow rates (2). Leveraging innovations in printing technology, M.J. Fulwyler worked out how to deflect and isolate cells in droplets of suspension medium using electrostatic fields (3). Their discoveries formed the basis of the hydrodynamic focusing characteristic of flow channels in modern flow cytometers today.
Bring on the lasers: fluorescent antibodies expand the parameters
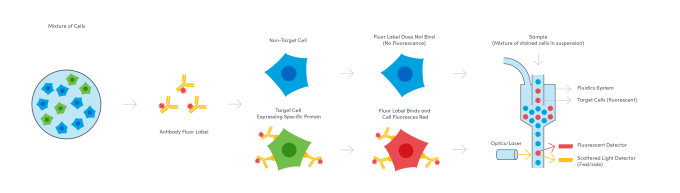
While the first true cell sorter was pioneered by Fulwyler in 1965, that’s only part of the origin story. By the 1940s, scientists like A.H. Coons had demonstrated the application of antibodies labeled with fluorescent molecules to stain and identify bacterial antigen in mammalian cells under a fluorescence microscope (4). Merging these biochemical discoveries with advances in automated cell sorting and fluorescence microscopy, a team of scientists from Stanford University sought to use fluorescence readouts to expand the types of parameters that could be detected when running cells through a flow channel. In the late 1960s, the Stanford team led by Leonard A. Herzenberg built the first so-called Fluorescence Activated Cell Sorter (FACS), an instrument that used a laser and two light detectors to measure cell size, capturing the scatter of light around cells as they passed through the laser; fluorescence, enabling analysis of the presence of cell surface proteins labeled beforehand with fluorophore-conjugated antibodies; and of course, the number of cells in the sample (5). Subsequent improvements to fluorescence detection enabled further annotation of surface proteins and refined sorting of cell subpopulations as scientists were able to distinguish more fluorescent labels—today, as many as 15—in the light spectrum.
A new kid on the block: metal ions up the parameters even more
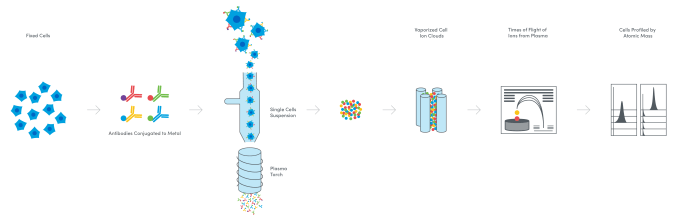
In an effort to address the challenges of spectral overlap—loss of resolution of fluorescent signals that can happen when a threshold of fluorescent labels is reached in the flow cytometry workflow—and analyze more cell surface proteins, scientists turned to a new reporter: metal ions. Fusing flow cytometry and long attested elemental mass spectrometry techniques, mass cytometry emerged in the late 2000s as a method to tag antibody probes with heavy-metal isotopes. Cells are fixed and then stained with these antibody probes. The cells are then vaporized in the mass cytometer, leaving only the ion tags, which are filtered and separated according to their precise mass-to-charge ratio. The quantity of metal ion tags assigned to each cell in the sample is an indication of protein expression, and can allow detection of over 40 cell surface proteins (6).
The next evolution of cytometry: a sequencing-based readout
As the history of flow cytometry and mass cytometry demonstrate, scientists across generations have been looking for better ways to decipher the proteins on the surface of cells, and therefore define diverse cellular populations from complex samples. But biological complexity often cannot be fully resolved by a single parameter. The need to access more parameters, both in type and quantity, and so gain more granular information about cellular identity and function has continued to inspire innovation in cytometry, culminating in new pioneering methods that leverage next-generation sequencing to expand the potential insights of single cell experiments.
CITE-seq, first described in 2017 by Dr. Marlon Stoeckius, Dr. Rahul Satija, and collaborators from the New York Genome Center, leveraged oligonucleotide-labeled antibodies and high-throughput single cell gene expression analysis to integrate a sequencing-based readout of cell surface proteins and whole transcriptome gene expression from the same single cells (7). This technique performs the essential function of flow cytometry—labeling cell surface proteins—but expands the number of detectable markers through the unlimited tagging potential of unique oligonucleotide barcodes, while integrating a second crucial parameter to define cellular identity with the addition of gene expression. Multiomic Cytometry, a validated, end-to-end workflow enabled by Feature Barcode technology from 10x Genomics, allows you to simultaneously measure cell surface proteins and gene expression using a sequencing-based readout. It thus represents the next evolution of cytometry, overcoming the limitations of spectral overlap and providing more information about your samples through an ultra-high parameter, multiomic profile of cellular complexity.
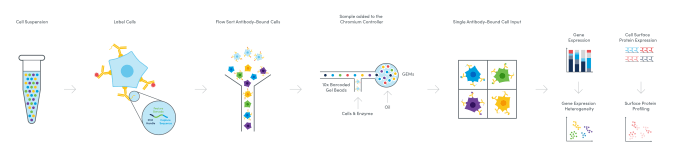
But how does it work? And how many proteins can you measure? Multiomic Cytometry allows you to profile hundreds of cell surface proteins alongside gene expression at single cell resolution for hundreds to tens of thousands of cells. There are commercially available antibodies compatible with the workflow, including pre-designed, pre-titrated, lyophilized panels with key markers for your research area. You can also tag your own unique antibodies with custom oligonucleotides provided through custom conjugation solutions from our commercial partners. Then, following sorting or enrichment by FACS if necessary, samples are taken through a single cell library construction workflow, resulting in cDNA libraries for both mRNA and cell surface proteins that have a 10x Barcode linking them to the cell of origin. After sequencing these libraries, you can analyze and visualize the combined proteomic and transcriptomic data from single cells to resolve the full heterogeneity of your samples and understand the basis of cellular identity and function.
For more details on the Multiomic Cytometry workflow and how it works, visit our application page. And learn how Multiomic Cytometry compares to traditional cytometry methods by exploring our interactive technology exhibit.
Achieving deep immune profiling with Multiomic Cytometry
The ultimate proof of the utility of Multiomic Cytometry is in the new discoveries and insights it can enable. Already, scientists have shown the value of a combined readout of cell surface proteins and single cell gene expression for comprehensive immunophenotyping, including refined analysis of regulatory T-cell lineage trajectories (8), discovery of novel precursor macrophage populations active in rheumatoid arthritis (9), and an exploration of the mechanisms of T-cell exhaustion in CAR T-cell therapy (10). More recently, a team of scientists from the Department of Pathology and Immunology at the Washington University School of Medicine uncovered a subset of clonal granzyme-K (GZMK+) CD8+ T cells that accumulate in the tissues of aging mice and humans using Multiomic Cytometry techniques from 10x Genomics (11). They determined that these T cells are hallmarks of the immunological changes that arise during aging, as well as potential contributors to chronic low-grade age-related inflammation.
These diverse studies point to the possibilities of discovery enabled by the combined power of a comprehensive protein and gene expression readout in single cells. They are the results of great technological strides in cytometric methods—from counting cells to multiomic profiling of hundreds of cellular parameters—and they anticipate a future of even greater insight into biological complexity.
Learn how to unlock the full heterogeneity of your samples in a single, streamlined experiment with ultra-high parameter, single cell multiomic phenotyping. Get started with Multiomic Cytometry.
References:
- BiteSize Bio. Evolution Flow: The Historical Background of Flow Cytometry. (2013). https://bitesizebio.com/13693/historical-background-of-flow-cytometry/
- PJ Crosland-Taylor. A Device for Counting Small Particles suspended in a Fluid through a Tube. Nature. 171, 37–38 (1953).
- MJ Fulwyler. Electronic separation of biological cells by volume. Science. 150 (1965).
- AH Coons et al., The Demonstration of Pneumococcal Antigen in Tissues by the Use of Fluorescent Antibody. J. Immunol. 45, 159–170 (1942).
- LA Herzenberg et al., The History and Future of the Fluorescence Activated Cell Sorter and Flow Cytometry: A View from Stanford. Clin. Chem. 48, 1819–1827 (2002).
- MH Spitzer and GP Nolan. Mass Cytometry: Single Cells, Many Features. Cell. 165, 780–791 (2016).
- M Stoeckius et al., Large-scale simultaneous measurement of epitopes and transcriptomes in single cells. Nat. Methods. 14, 865–868 (2017).
- D Trzupek et al., Discovery of CD80 and CD86 as recent activation markers on regulatory T cells by protein-RNA single-cell analysis. Gen. Med. 12, 55 (2020).
- H Tetsuo et al., Identification of a novel arthritis-associated osteoclast precursor macrophage regulated by FoxM1. Nat. Immunol. 20, 12 (2019).
- M Corselli et al., Single cell multiomic analysis of T cell exhaustion in vitro. bioRxiv. (2019).
- DA Mogilenko et al., Comprehensive Profiling of an Aging Immune System Reveals Clonal GZMK+ CD8+ T Cells as Conserved Hallmark of Inflammaging. Immunity. 53, 1–17 (2020).