Spatial transcriptomics—the next evolution of cancer drug discovery
*Impact at a glance: Two publications from researchers at Bristol Myers Squibb and the Johns Hopkins University School of Medicine demonstrated the power of the Visium Spatial platform to reveal the architecture of highly complex tumors, including FFPE samples, identify putative biomarkers, and define clinically relevant differences between responders and non-responders.*
Charles Darwin’s theory of evolution was inspired by the diverse species of finches inhabiting the Galápagos Islands. Darwin’s finches evolved from a species that arrived on the islands millions of years ago. Their most distinctive feature is their diverse variety of beaks, each perfectly suited for their food preferences, the result of centuries of natural selection.
The heterogeneous cells within complex human tumors are like Darwin’s infamous finches on the Galápagos Islands—the most well-adapted survive even the most aggressive treatments. But the effects of natural selection within a tumor can happen seemingly overnight and turn a treatment from promising to ineffective.
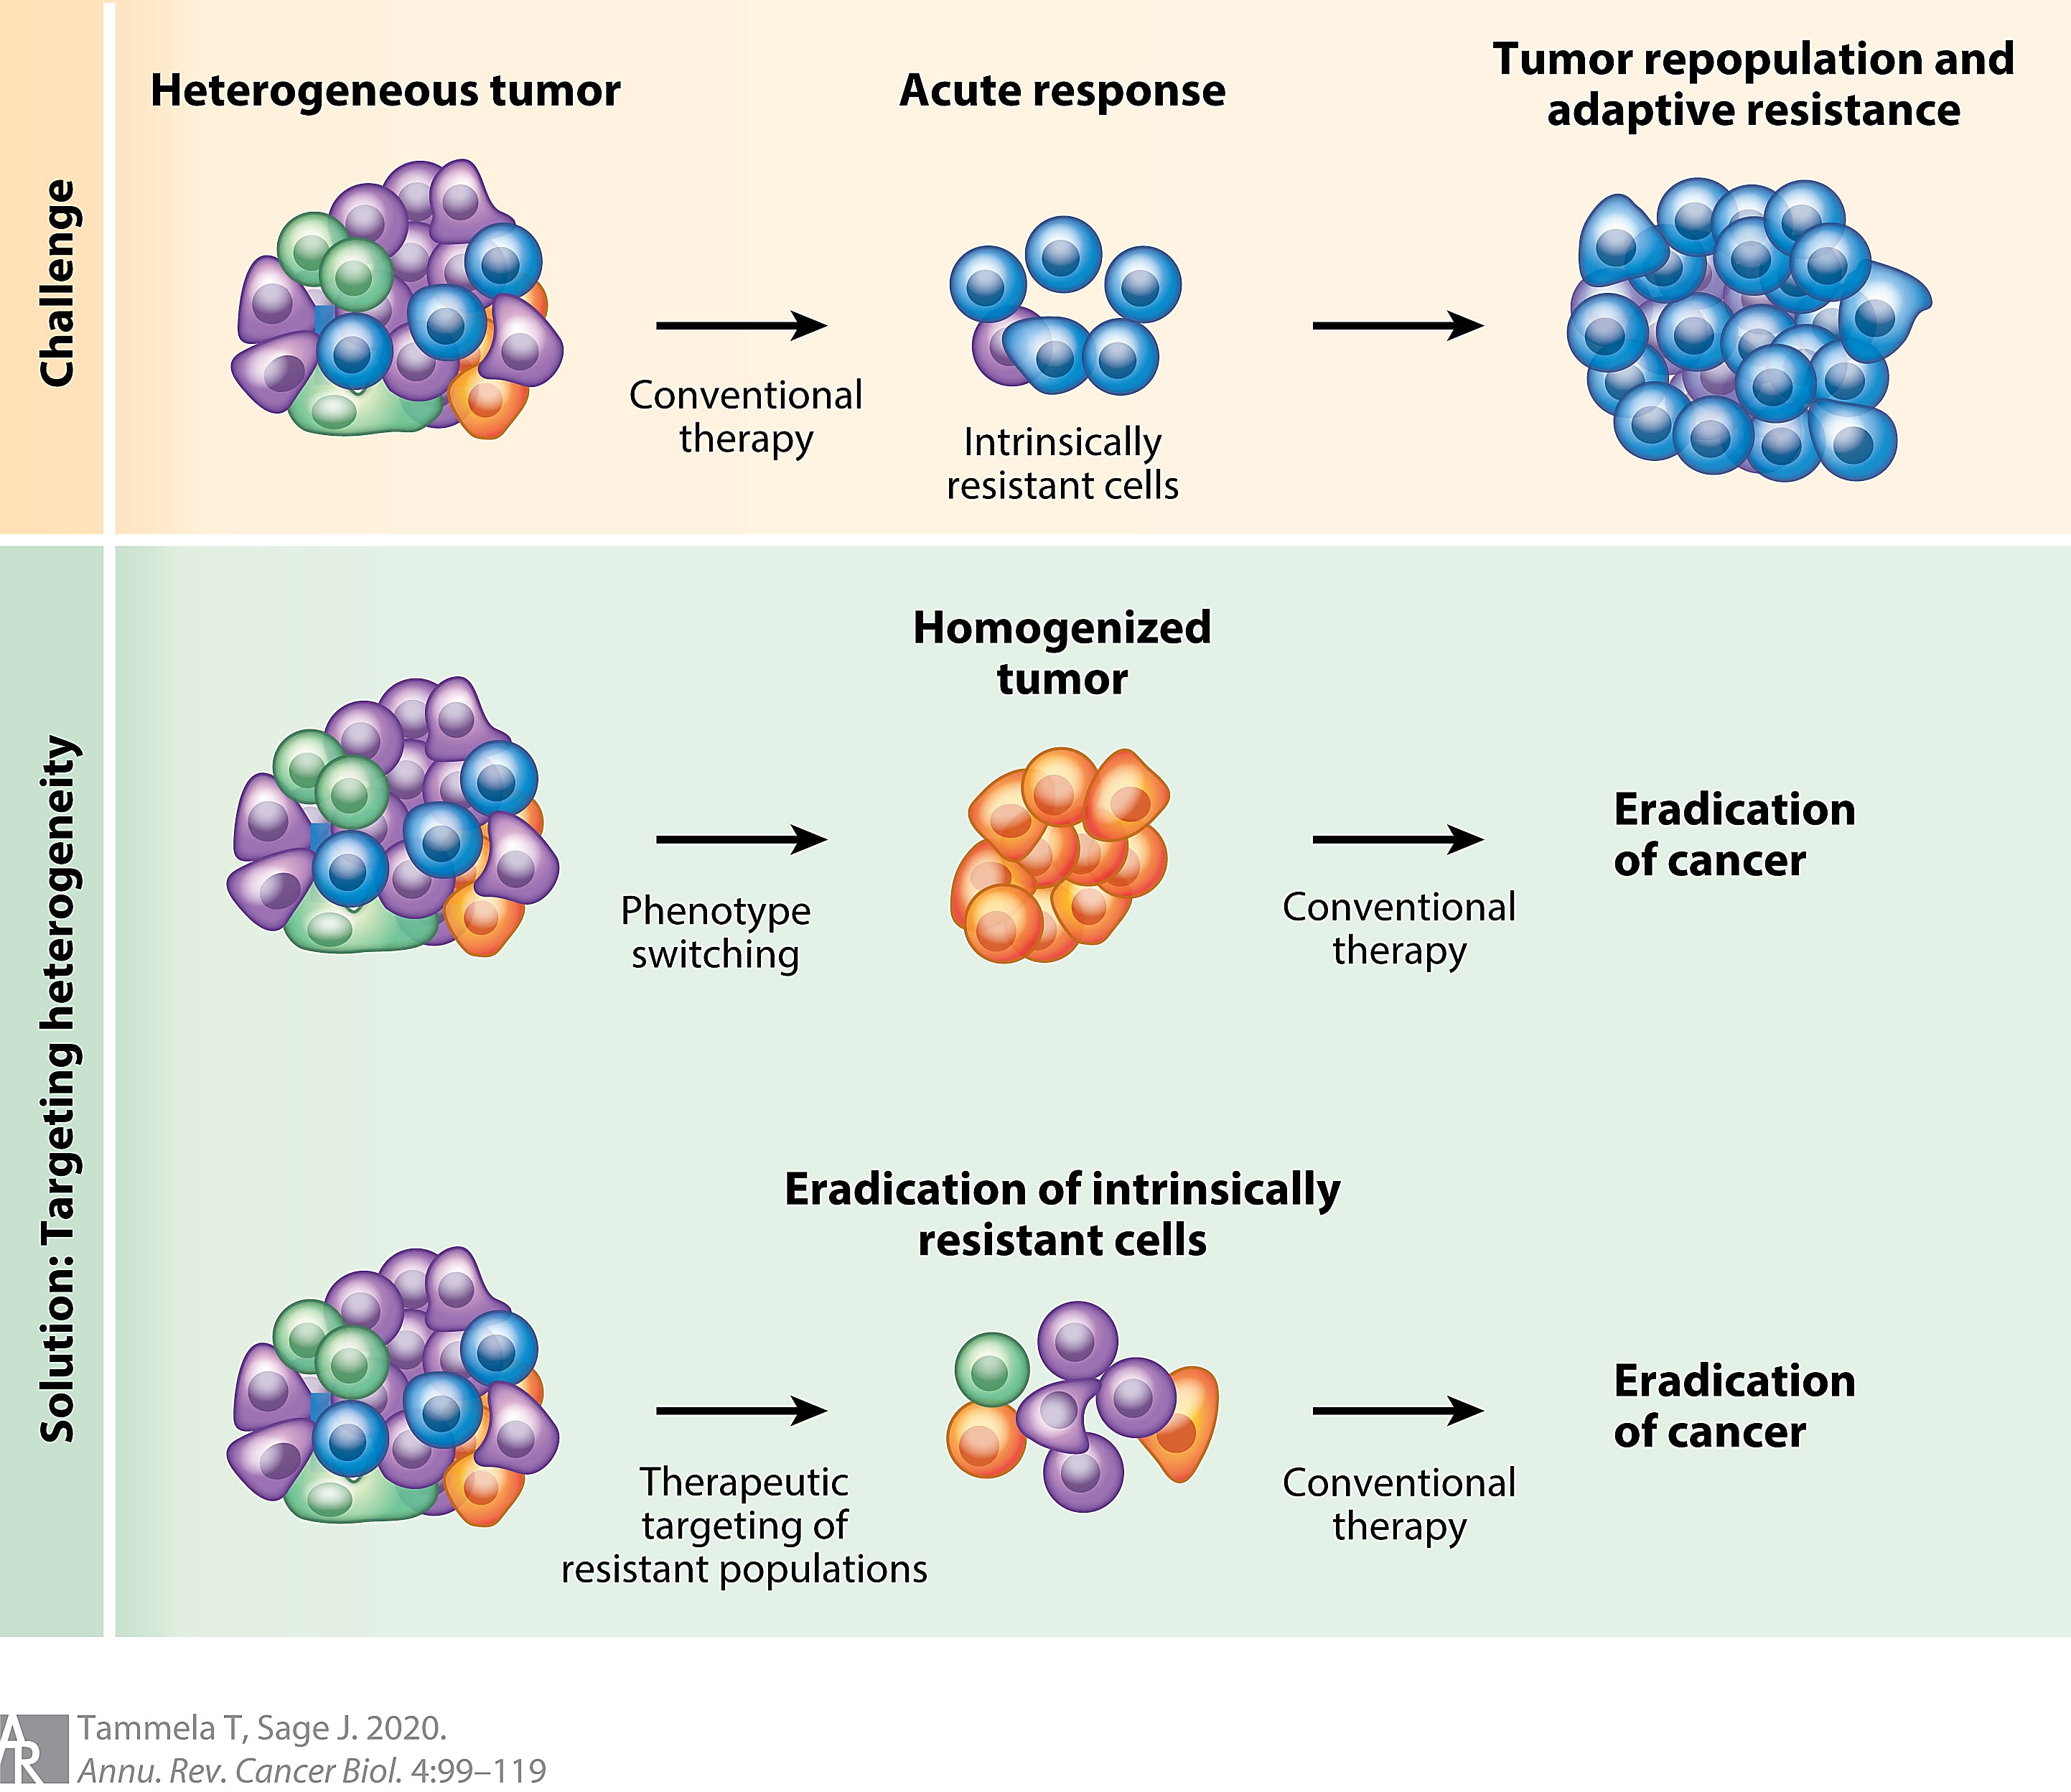
Highly heterogeneous tumors benefit from natural selection to the detriment of the patient. These tumors are highly adaptable and often resistant to targeted therapies. New therapies or combination therapies are needed to effectively treat these constantly evolving tumors.
But recapitulating highly heterogeneous tumors in the lab is tricky. Tumor heterogeneity involves more than just cell-to-cell variability. The environment surrounding the tumor, which includes infiltrating immune cells and vasculature, also affects tumor growth, malignancy, and drug resistance. Mouse models of specific cancers—including patient-derived xenografts—often fail to fully recapitulate the heterogeneity both within and surrounding the tumor (1, 2).
Going right to the source is the best way to characterize the impacts of tumor heterogeneity, and the advent of single cell RNA-sequencing (scRNA-seq) did just that. scRNA-seq has transformed how researchers interrogate the effects of tumor heterogeneity in patient-derived samples and provided critical insights into the incredible cellular and genetic diversity within tumors and their microenvironments (3). But scRNA-seq using fresh or fixed cells or nuclei requires tissue dissociation, which disrupts cell-to-cell interactions and the tumor microenvironment (TME).
Spatial transcriptomics allows investigators to visualize biomarkers, spatial interactions, and tumor transcriptomes in their native architecture, enabling researchers to better identify potential drug targets and resistance mechanisms. Investigators have used our Visium Spatial Gene Expression technology to develop reproducible workflows for oncology drug discovery and identify mechanisms of resistance and recurrence in post-treatment patient tumor samples.
Exploring the archipelago of cancer
Researchers from Bristol Myers Squibb recently published pilot data that demonstrated spatial transcriptomics can accurately capture the various compartments and interactions within the TME of highly heterogeneous tumors using not only fresh or frozen tissue, but also FFPE samples—the most common source of banked, patient-derived tumor samples (4).
They analyzed 40 fresh and frozen tissue samples—including tissue from mouse tumor models with complex TMEs and from patient tumors with various levels of heterogeneity—using Visium Spatial Gene Expression. Ultimately, they not only accurately capture the architecture and spatial location of highly complex tumors, but they also identified putative tumor biomarkers.
The pharmaceutical research group developed an orthogonal validation framework that integrated gene expression and digital pathology data, dubbed the spatial validation framework. They used this framework to validate expression data distribution and interpret the data using digital pathology annotation to guide biomarker discovery and target validation.
They generated a deep learning model using neural networks to annotate the morphology of H&E-stained tissue samples to couple with spatial transcriptomic data—pathologists validated the annotations. To combine spatial transcriptomics analyses—processed using SpaceRanger, Seurat v4, and other R libraries—they assigned each spot to a digital pathology–defined tissue compartment with which it overlapped the most. This colocalization analysis helped the group validate known biomarkers and cell types within distinct tissue regions and identify new, clinically relevant biomarkers and receptor–ligand pairs.
The investigators first used their workflow to analyze fresh frozen colon tissue samples isolated from a healthy rat using both Visium Spatial Gene Expression and digital pathology. They both fine-tuned details of their imaging method and validated that gene expression profiles from spatial transcriptomics analysis matched the histologically well-organized compartments and well-characterized marker genes for rare cell types consistently found in the mouse colon. The analysis captured the gene expression profiles of hallmark compartments, such as the epithelium, and rare cells, such as enteric neurons.
Their analysis also accurately represented the tumor tissue architecture. The group analyzed H&E-stained tissue sections via supervised digital pathology and identified eight distinct image textures or compartments, including crypts. The de novo gene expression clusters identified by spatial transcriptomics analysis aligned with previously reported biomarkers of the cell types expected in the identified compartments.
But the ultimate goal was to demonstrate that spatial transcriptomics could effectively characterize complex, heterogeneous cancer tissue and garner new insights. The researchers used tumor samples from rats and patients to demonstrate that spatial transcriptomics analysis consistently identified putative biomarkers and pairwise interactions in highly heterogeneous tumorigenic tissue.
For example, they analyzed tissue sections from FFPE blocks of patient-derived pancreatic ductal adenocarcinoma (PDAC) tumors and identified several known tumor-intrinsic biomarkers including MIF—a ligand that modulates inflammation to aid in tumor immune evasion—and PDAC-relevant pairwise interactions, such as the overexpression of the tumorigenesis-promoting pair CXCR4 and its ligand CXCL12. Overall, the authors charted out a map for other groups to explore cancer samples and garner new insights into cancer and potential therapies.
The group also developed a visualization application called the BMS Spatial Portal that supports exploration of spatial genomics data. With the portal, others can explore the gene expression and biomarker data gathered in this study and analyze data they produce using methods described in the publication.
Dive deeper into how our technology bolstered this study in our research snapshot.
Surveying the effects of natural selection
Another group of researchers from the Johns Hopkins University School of Medicine employed Visium Spatial Gene Expression analysis of tumor resections to define clinically relevant differences in tumors from people with hepatocellular carcinoma (HCC) who did and did not respond to neoadjuvant cabozantinib—an anti-angiogenic therapy that blocks VEGF—and PD-1 inhibitor nivolumab (CABO/NIVO) in a phase 1b clinical trial (5).
HCC is the most common form of primary liver cancer—the third deadliest cancer in 2020 (6). Combined treatment with an anti-angiogenic and an immune checkpoint inhibitor—primarily PD-1 inhibitors—is the current standard line of defense against HCC, but it doesn’t work for many patients, and even those who do show a good initial response sometimes relapse later. Unfortunately, there are currently no known biomarkers that differentiate responders and non-responders.
The Johns Hopkins University School of Medicine researchers set out to change that. They recently conducted a phase 1b clinical trial where patients were treated with CABO/NIVO for 8 weeks prior to surgical resection (7). Five of the fifteen patients enrolled in the study had a major pathologic response (necrosis was visible in 90% or more of the tumor). Tumor resections from these five responders revealed increased immune infiltration and reduced numbers of immunosuppressive macrophages.
The group wanted to understand the selective pressure that made these tumors so much more vulnerable to CABO/NIVO and find biomarkers that could predict a patient’s response. They determined the best way to dig deeper into their data was high-resolution, spatial profiling using Visium Spatial Gene Expression technology.
“The recent development of technologies that provide spatially resolved gene expression data introduced powerful methods to profile the TME and understand how tumor intrinsic features are associated with the distribution of other crucial cell types for tumor development and response to therapies,” said the authors (5).
They analyzed spatial transcriptomics data from seven frozen surgical HCC samples—four responders and three non-responders—by unsupervised clustering and identified cell populations commonly found in HCC tumors, including cancer cells, cancer-associated fibroblasts, and immune cells. A pathologist confirmed these results by histological analysis.
Not only did they discover that immune cells and fibroblasts were more prevalent in responder HCC samples, they found that the top genes differentially expressed in responders were immune-related genes, including the cytokines CCL19, CXCL14, and CXCL6. Non-responder samples were mostly composed of cancer cells and highly expressed known tumor markers, such as AFP and IGF2. When they performed gene set enrichment analysis, they discovered that non-responder samples didn’t just lack expression of immune-related genes, they also expressed high levels of genes involved in metabolic and cell proliferation pathways.
These results suggest that non-responder tumor cells are less responsive to the immune-activating effects of CABO/NIV treatment, and continue to expand and spread unchecked.
The Johns Hopkins School of Medicine investigators then identified relevant cell-to-cell interactions by analyzing expression in neighboring cells. Crosstalk between cancer cells and the tumor microenvironment plays a critical role in tumor response and resistance. They expected this analysis would reveal potential biomarkers and therapeutic vulnerabilities.
And it did. They analyzed interactions between cancer cells, immune cells, and/or cancer-associated fibroblasts in each patient sample individually to account for heterogeneity. They identified spatial clusters and applied the computational tool Domino to find transcriptionally active intercellular signaling pathways (8). They identified high expression of genes upregulated by the transcription factor PAX5—a key regulator of B-cell differentiation and function—in immune cell regions adjacent to tumor cell regions in responder samples. Additionally, PAX5 activity co-localized with high B-cell-marker-expressing Visium spots.
Areas where cancer cells and cancer-associated fibroblasts interacted showed increased activity of extracellular matrix remodeling regulatory pathways marked by increased expression of collagen-producing genes COL1A1 and COL3A1.
“These findings suggest that drugs that initiate or maintain B cell activity combined with CAF inhibitors could be alternatives to increase efficacy of immunotherapies to treat HCC,” said the authors.
This study shed a lot of light on the differences between responders and non-responders, but there was still a pressing question: why did one of the five patients that responded to the CABO/NIVO therapy develop recurrent disease a year after their post-treatment surgery? They compared the sample of this one confounding patient to the four patients whose tumors did not recur even three years after surgery.
The critical difference between the responder with recurrent disease was the presence of a cancer stem cell (CSC) molecular signature. CSCs proliferate indefinitely and are highly resistant to cancer therapies, including immunotherapies like the PD-1 inhibitor nivolumab. Tumors with CSCs often come back after treatment. They took a closer look at other HCC samples with CSC molecular signatures in the Cancer Genome Atlas and discovered these tumors are highly infiltrated with immunosuppressive T cells rather than immune-activating B cells. Their findings build on the idea that CSCs easily evade the immune system and persist after treatment.
In the end, the data allowed the researchers to not only differentiate between responders and non-responders, but also find markers for resistance and recurrence. Non-responders did not contain a CSC molecular signature. This delineation should help researchers continue to fine tune and personalize treatments.
Outsmarting evolution
Spatial transcriptomics enables scientists to understand the molecular underpinnings of tumor response and resistance in a cellular context. As evidenced by the studies above, it is particularly useful for interrogating the role of cell-to-cell interactions and intercellular signaling, which plays a key role in the tumor’s interaction with its microenvironment. We’re excited to see how spatial transcriptomics continues to help investigators analyze patient samples, identify new biomarkers and drug targets, and move closer to truly personalized medicine.
Learn how Visium Spatial Gene Expression can strengthen your drug discovery research.
References:
- Tammela T and Sage J. Investigating tumor heterogeneity in mouse models. Ann Rev of Cancer Biol 4: 99–119 (2020). doi: 10.1146/annurev-cancerbio-030419-033413
- Yuan Z, et al. Presence of complete murine viral genome sequences in patient-derived xenografts. Nat Commun 12: 2031 (2021). doi: 10.1038/s41467-021-22200-5
- Gonzalez-Silva L, et al. Tumor functional heterogeneity unraveled by scRNA-seq technologies. Trends in Cancer 6: 13–19 (2020). doi: 10.1016/j.trecan.2021.02.001
- Lyubetskaya A, et al. Assessment of spatial transcriptomics for oncology discovery. Cell Reports Methods 2: 100340 (2022). doi: 10.1016/j.crmeth.2022.100340
- Zhang S, et al. Spatial transcriptomics analysis of neoadjuvant cabozantinib and nivolumab in advanced hepatocellular carcinoma identifies independent mechanisms of resistance and recurrence. bioRxiv (2023). doi: 10.1101/2023.01.10.523481
- Sung H, et al. Global Cancer Statistics 2020: GLOBOCAN Estimates of Incidence and Mortality Worldwide for 36 Cancers in 185 Countries. CA Cancer J Clin 71: 209–249 (2021). doi: 10.3322/caac.21660
- Ho WJ, et al. Neoadjuvant cabozantinib and nivolumab convert locally advanced hepatocellular carcinoma into resectable disease with enhanced antitumor immunity. Nat Cancer 2: 891–903 (2021). doi: 10.1038/s43018-021-00234-4
- Cherry C, et al. Computational reconstruction of the signalling networks surrounding implanted biomaterials from single-cell transcriptomics. Nat Biomed Eng 5: 1228–1238 (2021). doi:10.1038/s41551-021-00770-5