Your introduction to Visium HD: Spatial biology in high definition

Whole transcriptome spatial gene expression is a proven method, enabling powerful, unbiased insights into the molecular expression profiles of diverse cell types organized in complex networks within tissue architecture. Unbiased whole transcriptome gene expression mapping is the basis for the huge discovery potential this spatial biology method offers to researchers.
Beyond developing spatially resolved cell atlases of tissue, whole transcriptome spatial insights have enabled identification of rare cellular phenotypes and cell–cell interactions that drive crucial functions in both health and disease (1–3). One powerful example is the tracing of a population of IgA antibody-secreting plasma cells to submucosal glands in the human trachea, which likely supports immune recruitment and antibody secretion in the context of antiviral respiratory immunity (1). Whole transcriptome spatial insights also revealed the presence of a rare prostate cancer subtype co-existing with a more common subtype in the same patient tumor sample, providing guidance on diagnosis and putative treatment options through differential gene expression analysis between the two subtypes (2). In a phase 1b clinical trial of neoadjuvant cabozantinib and PD-1 inhibitor nivolumab against liver cancer, Johns Hopkins researchers performed whole transcriptome spatial analysis on patient samples to identify heightened B-cell activity, regulated by the transcription factor PAX5, in tumor-adjacent immune cell regions as a key biomarker for positive therapeutic response (3).
These powerful examples demonstrate the value of whole transcriptome spatial gene expression for providing holistic characterization of complex biological systems, as well as unearthing actionable, clinically relevant hypotheses for further testing and validation. Yet, despite the excellence of these findings, biology still withholds many of her secrets. The advent of higher-resolution spatial analysis tools, with the same whole transcriptome discovery power, can ensure researchers will be able to see the complexity of their samples in complete detail.
That’s why Visium HD Spatial Gene Expression promises to usher in a new era of discovery in spatial biology, providing whole transcriptome insights at single cell–scale resolution. With a novel slide architecture and a Visium CytAssist–enabled workflow, Visium HD delivers best-in-class, high-resolution spatial transcriptomics data from human or mouse fresh frozen (FF), fixed frozen, and FFPE samples, enabling powerful discoveries like those already demonstrated in our v1 and v2 Visium assays.
As our most requested product ever, we were incredibly excited and proud to introduce you to Visium HD in a recent webinar. Review the webinar for yourself here, then keep reading this blog to find an overview of:
- Visium HD slide architecture and technology
- The benefits of a CytAssist-enabled workflow
- Improvements from the v2 assay
- Tissue television: Examples of Visium HD data
- FAQs for the Visium HD workflow and sample preparation
- How Visium HD can elevate your spatial research (with insights and data from our webinar speaker, Omer Bayraktar, PhD, Group Leader at Wellcome Sanger Institute)
Bringing high definition to spatial biology: How does Visium HD work?
The Visium HD workflow is similar to our v2 CytAssist-enabled Visium Spatial Gene Expression workflow. This workflow marries standard histological processes with a simple molecular biology protocol to acquire H&E or IF images of your tissue sections alongside a whole transcriptome spatial gene expression readout resolved at single cell scale.
As outlined in our demonstrated protocols, researchers can start the workflow from fresh frozen, fixed frozen, or FFPE tissue blocks and freshly section onto glass slides, or from pre-sectioned tissue slides. This FFPE compatibility provides access to archived samples. After the H&E or IF staining steps, tissues are treated with whole transcriptome probe panels, enabling hybridization and ligation of probe pairs to their targets. The simple, CytAssist-enabled workflow then facilitates transfer of the gene expression probes from the tissue sections onto Visium HD slides (Figure 1).
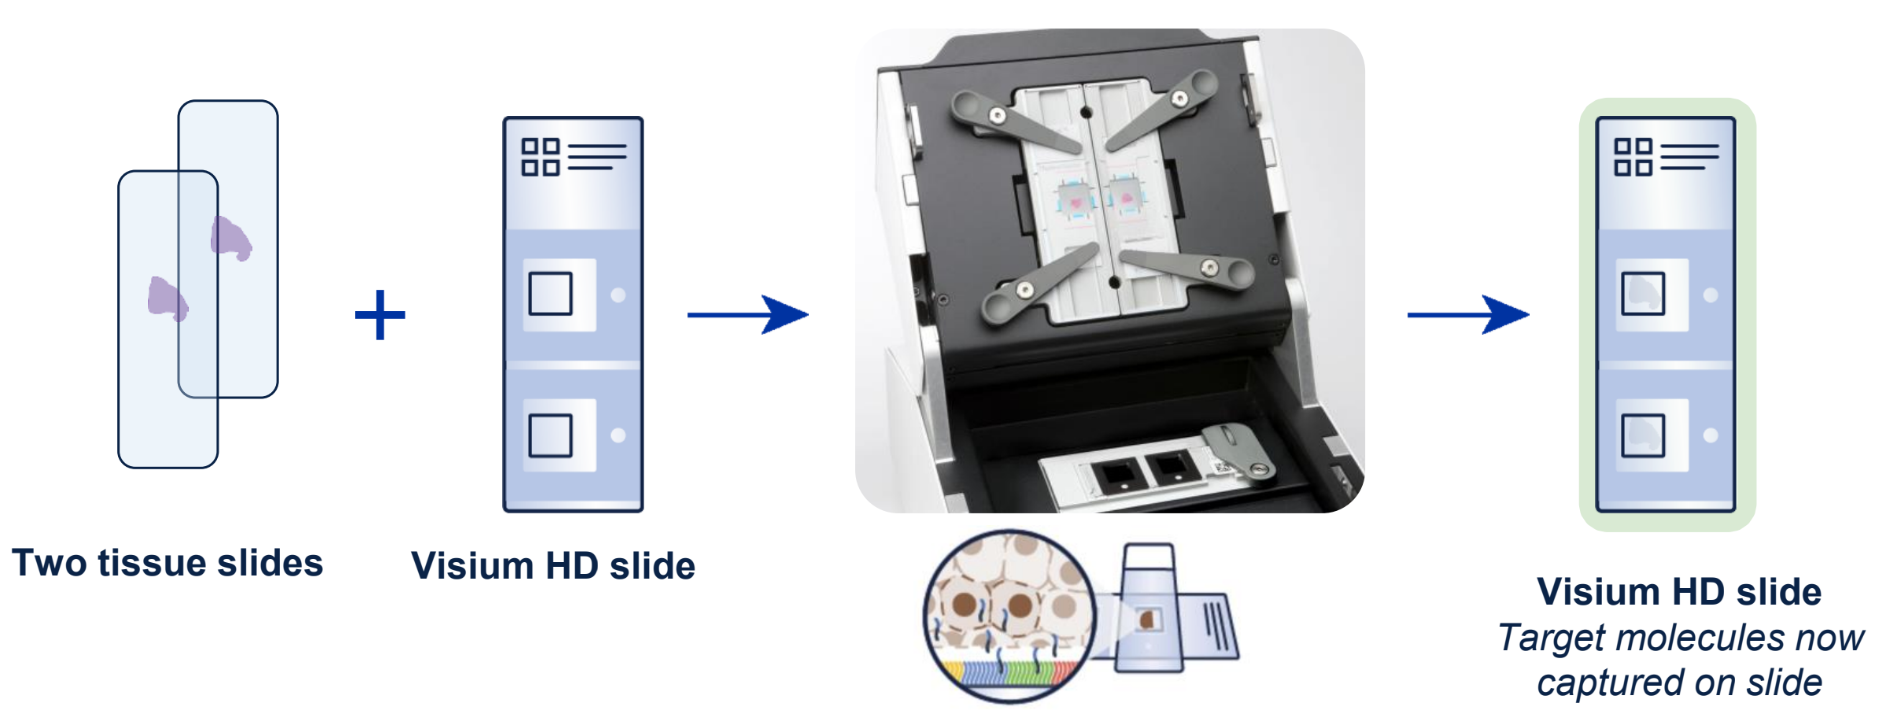
The architecture of the Visium HD slide Capture Area is a key factor in the high-resolution spatial insights the assay provides (Figure 2). The Capture Areas contain a continuous lawn of oligonucleotides arrayed into millions of 2 x 2 µm barcoded squares that capture the gene expression probes. Spatial Barcodes in the oligonucleotides enable spatial mapping of gene expression readouts back to tissue section images.
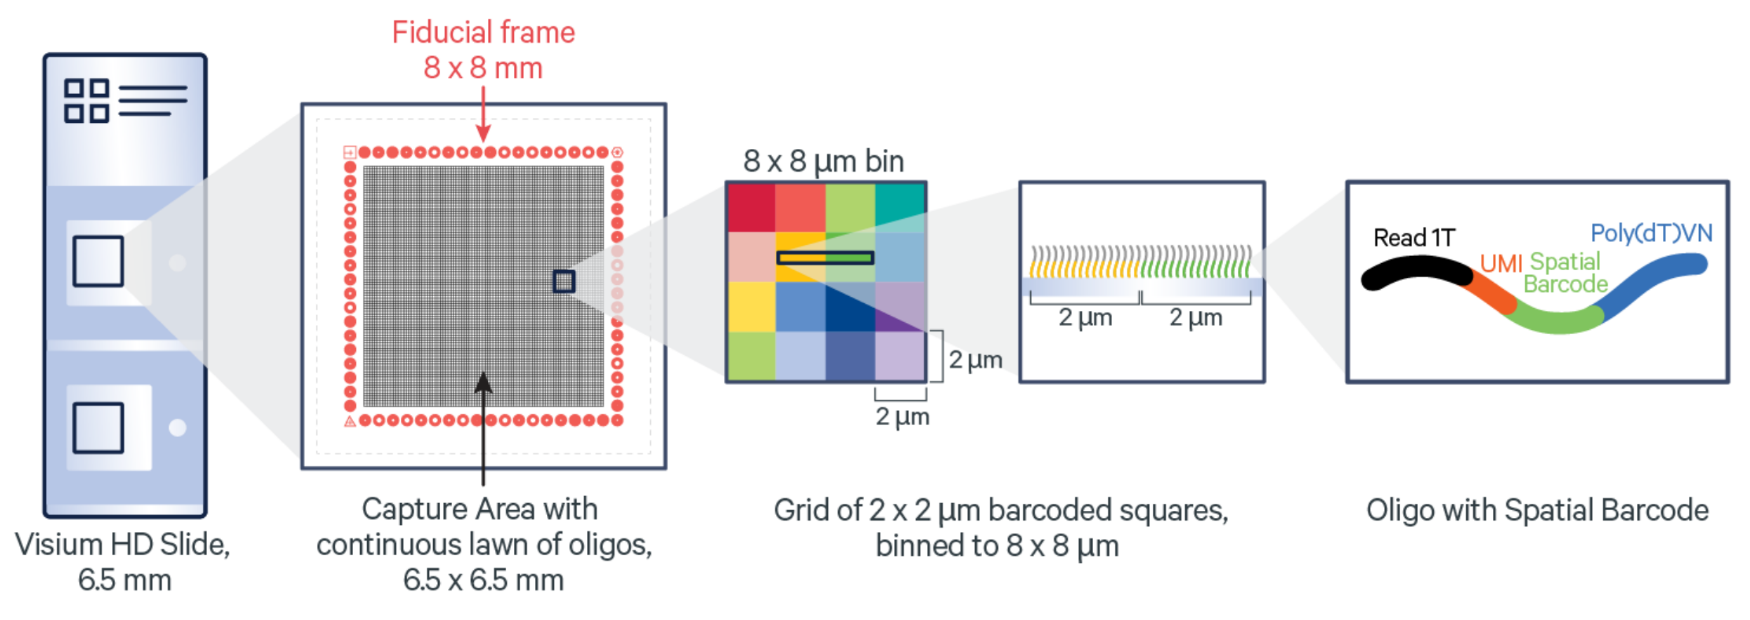
After the probe capture and spatial barcoding step, the Visium HD Slide is removed from the Visium CytAssist for downstream library preparation. Gene expression libraries are generated from each tissue section and sequenced. A spatially resolved sequencing-based whole transcriptome gene expression readout is output at 2 µm and provided at multiple bin sizes as well. This gene expression data can be visualized and explored as an overlay onto the matched H&E or IF tissue image.
A bit more on Visium HD resolution and binning: bin sizes can be scaled small enough to capture single cells, meaning this approach is able to characterize the main cell type(s) that are present in each bin. Given this binning strategy and the average size of eukaryotic cells (between 8 and 100 µm), each binned area may cover components of more than one cell; as such, Visium HD delivers what we term single cell–scale spatial resolution. The 2 µm data can be utilized for custom binning to match tissue morphology. An example of how that can be done is explained in our analysis guide.
Back to topWhy is Visium CytAssist an essential part of the Visium HD workflow?
Visium CytAssist generally makes spatial sample management easier by allowing scientists to section tissue directly onto glass slides or start spatial experiments with pre-sectioned tissue slides. It’s also a crucial component of the Visium HD workflow because it powers automated, precise probe transfer and spatial barcoding. The instrument provides a controlled environment for probe transfer from the tissue slide to the Visium HD slide, minimizing processes such as diffusion and fluidic flow and enabling accurate barcode assignment. This ensures that maximal probe targets are captured and that they are localized with high spatial fidelity.
The Visium HD consumables and assay workflow have also been designed to maximize the accuracy of transcript localization. Having no gaps between barcoded squares further ensures target molecules are captured with high localization accuracy.
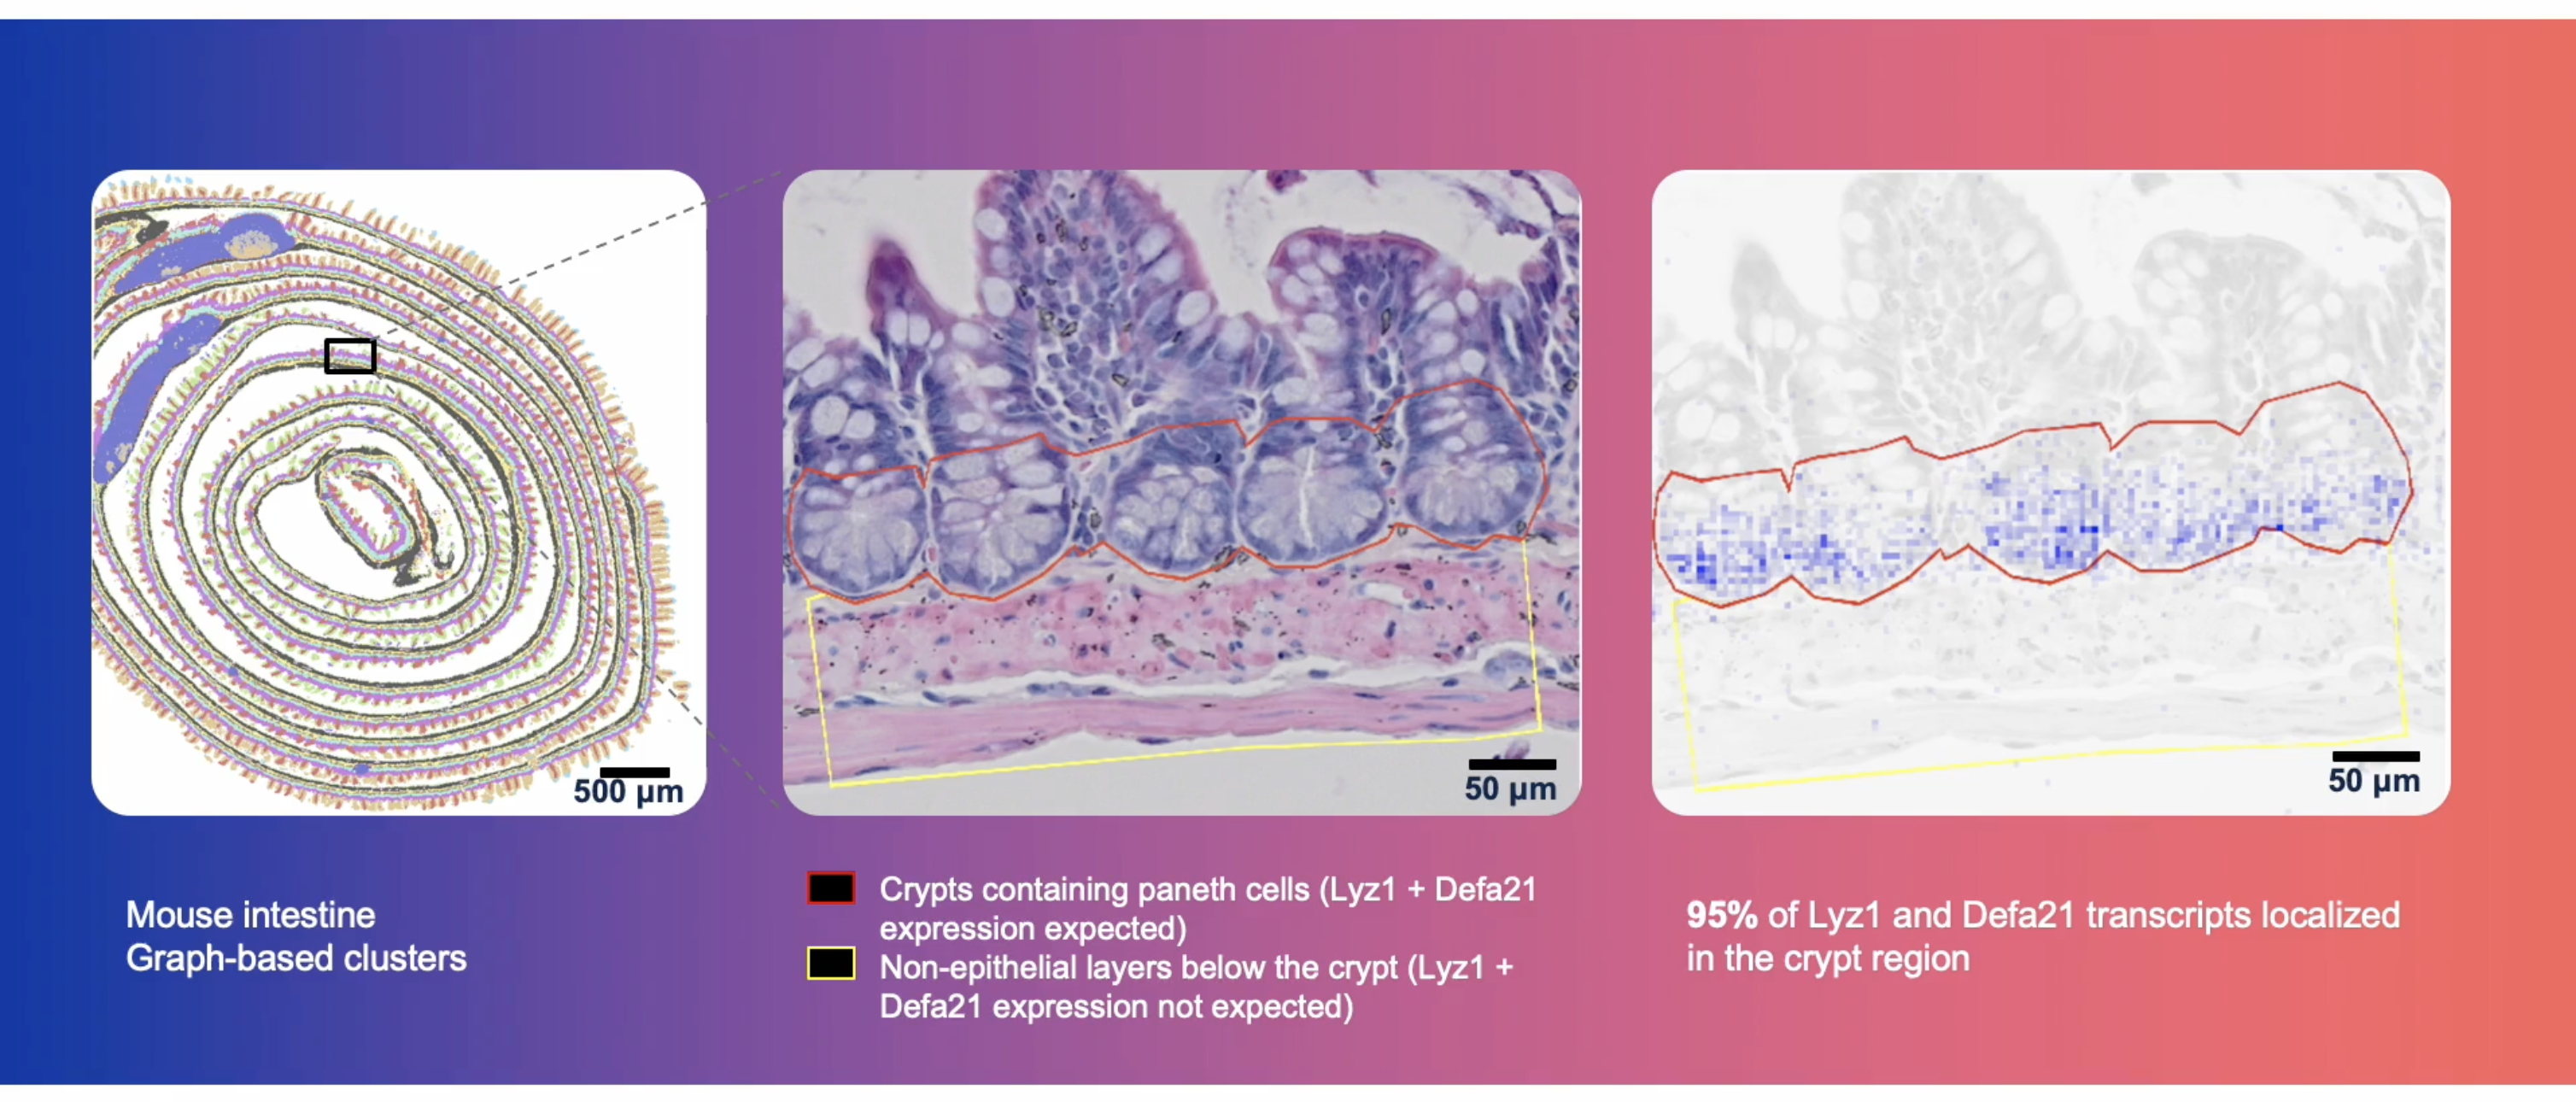
This robust process and subsequent data confidence is all the more important when interrogating spatial biology at single cell–scale resolution in fine anatomical structures and complex cellular niches (Figure 3).
How does Visium HD improve upon the v2 Visium Spatial Gene Expression assay?
In this case, a picture is truly worth a thousand words:
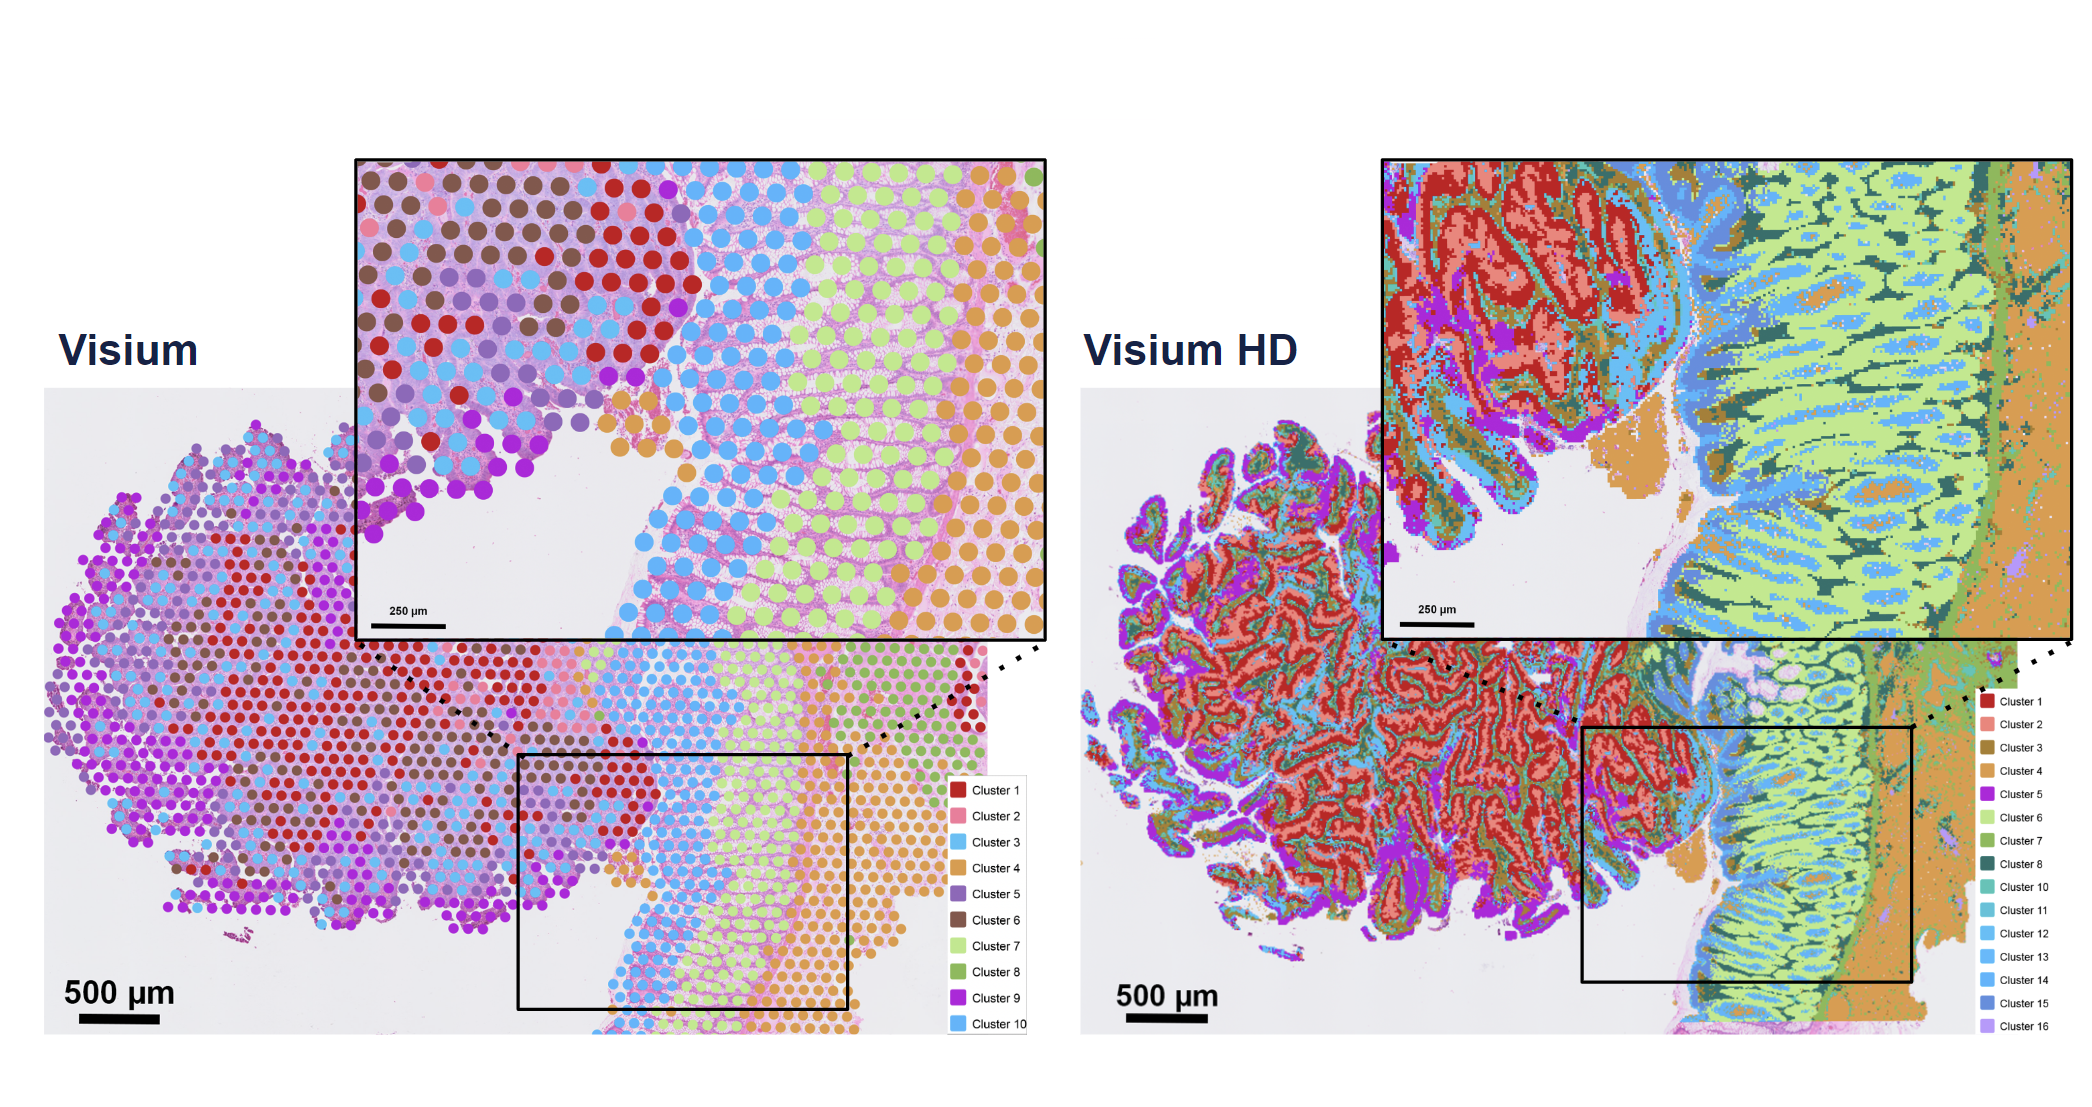
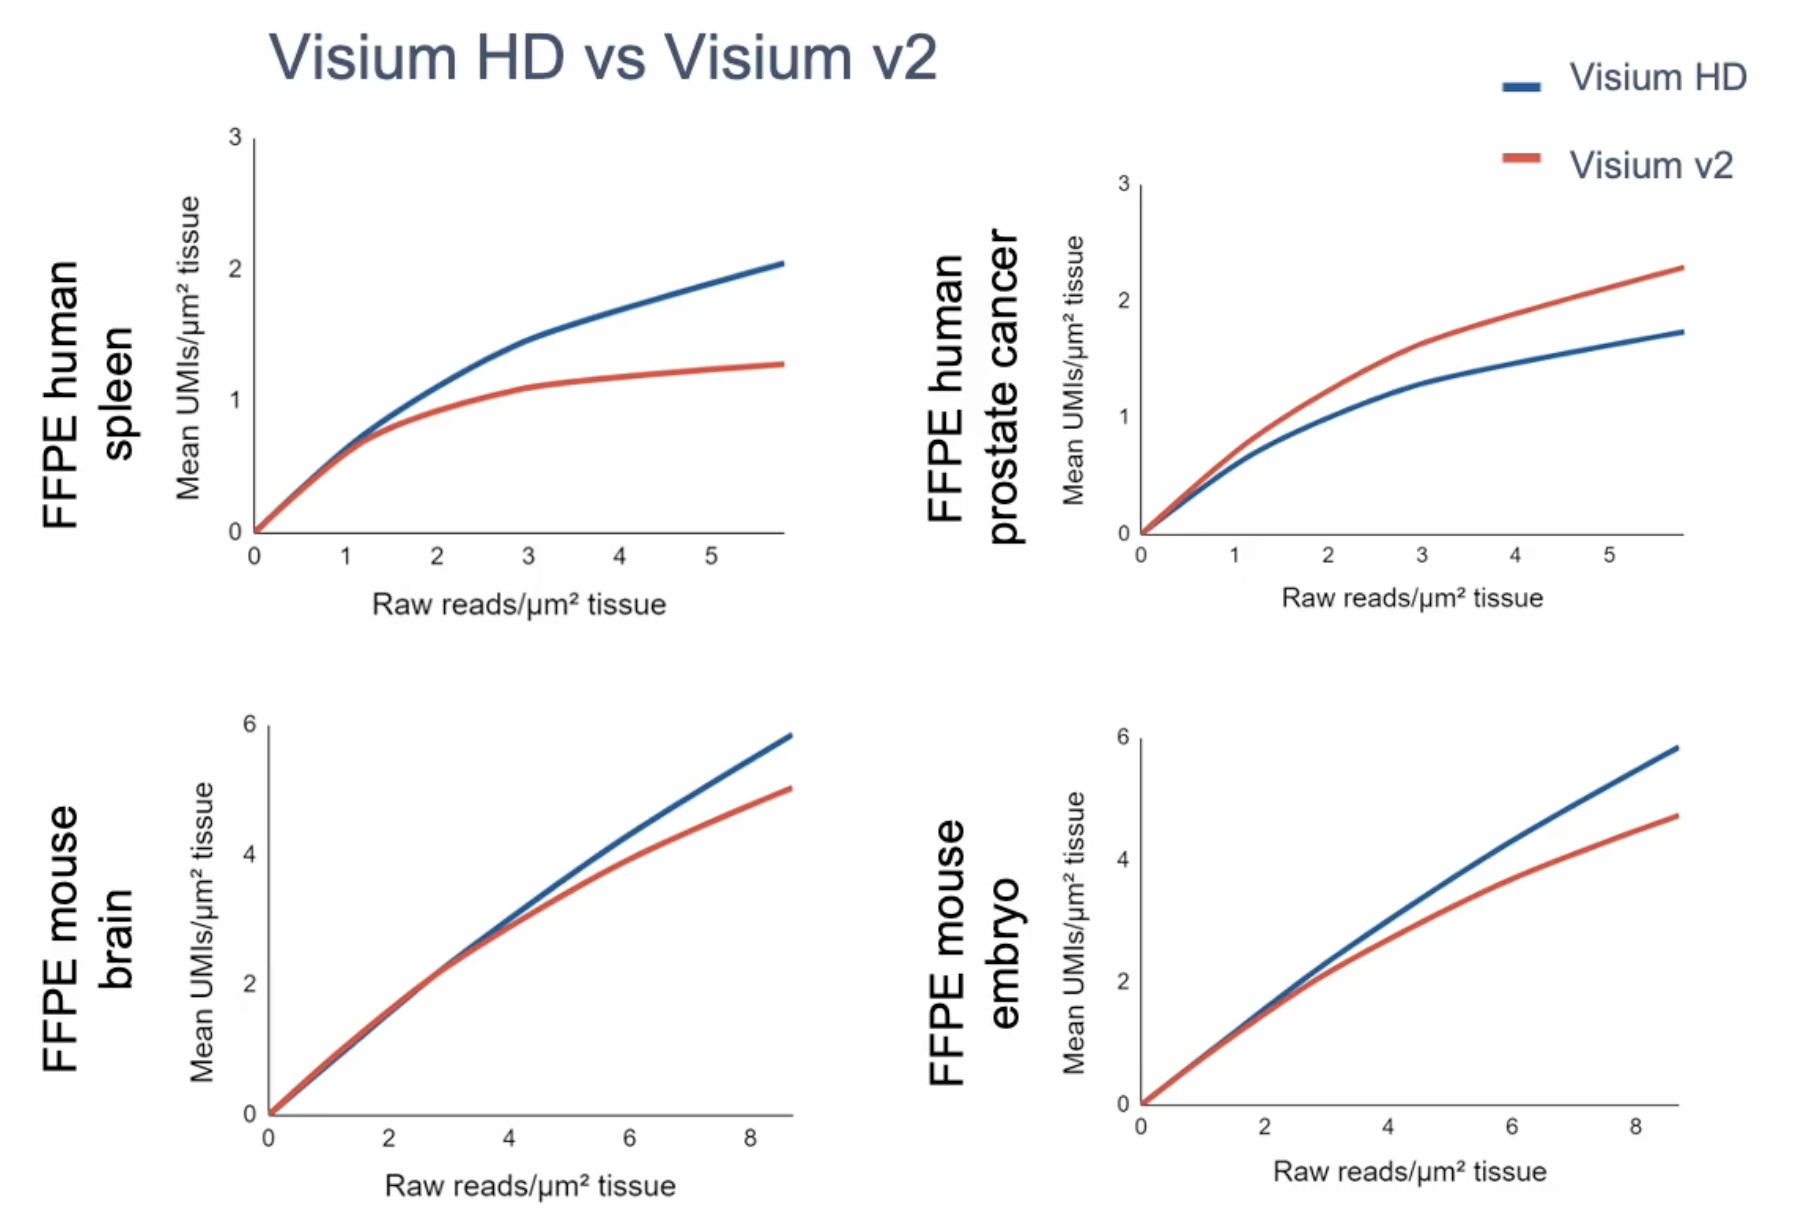
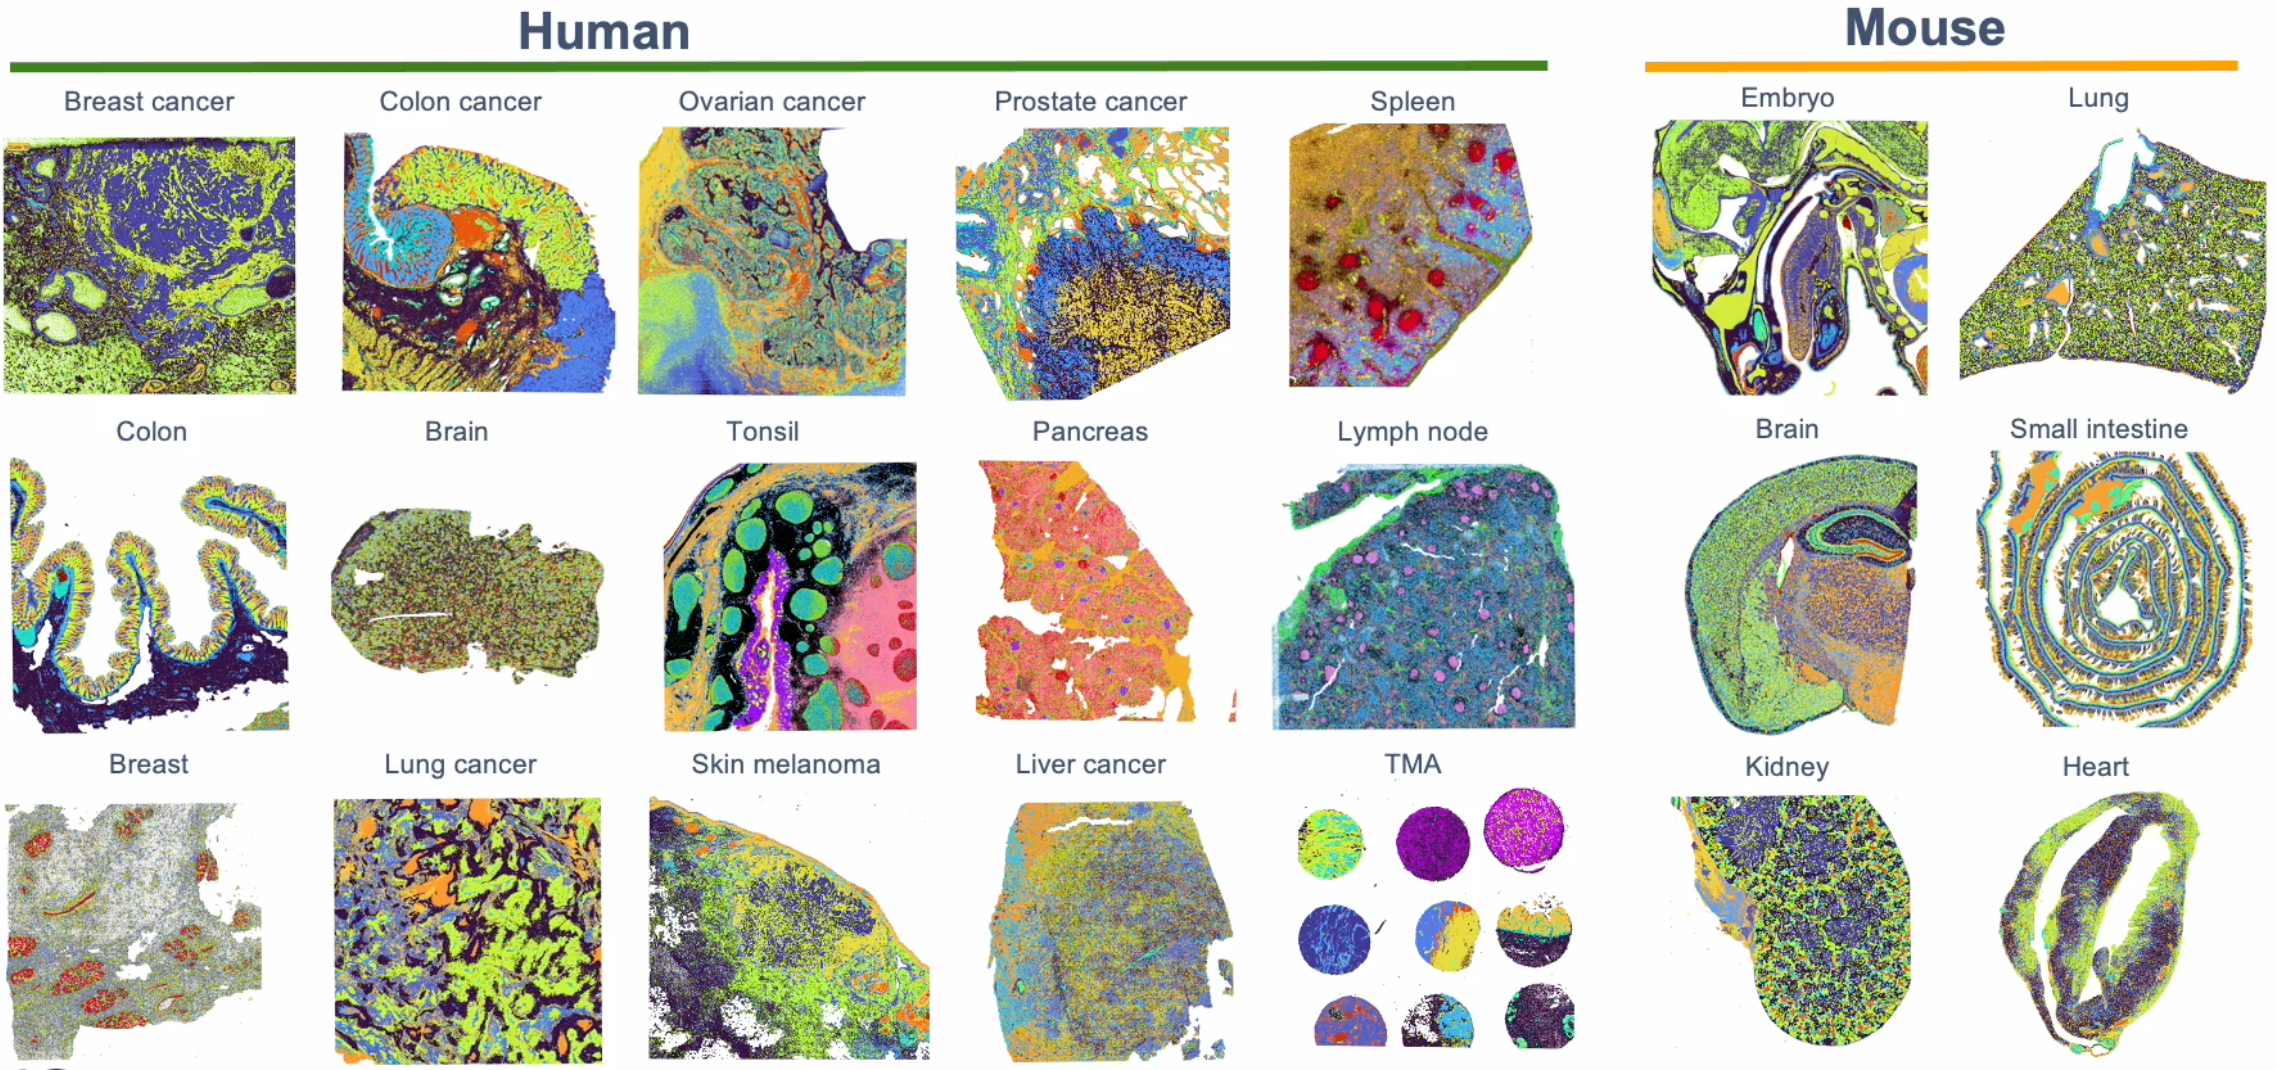
Resolution is the most immediately obvious improvement when comparing the v2 Visium and Visium HD assays, as Visium HD captures an incredible amount of spatial detail in architecturally complex tissue sections. Leveraging graph-based clustering, researchers should expect to see more granularity in their cell-type annotations from the Visium HD spatial gene expression data as well.
Gene expression sensitivity will vary depending on tissue type. At matched sequencing, Visium HD typically has comparable sensitivity to Visium v2 (Figure 6). But, again, the continuous coverage and higher resolution of Visium HD allow for finer assignment of those transcripts to a location in the tissue.
While we plan to provide access to additional tissue preparations and chemistries with the Visium HD assay, our v1 fresh frozen Visium Spatial Gene Expression assay leverages a reverse transcription–based chemistry and is therefore species agnostic, making it a good option for whole transcriptome spatial transcriptomics in less common animal models, such as rat or zebrafish. Additionally, our v2 Visium CytAssist Spatial Gene and Protein Expression assay measures whole transcriptome gene expression and highly multiplexed protein expression from the same FFPE tissue sections, and therefore may provide value to your current research.
Back to topWhat tissue types have been tested with the Visium HD assay?
Visium HD is compatible with human and mouse fresh frozen (FF), fixed frozen, and formalin-fixed paraffin-embedded (FFPE) tissues. Our experimental planning and design resources provide a detailed list of the types of tissues tested in-house and any important considerations we recommend when processing. This is not a restrictive list of compatible tissues, so if a tissue of interest isn’t on this list, that doesn’t mean it’s incompatible. It just has not yet been tested! Generally, if a tissue type has been successful with the v2 Visium CytAssist Spatial Gene Expression assay, we expect it will also work with Visium HD.
Archived clinical samples are among the compatible FFPE samples tested for Visium HD, including FFPE blocks or pre-sectioned tissue slides. There is no special protocol for specific tissue types or conditions; rather, Visium HD leverages a universal FFPE-compatible protocol that does not require additional optimization. This protocol has been validated across FFPE tissue storage conditions as well, including freshly sectioned tissue, archived tissue, and cover-slipped tissue.
We have also released publicly available Visium HD datasets to explore for yourself! This includes data from human FFPE colon cancer and lung cancer, as well as mouse FFPE intestine and brain.
Should I use fresh frozen, fixed frozen, or FFPE tissue with Visium HD?
The Visium HD assay works robustly with FFPE, FF, and fixed frozen tissue. Therefore, we'd recommend your first consideration be sample availability—which tissue do you have available that will best answer your biological question? If you have flexibility, there are some considerations for sample selection that you can find in our knowledge base article. Additionally, you can explore our respective demonstrated protocols (fresh frozen, fixed frozen, FFPE) for more details on using each tissue condition with Visium HD.
Back to topFAQs about Visium HD
In our recent webinar introducing Visium HD, Julia Cowen, PhD, 10x Genomics Senior Product Manager; Naishitha Anaparthy, PhD, 10x Genomics Senior Scientist, Molecular Biology; and customer speaker Omer Bayraktar, PhD, Group Leader at the Wellcome Sanger Institute, answered questions about the assay, how it works, compatible sample types, and its evolving capabilities. We highlight a few of these questions about Visium HD in the sections below:
Will Visium HD work for 10-year-old FFPE archived samples? How can we test it before performing the assay?
Julia Cowen: We've tested a wide range of FFPE blocks, including blocks that are up to 5 years old. For our prior products, we’ve seen success with even older blocks and we’d expect similar performance for HD.
For tissue sections placed on slides, we’ve seen success on HD with up to 6 months of storage, but we haven’t tested the absolute maximum of what’s possible. (Details on storage conditions can be found in our support documents.)
What you can do to test your sample is assess your DV200 score as one indicator of RNA quality before running Visium HD. We recommend greater than 30%, but with our v2 product, customers have also generated good data with samples lower than 30%.
Are there limits to the thickness of the tissue section for use with the Visium HD assay?
Naishitha Anaparthy: Currently we support a thickness of 3–10 µm sections. We have tested within that range. Standardly, we use 5 μm sections in-house.
What are the recommended sequencing depth requirements for Visium HD?
Julia Cowen: For a fully covered Capture Area, meaning the tissue section is covering the entire Capture Area, we recommend a minimum of 275 million read pairs. This will also be guided by your research questions—what sequencing saturation is required to answer your questions, depending on your tissue block and tissue type. For RNA-rich samples, more information can be accessed by increasing sequencing reads. So, many customers may choose to go beyond the minimum recommendation if they want to get the greatest possible sensitivity with the Visium HD assy for their tissue samples.
How does the 2 µm and 8 µm binning work? Why is it recommended that data is binned to 8 µm for analysis?
Omer Bayraktar: When you generate the HD dataset, you have access to the 2 µm data. However, to make it more computationally wieldy—to ensure you have enough transcripts to work with—the data is digitally binned to the 4-by-4 bin size, which translates to 8 x 8 µm.
Julia Cowen: Yes, I can confirm we provide the data at the *2 µm level, and we also provide a couple different bin sizes. For example, researchers can rebin the data within Space Ranger to integers of 2 µm between 10 µm and 100 µm. A Loupe file is available for the 8 µm bin and is provided for custom bins generated through Space Ranger.
In general, the 8 µm bin offers the advantage of containing more transcripts per bin compared to 2 µm barcoded squares—which improves statistical power for clustering and assessing differential gene expression—while still providing single cell–scale resolution, since most mammalian cells range from 8–100 µm in diameter. For that reason, we think it’s a good starting point for your analysis of Visium HD data
*2 µm data can be analyzed via third party tools. We invite you to explore our new Analysis Guide on nuclei segmentation and custom binning of Visium HD 2 µm data to learn more.
Can cellular segmentation information from the H&E tissue image be used to deconvolute data and obtain a single cell–like signal?
Omer Bayraktar: That’s a fantastic question, and I’m quite excited about what is described in this question. With Visium, obviously you have the matched H&E images, and, with the CytAssist, now you’re looking at the formalin-fixed tissue H&E images, which often present high morphological quality. So I think with HD, absolutely, it would be fantastic to try first looking at the images, segmenting the cells, and then counting or assigning the Visium HD pixels (at their finest resolution—2 µm resolution) to individual cells. This could be done completely independently from *spaceTree deconvolution.
Now, whether that works for every tissue sample completely depends on the tissue, how well the H&E images came through, but also the quality of the cell segmentation. There are certain tissues and cells that will segment very well from H&E images. With glioblastoma, the segmentation quality is ok. There are other tissues where this could be quite hard, such as tissues that are very densely, cellularly packed and have a lot of different cell states. For example, the liver might be tough to get a single cell segmentation. So I would suggest, for people interested in this, to first focus on the quality of your segmentation, visually try to confirm if you are getting near single cell type of data. Keep an eye out for cell populations you might be missing because you’re not segmenting well, or perform a good cell segmentation QC, such as finding doublets. But I think it’s a very exciting approach to this kind of data.
*In our recent webinar, Dr. Bayraktar introduced his collaborator’s computational model, spaceTree, which enables scalable integration of high-resolution spatial transcriptomics data with reference single cell RNA-sequencing datasets. Deconvoluting Visium HD data with this tool could aid identification of tissue niches or spatial localization of tumor subclones that have a reference single cell profile.
We also invite you to explore our new Analysis Guide on nuclei segmentation and custom binning of Visium HD data.
Back to topHow will Visium HD advance spatial discovery research?
Visium HD builds on the whole transcriptome spatial discovery power of v2 Visium that many researchers have come to know and value in their projects (1–3). It elevates those spatial insights and enriches the potential of each experiment by providing the highest-resolution view of spatial gene expression, and with continuous tissue coverage. There are no gaps between barcoded squares on the Visium HD slide Capture Area so you’re not missing any biology in precious samples. This unbiased, complete view of your FFPE samples promises to unlock biology that may have been overlooked or impossible to see previously in spatially and cellularly complex tissue microenvironments.
In our webinar, Omer Bayraktar, PhD, Group Leader at the Wellcome Sanger Institute, discussed his team’s work to define the cellular trajectories of heterogeneous malignant cell states in glioblastoma (GBM), a deadly brain cancer. Malignant cells in glioblastoma are very diverse, within tumors and between patients, driving the various tumor subtypes characteristic of GBM; however, the mechanisms that regulate their cellular trajectories are unclear. Using an integrated multiomics approach, including single nuclei RNA- and ATAC-seq, Visium Spatial Gene Expression, and Xenium In Situ, across dozens of patient tumor samples, Dr. Bayraktar’s team built a comprehensive GBM malignant and tumor microenvironment (TME) cell state atlas, and mapped the spatial zonation of malignant cell states.
With Visium HD, they have now been able to develop an even more granular, anatomically detailed map of whole transcriptome spatial gene expression in human FFPE GBM samples. This data has provided a higher-resolution view of key anatomical features, including small vasculature, and the spatial transitions between malignant cell states in the same tumor sample—in particular, revealing a previously unappreciated mixing of malignant cell states in tumor regions that, at first glance, appear dominated by a single malignant cell type. This finding would not be possible without a higher-resolution view of the tissue.
Visium HD also revealed spatial colocalization of tumor-associated macrophages enriched for hypoxia (oxygen lack) and angiogenic (blood vessel formation) signatures with a hypoxic malignant tumor cell state, providing insights into a possible functional relationship that can help Dr. Bayraktar’s team understand how hypoxic responses are induced in these cell states.
This is just one example of the discovery power of high-resolution, whole transcriptome spatial gene expression. We can envision even more equally amazing research powered by Visium HD as we look back on the science that customers have already done with our v1 and v2 Visium assays, some of which is featured in our favorite Visium publications from 2023.
Back to topJoin the new era of spatial discovery with Visium HD
Our excitement to introduce Visium HD to the world ultimately pales in comparison to the excitement and anticipation we feel thinking about how you will use this technology to transform biology and make breakthroughs for human health. We hope Visium HD can be a tool in your hands to empower the next era of spatial discovery, and a platform for continuous innovation in the field of sequencing-based spatial biology and data analysis.
As we begin to see scientists applying Visium HD to their own projects, we encourage you to stay up to date by exploring our available Visium HD resources. Our human and mouse FFPE datasets are a valuable tool to keep learning about the output of the Visium HD assay and the kinds of findings it can enable for your research. And, if you’re ready to get started, you can find Visium HD user guides and other support documents here.
References:
- Madissoon E, et al. A spatially resolved atlas of the human lung characterizes a gland-associated immune niche. Nat Genet 55: 66–77 (2022). doi: 10.1038/s41588-022-01243-4
- Watanabe R, et al. Spatial gene expression analysis reveals characteristic gene expression patterns of de novo neuroendocrine prostate cancer coexisting with androgen receptor pathway prostate cancer. Int J Mol Sci 24: 8955 (2023).
- Zhang S, et al. Spatial transcriptomics analysis of neoadjuvant cabozantinib and nivolumab in advanced hepatocellular carcinoma identifies independent mechanisms of resistance and recurrence. bioRxiv (2023). doi: 10.1101/2023.01.10.523481