Mouse Tissue Microarray in 5x5 Layout with 1 mm Edge to Edge Spacing (FFPE)
Spatial Gene Expression dataset analyzed using Space Ranger 2.0.1

Learn about Visium Analysis
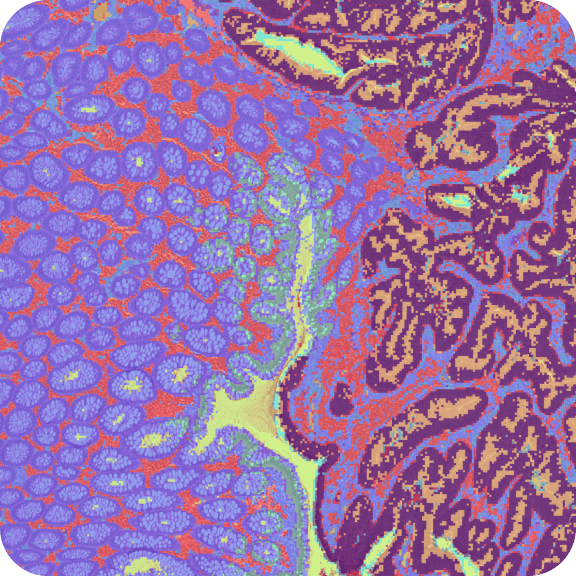
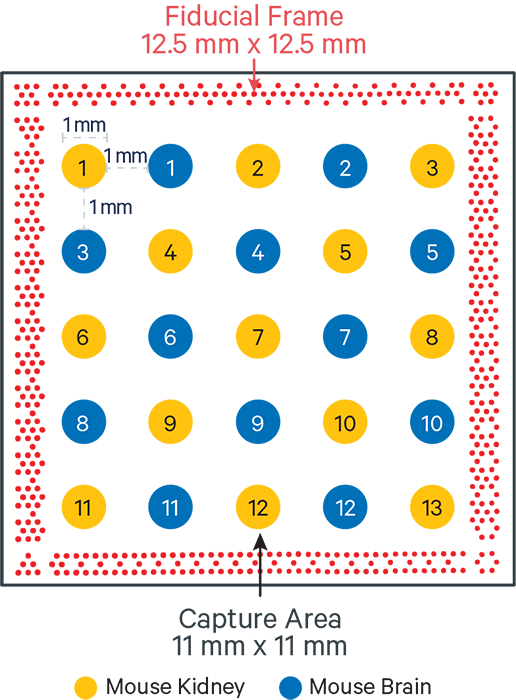
10x Genomics obtained FFPE mouse kidney and brain tissue microarray (TMA) sections from Acepix Biosciences. The TMA cores of 1 mm diameter were laid out in a 5x5 grid layout with 1 mm edge to edge spacing. Acepix Biosciences sectioned the TMA block according to their standard protocol. Tissue section of 5 µm was placed on a standard glass slide, and H&E-stained following deparaffinization. Sections were coverslipped with 85% glycerol, imaged using a color camera, decoverslipped, followed by destaining & decrosslinking Demonstrated Protocol (CG000520). The glass slide with tissue section was processed via Visium CytAssist instrument to transfer analytes to a Visium CytAssist Spatial Gene Expression slide with 11 mm Capture Area. The probe extension and library construction steps follow the standard Visium for FFPE workflow outside of the instrument.
The TMA layout on the Visium CytAssist Spatial Gene Expression slide with 11 mm Capture Area.
The H&E image was acquired using Olympus VS200 Slide Scanning Microscope with these settings:
- Olympus objective magnification: 20x UPLXAPO Objective
- Numerical Aperture: 0.8
- Camera: iDS (VS-264C) color camera with 3.45 um pixel size
Libraries were prepared following the Visium CytAssist Spatial Gene Expression Reagent Kits for FFPE User Guide (CG000495).
- Sequencing instrument: Illumina Novaseq
- Sequencing depth: 635,086,808 reads / 62.8% sequencing saturation
- Sequencing configuration: 28 bp read 1 (16 bp Visium spatial barcode, 12 bp UMI), 90 bp read 2 (transcript), 10 bp i7 sample barcode and 10 bp i5 sample barcode
- Dual-Index set: SI-TS-H2
- Slide: V52Y10-307
- Area: B1
Key metrics were:
- Spots detected under tissue: 2,805
- Median genes per spot: 9,207
- Median UMI counts per spot: 66,412
This dataset is licensed under the Creative Commons Attribution 4.0 International (CC BY 4.0) license. 10x citation guidelines available here.