
Join our webinar.
Register now全转录组空间发现
灵活的分析,满足您的不同需求
概览
HD WT Panel基因表达
覆盖蛋白编码基因
在研究人类和小鼠的差异基因表达时推荐使用
灵活的组织兼容性
测序效率极高的Visium HD分析
HD 3’基因表达
覆盖全转录组
适用于扩展型发现应用的推荐检测方法
广泛的物种兼容性
支持从头发现,包括异构体、TCR/BCR等
化学方法
Probe-based
3' poly(A) capture-based (Reverse transcription)
兼容物种
Human
Mouse
Agnostic
兼容样本
FFPE tissue
Fresh frozen tissue
Fixed frozen tissue
Fresh frozen tissue
起始样本
Tissues sectioned onto glass slides
Tissues sectioned onto glass slides
玻片结构和分辨率
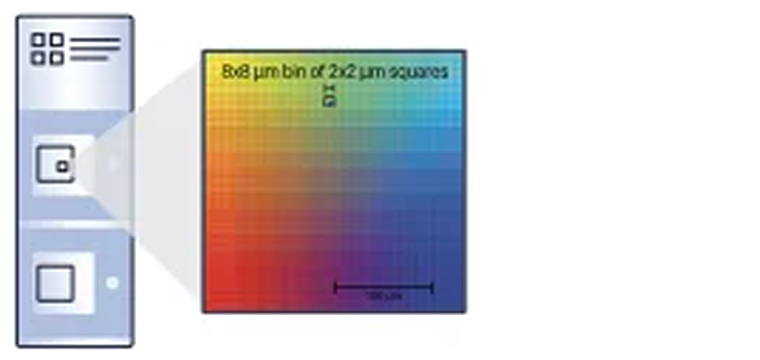
Continuous lawn of 2 μm x 2 μm barcoded squares for single cell–scale resolution
Continuous lawn of 2 μm x 2 μm barcoded squares for single cell–scale resolution
捕获区域大小
6.5 x 6.5 mm (2 Capture Areas per slide)
11 x 11mm(每张玻片2个捕获区域)
6.5 x 6.5 mm (2 Capture Areas per slide)
同一组织切片上的多重分析能力
Gene expression
Protein (IF)
Morphology (H&E)
Gene expression
Morphology (H&E)
First-generation assays
v2 WT Panel基因表达
覆盖蛋白编码基因
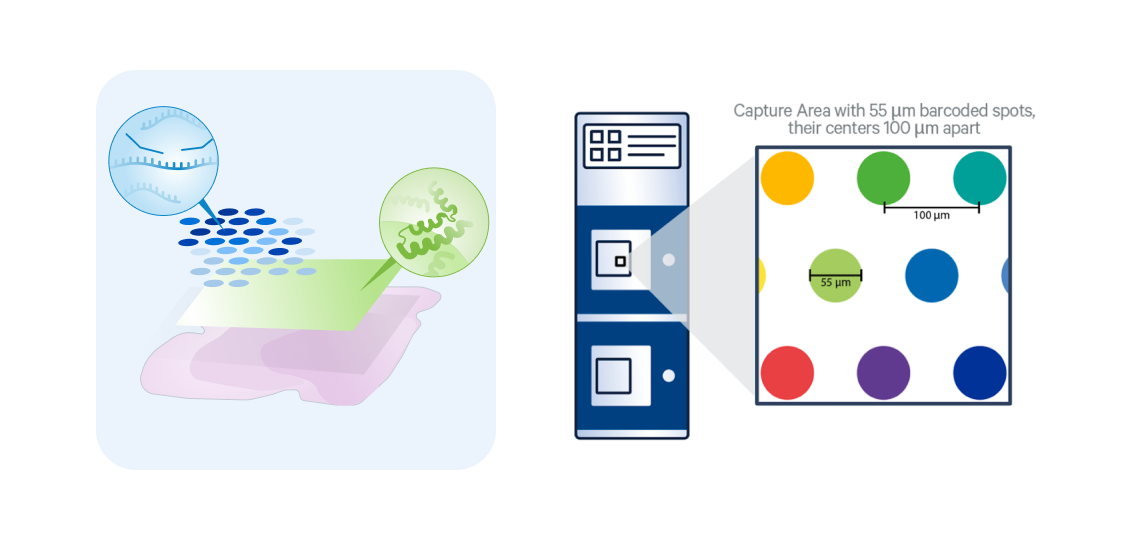
基于探针的化学方法,适用于人类和小鼠的FFPE、新鲜冷冻和固定冷冻组织
多组学选项,提供以免疫肿瘤学为重点的蛋白检测组合
每个55 µm条形码标记捕获点的分辨率为1-10个细胞
V1 3’基因表达
覆盖全转录组
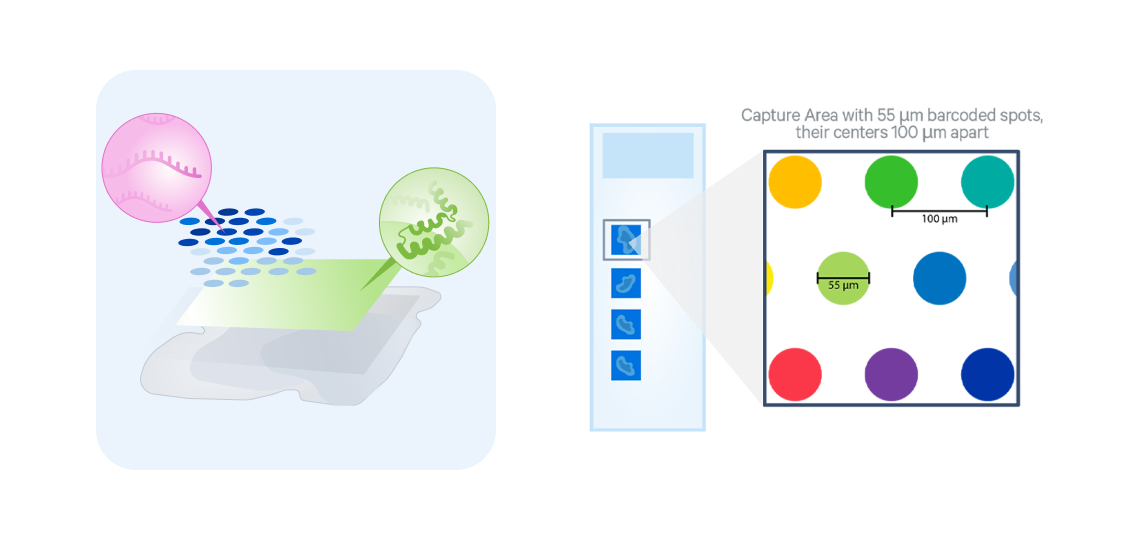
基于3’ poly(A)捕获的化学方法,适用于广泛物种的新鲜冷冻组织
每个55 µm条形码标记捕获点的分辨率为1-10个细胞
专题资源
入门资源
Explore the unique strengths and applications of the 10x spatial portfolio, plus compare and contrast the Visium and Xenium platforms to find the right fit for your needs.
Get the information you need to write grants featuring Visium experiments (including a technology overview, benchmarking data, and more).
Find helpful user guides and technical documents to get started with Visium HD spatial assays.
精选文献
Demonstrated the Visium HD assay has superior spatial fidelity compared to other commercially available sequencing-based spatial transcriptomics platforms.
Mapped critical immune cell interactions in the colorectal tumor microenvironment.
Discovered that regionalized signalling drives two distinct T-cell states in the small intestine.