このデータセットについて
- 生物種および組織ヒト膵臓
- 疾患腺がん
- 遺伝子パネル名Xeniumヒトマルチ組織 + アドオン遺伝子発現
- 保存方法FFPE
- 領域面積 (µm²)22,386,228
- 高品質にデコードされた転写産物の総数23,926,081
- mRNAターゲット数474(377ベース + 97アドオン)
Dig into insights from this dataset
Xenium in situ maps 474 RNA transcripts in a human cancer tissue array with subcellular resolution.
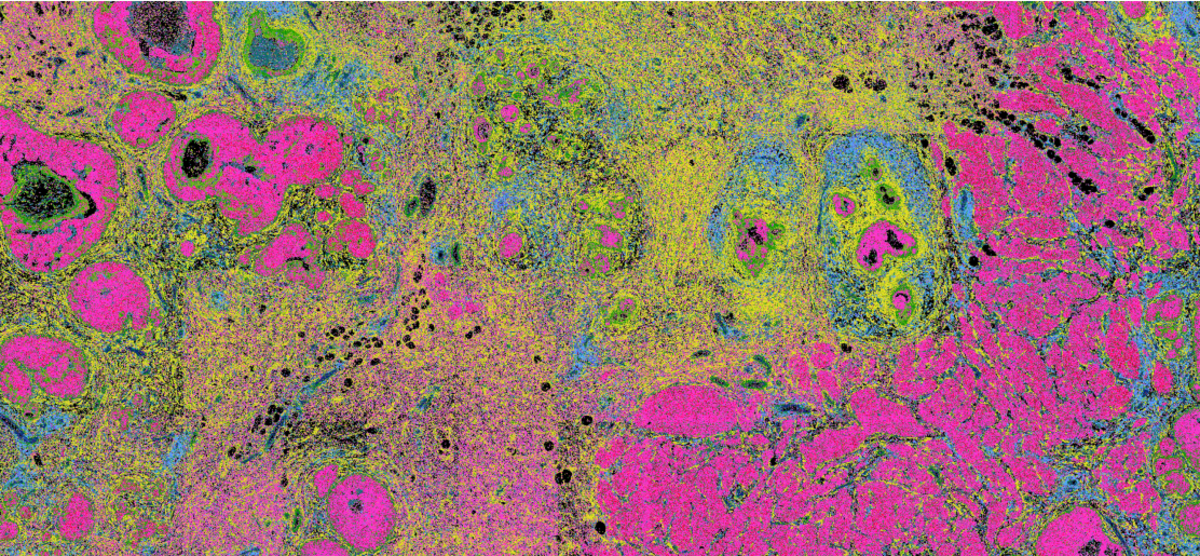
Nine cancer tissue sections fit on the large Xenium capture area. Here we explore a human pancreatic cancer section. All high quality transcripts are shown as a density map, and then viewed as per-gene localization plots. Yellow is high expression, green is mid-level expression, and blue is low or zero expression.
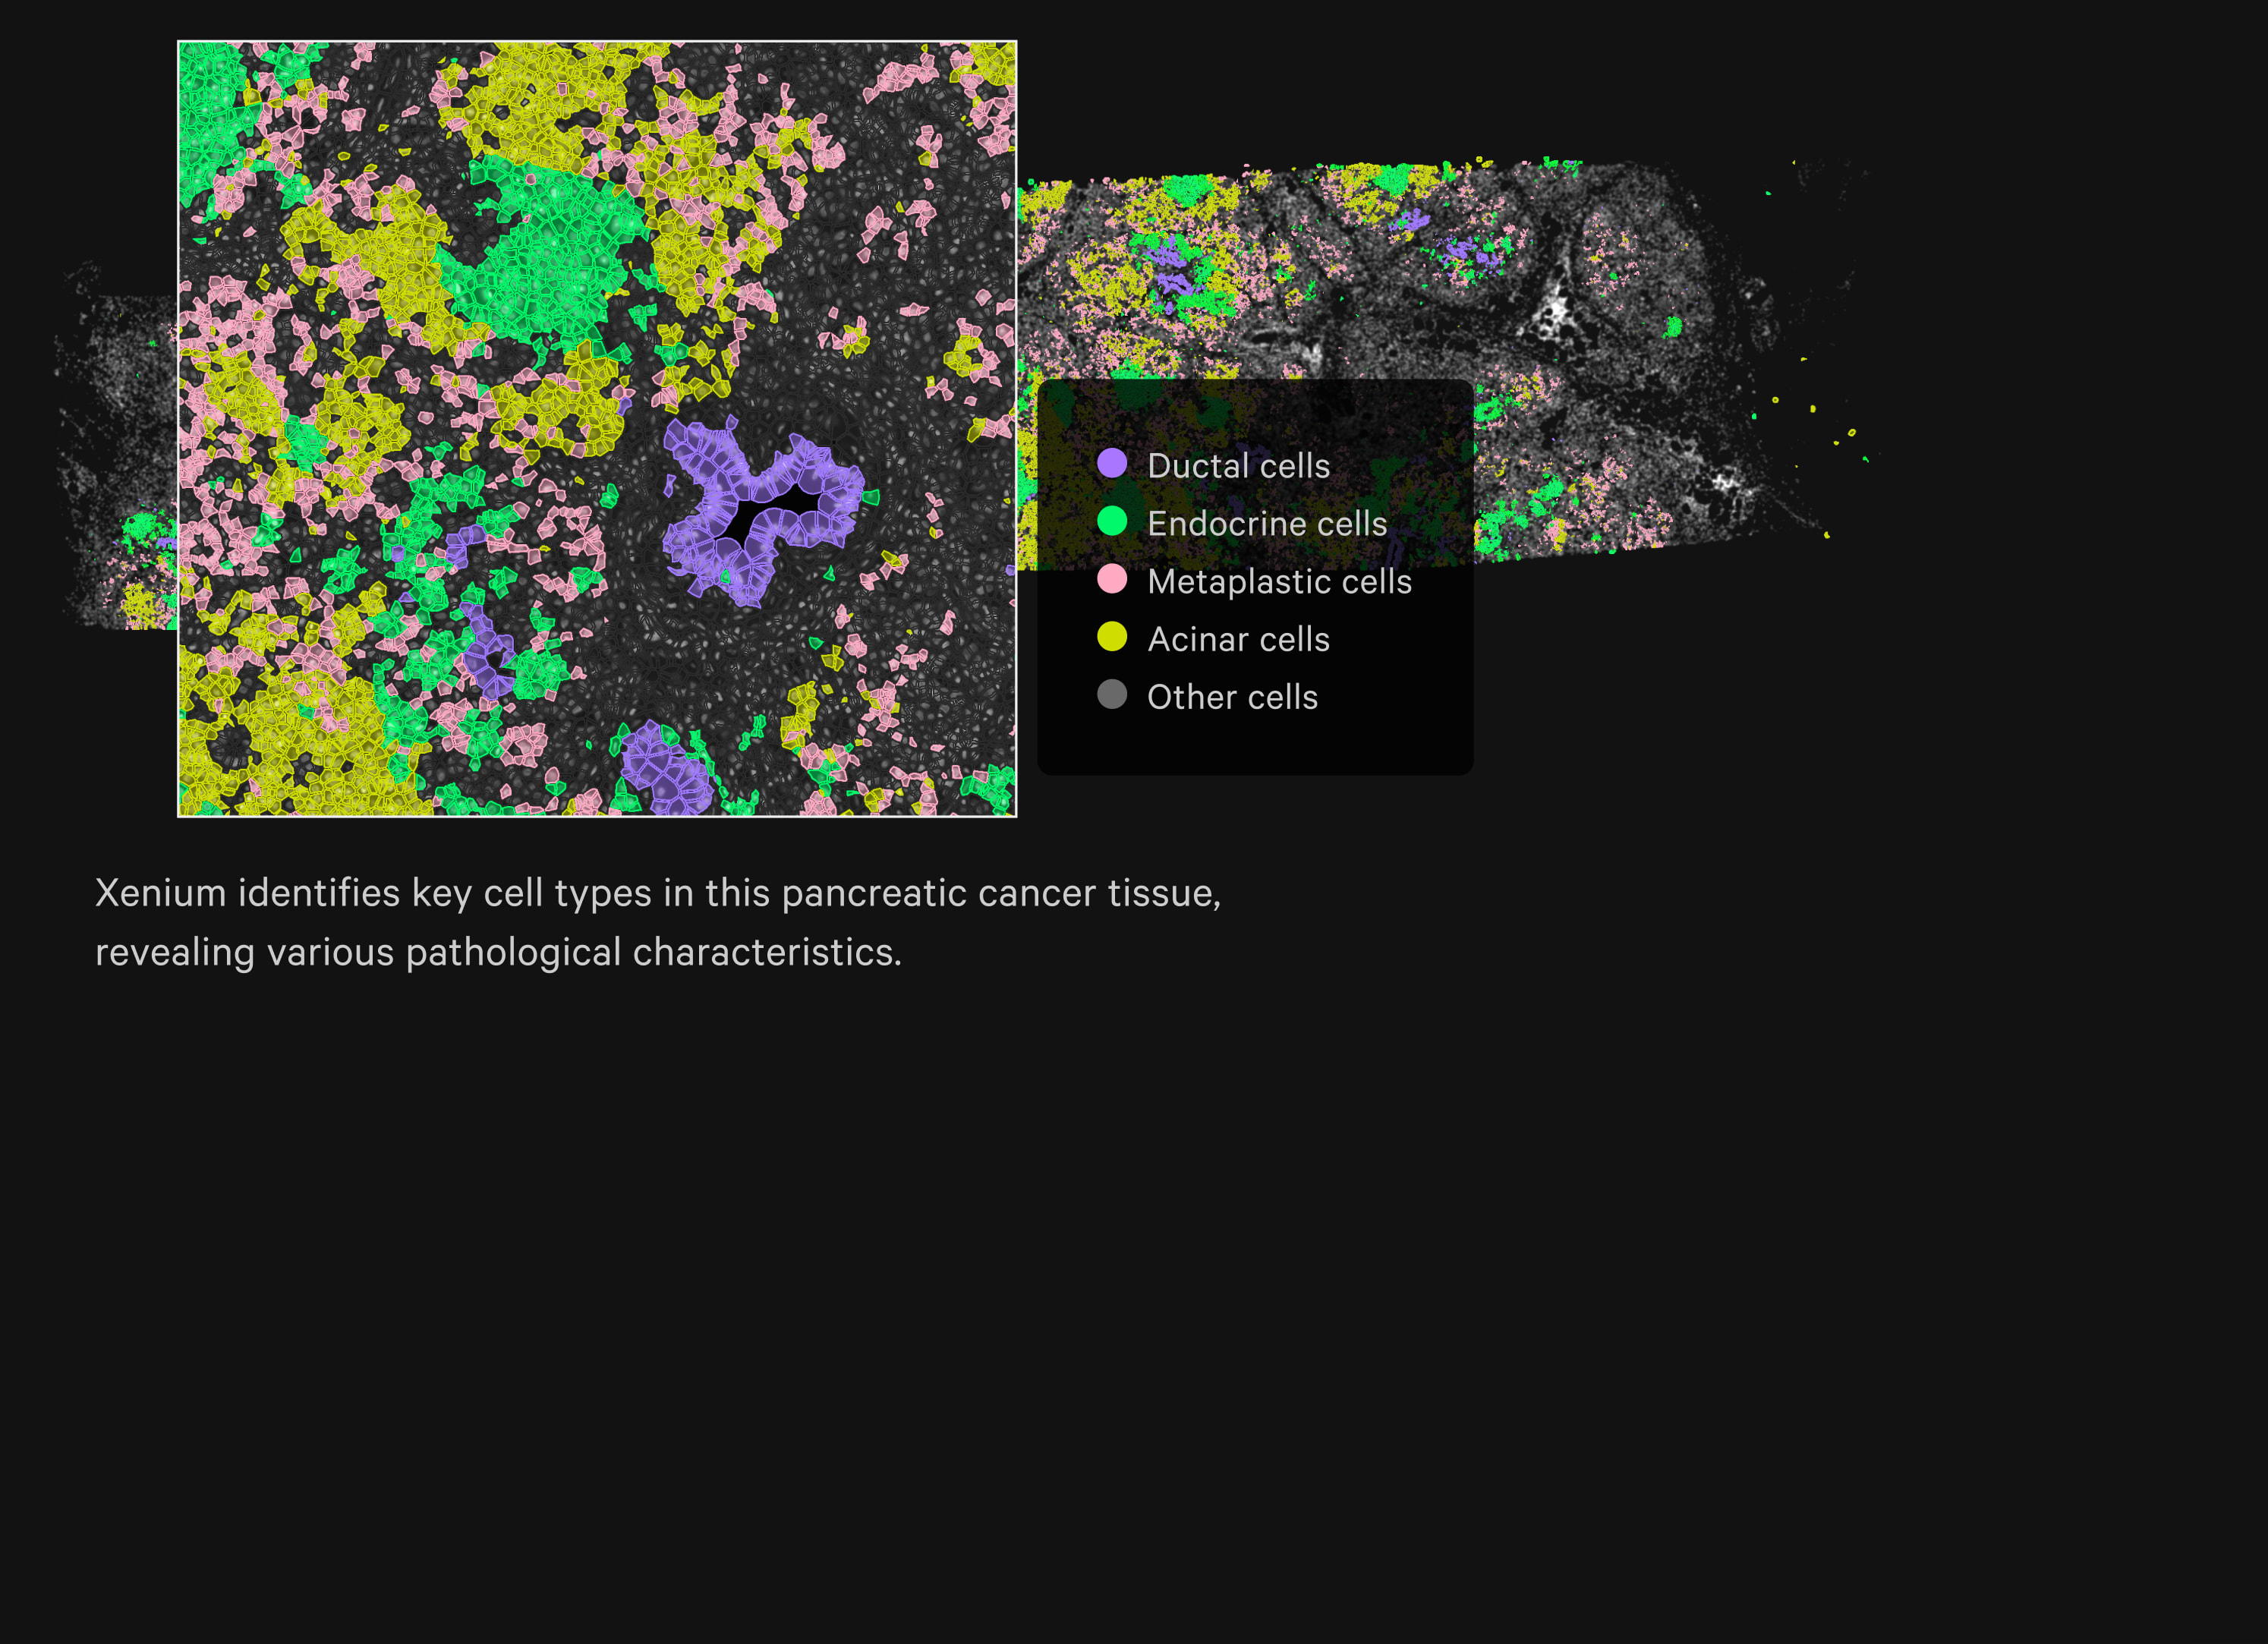
The Xenium Human Multi-Tissue and Cancer Panel identifies a wide variety of cell types.
All expected pancreatic cell types are clearly identified: acinar (secretory exocrine cells), endocrine cells, and ductal cells. A diversity of immune cells can also be distinguished, including lymphatic endothelial cells. At least three different tumor subtypes are resolved. One subtype is distinguished by lack of CFTR (cystic fibrosis transmembrane conductance regulator) expression, a gene critical to the ductal secretory function of the pancreas. Another subtype consists of metaplastic acinar cells which have acquired tumor and ductal gene expression.
Tissue morphology is preserved post-Xenium and is viewable alongside cell type visualization.
Pancreatic cancer cell types are overlaid and registered to an H&E image derived from the same section stained post-Xenium and post-immunofluorescence.
Pancreatic Polypeptide (PPY) Protein and RNA expression are highly correlated.
Immunofluorescence staining with B cell marker CD20 (white), tumor marker TROP2 (red), and endocrine F cell marker PPY (green) was performed on the same section post-Xenium. Registration with the Xenium data allows for the overlay of cell segmentation and RNA transcripts such as PPY. Correlation plot between Xenium PPY transcript count (Q-Score ≥ 20) and PPY immunofluorescence (AU = arbitrary units of fluorescent intensity) yields a Spearman’s r of 0.8.
Cell neighbors are identified using K-D Tree secondary analysis then validated with Xenium Explorer.
For each cell type, a K-D Tree was queried to identify all the other cell centroids that fall within a certain radius. Using the resulting indices from each query, cell types were tallied and neighborhood proportions for each cell type were plotted as stacked bar plots. Using the lasso tool in Xenium Explorer, cell proportions were validated and compared to the secondary analysis.
Each tumor cell subtype is surrounded by unique cell neighborhoods.
Stacked bar plots of cell type proportions for tumor cells, metaplastic cells, CFTR− tumor cells, and acinar cells, excluding “self” identities. Tumor cells are surrounded predominantly by other tumor subtypes. Metaplastic tumor cells (which express acinar genes such as ANPEP) neighbor other acinar cells and tumor cells. CFTR− tumor cells are predominantly adjacent to macrophages, suggesting that this cell subtype is more likely to be associated with tumor growth, progression, and invasiveness (Poh & Ernst, 2021).
Poh A and Ernst M. Tumor-Associated Macrophages in Pancreatic Ductal Adenocarcinoma: Therapeutic Opportunities and Clinical Challenges. Cancers: 12, 2021.
Xenium In Situを深く掘り下げる
ヒトマルチ組織・がんパネルに加えて、ヒト乳房、ヒト脳、ヒト肺、ヒト皮膚、ヒト結腸、マウス脳、マウス組織アトラスなどのパネルや、研究に合わせた追加パネルまたは独立したカスタムパネルなど、慎重にデザインされキュレーションされた多様なパネルが提供可能です。
ヒト乳がん
280個の遺伝子で構成されるXenium Human Breast Gene Expression Panelに33個の遺伝子を追加したパネルを使用して組織面積0.4 cm2のヒト乳がんサンプルから得られたXenium In Situデータセットを探索できます。
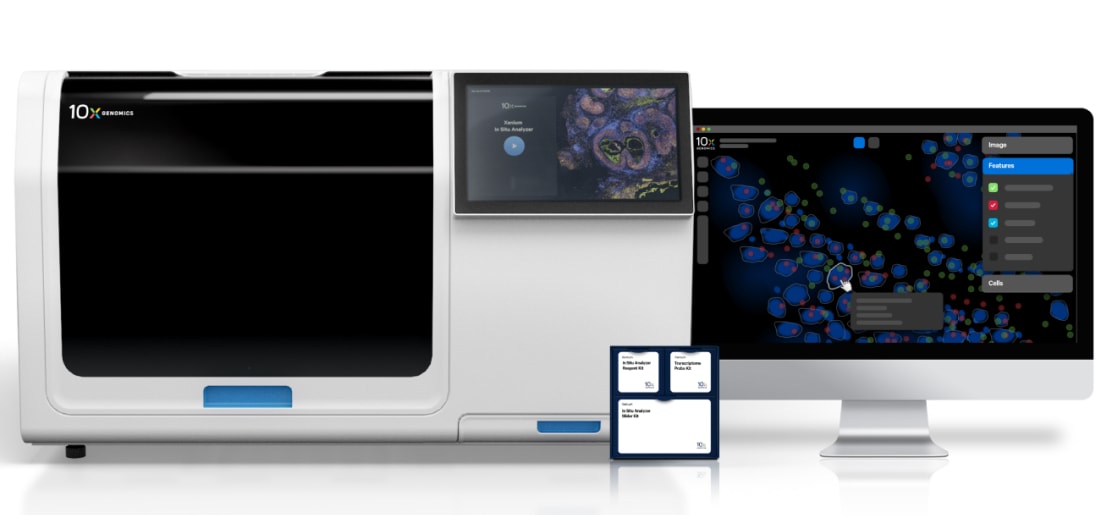
Xenium In Situプラットフォーム
- 高解像度in situ遺伝子発現マッピング
- 専門的なキュレーションがなされたカスタマイズ可能なコンテンツ
- 使いやすいハイスループットアナライザー
- 直感的な視覚化ソフトウェア