After uploading input files into your project in Cloud Analysis (either via web uploader or CLI), you are ready to analyze your data. Consider the following questions as you decide how to set up your analysis in the 10x Cloud web app:
- Are you analyzing a single sample or multiplexed data?
- What are you mapping your sequence data to? (e.g., transcriptome references, probe sets, VDJ references, Feature Barcode references)
- Are default parameters sufficient for your analysis, or do you want to change advanced parameters?
The FASTQ files uploaded into your project are automatically grouped into sets upon upload. To determine the appropriate pipeline for your data analysis, you must specify the library or feature type corresponding to the FASTQ sets that you are analyzing.
Tips for library type selection:
- The library type name reflects the corresponding assay User Guide and kit that was used to generate the data.
- For multiplexed data, you must select the library types with "Multiplex" in the name for all libraries in the dataset to differentiate between single sample ("Singleplex") data. This selection determines which analysis form is generated in the analysis set up step.
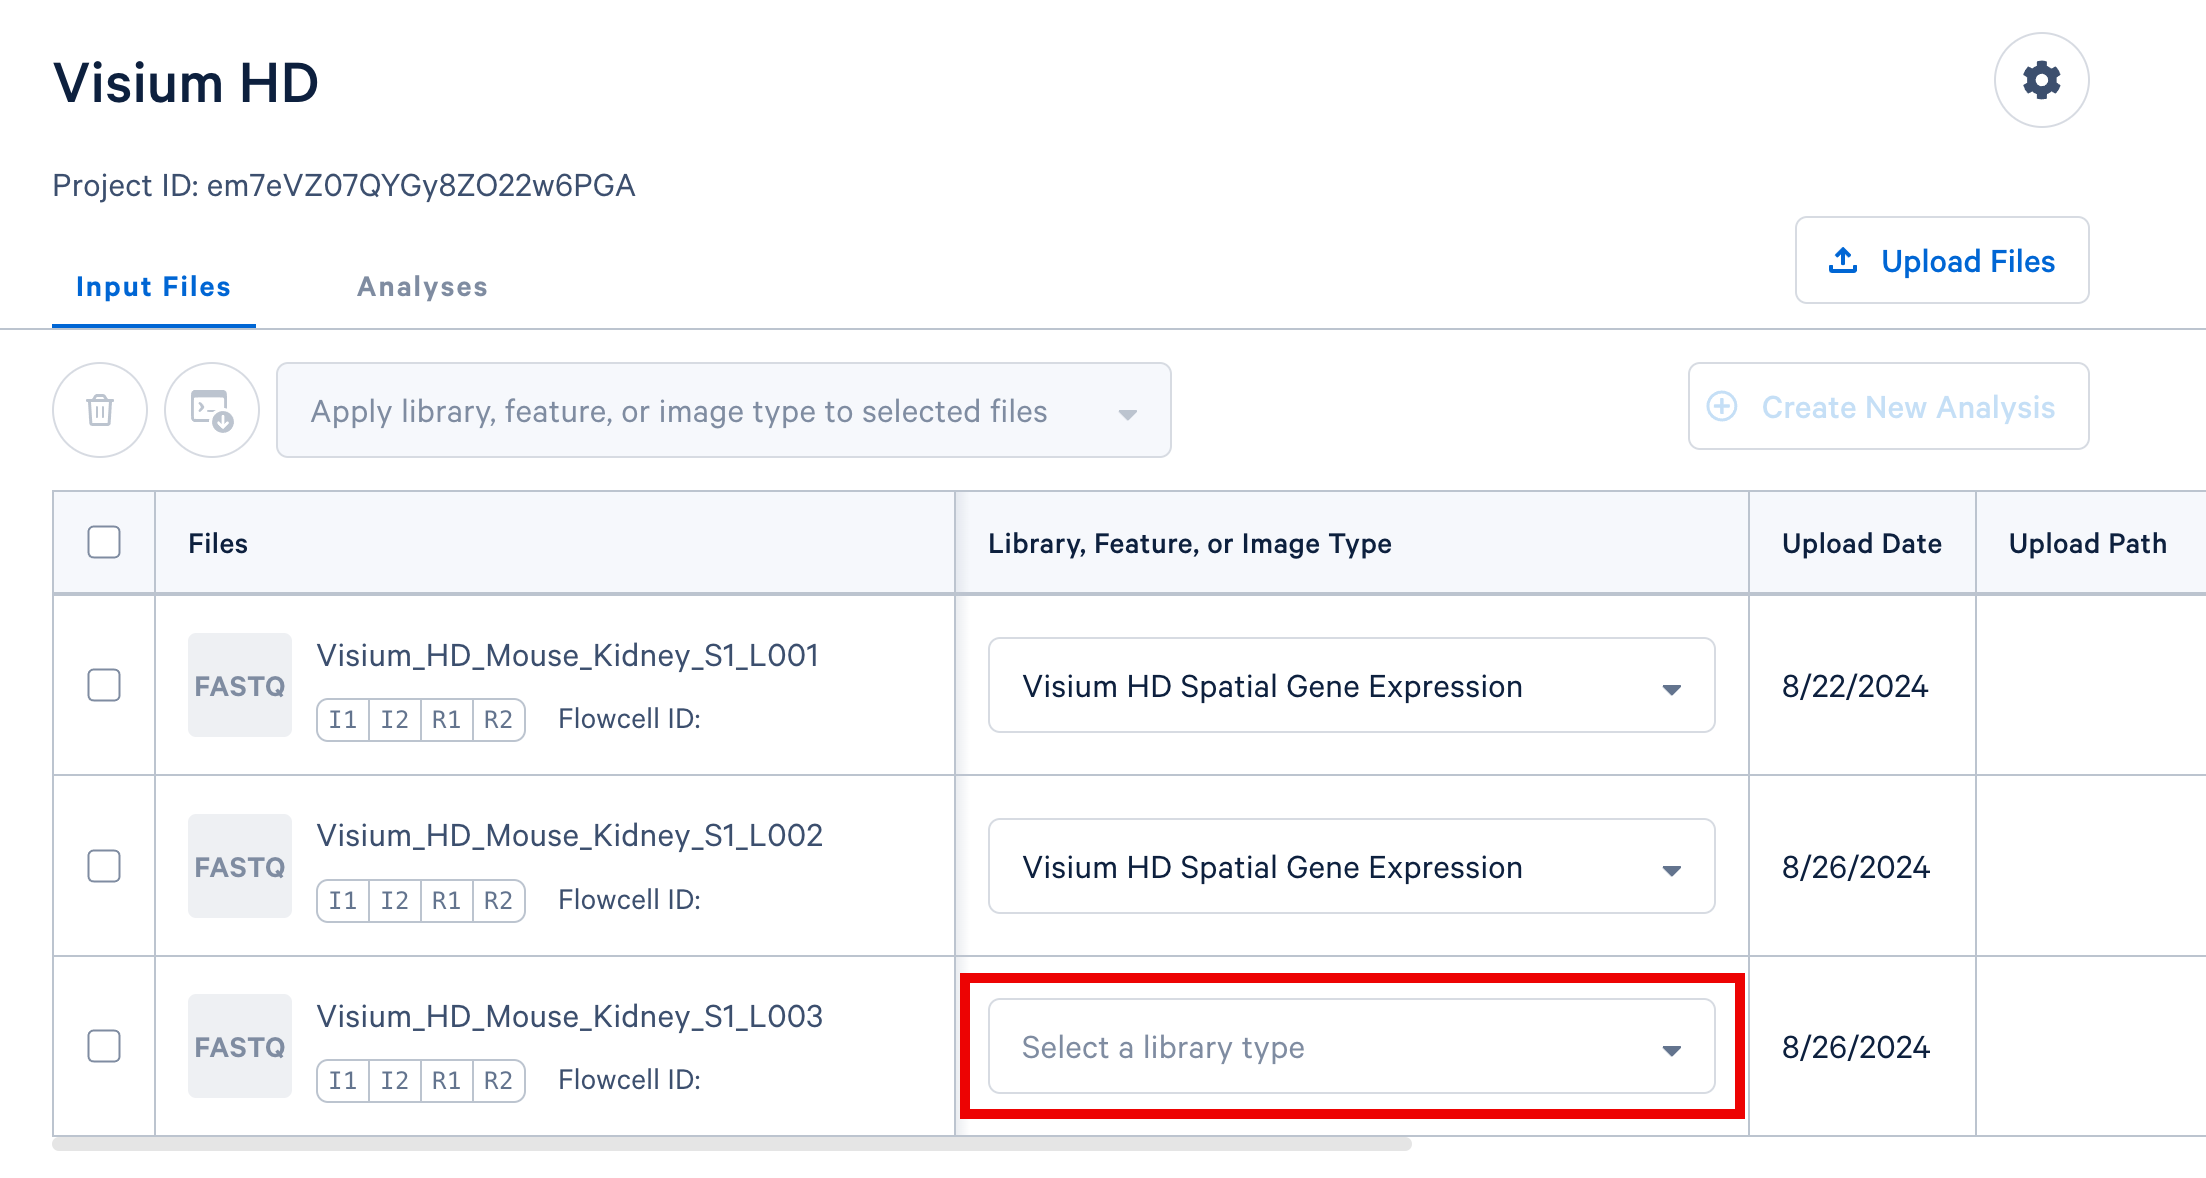
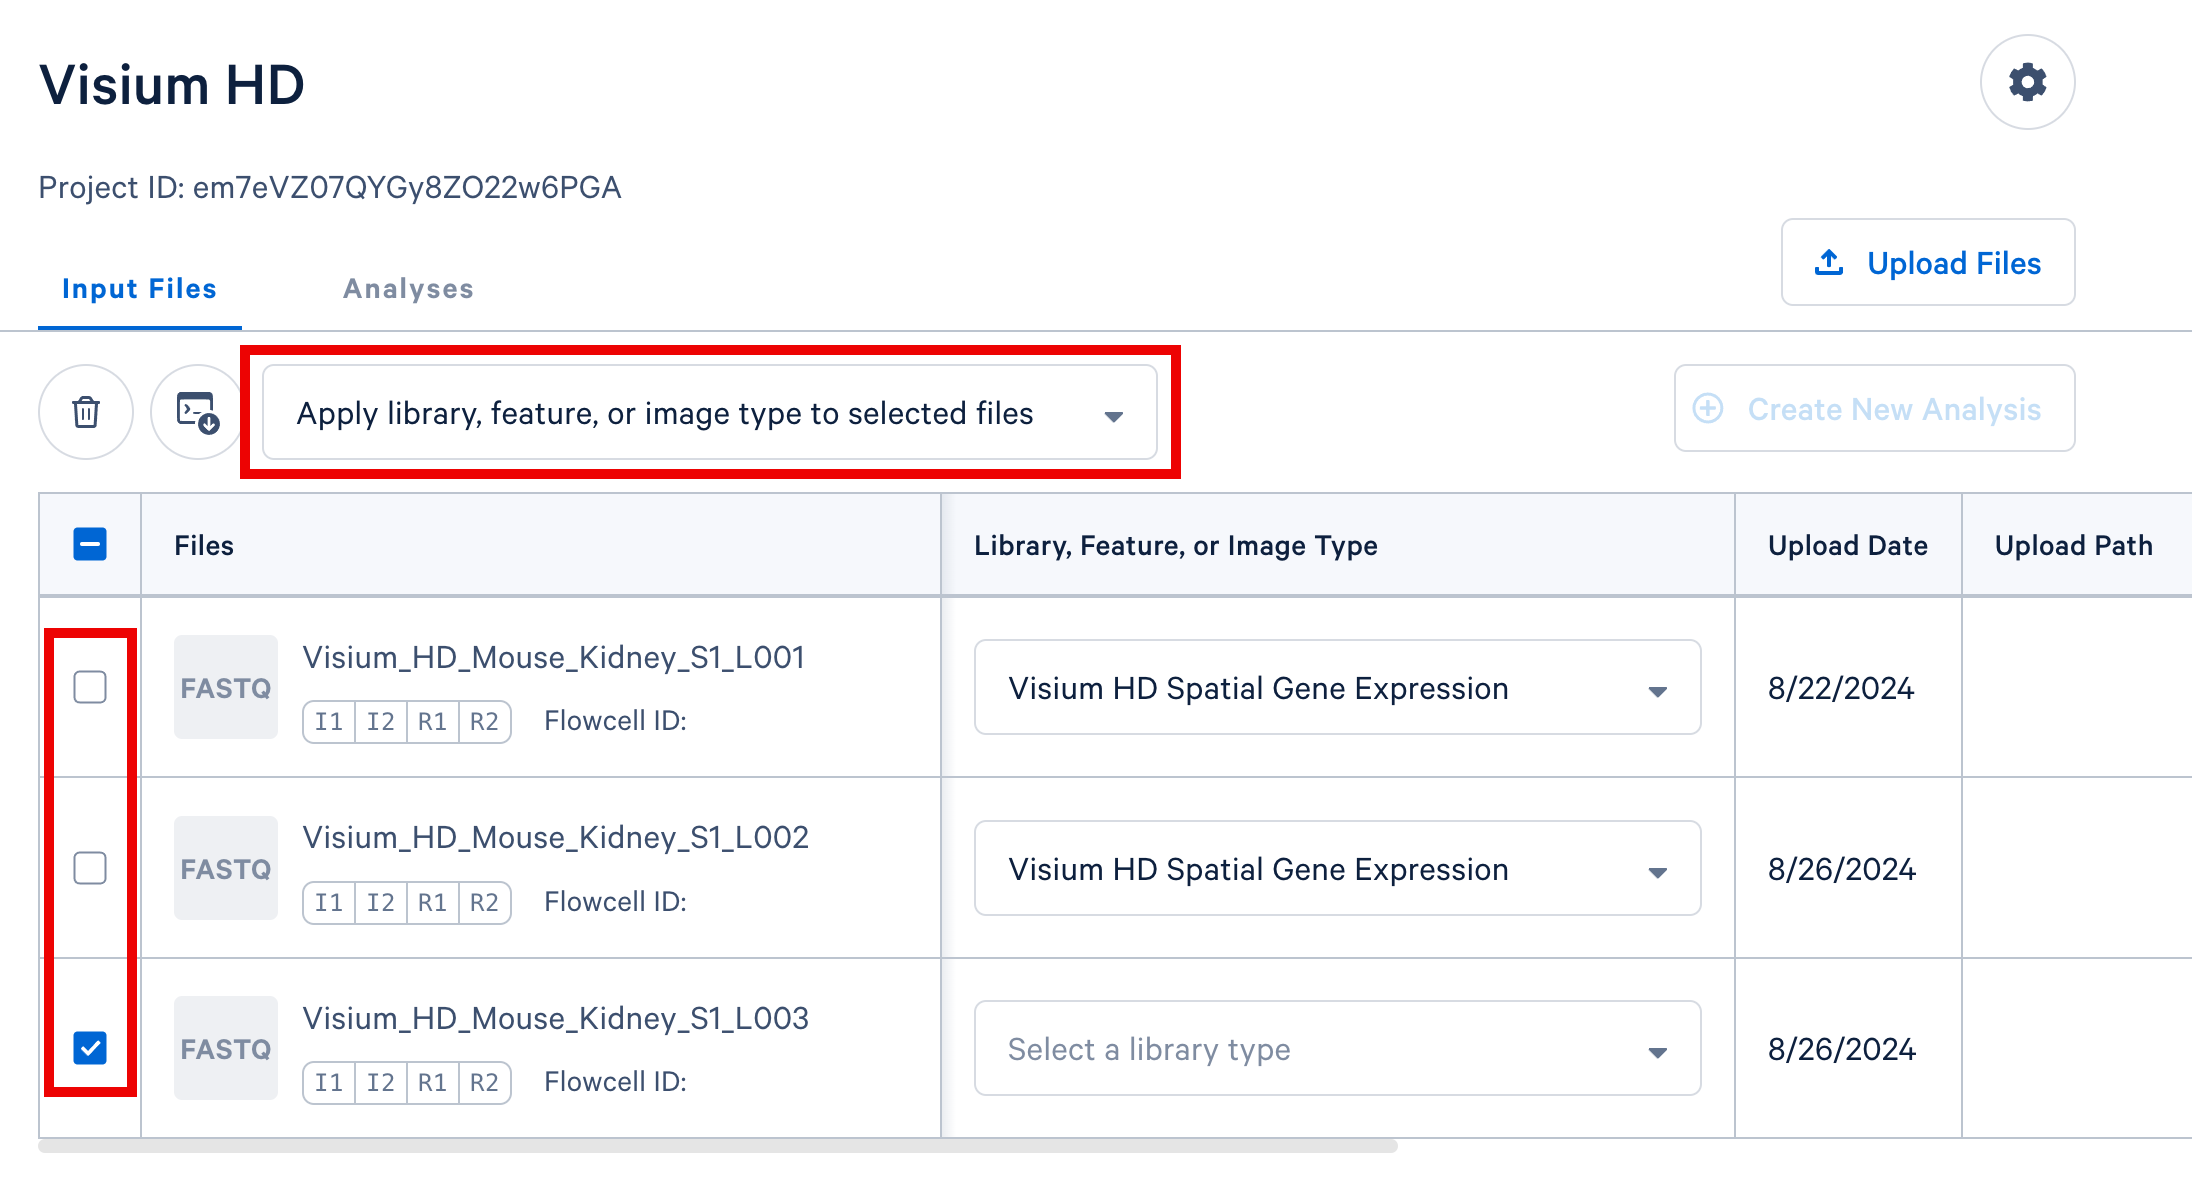
In the example below, we analyze a Visium HD mouse kidney dataset within a project titled Visium HD. There are two ways to specify library and feature types:
-
Option 1: Assign type values one at a time using the dropdown selectors in each row, as shown below.
-
Option 2: For datasets with multiple FASTQ sets sharing a library or feature type, select those rows in the table. Then, use the selector above the FASTQ file table (shown below) to apply a single library or feature type value to all selected rows.
For Flex Gene Expression datasets (both Flex v1 and Flex v2), the library types names reflect whether the data represents a single sample or multiplexed samples. The user guide used to generate the data is a good indicator for the library type name, as shown below. This logic applies to all 10x products supported on the 10x Cloud.
| User Guide | Cloud library type name(s) |
|---|---|
| GEM-X Flex Gene Expression Reagent Kit for Multiplex samples | "GEM-X Flex Gene Expression Multiplex" |
| GEM-X Flex Gene Expression Reagent Kit for Singleplex samples | "GEM-X Flex Gene Expression Singleplex" |
| GEM-X Flex Gene Expression Reagent Kit for Multiplex samples with Feature Barcode technology for Protein Expression |
|
| GEM-X Flex Gene Expression Reagent Kit for Singleplex samples with Feature Barcode technology for Protein Expression |
|
There are several methods for multiplexing data with the Universal 3' and 5' assays. The library type selection indicates the method the web app so it autogenerates the correct analysis set up form.
On-chip multiplexing datasets
- Select the FASTQ files corresponding to the Gene Expression library and specify the appropriate library type that includes "OCM" in the name. For example, "GEM-X 3' Gene Expression v4 Multiplex (OCM)" or "GEM-X 5' Gene Expression v3 Multiplex (OCM)".
- If the dataset includes another library, such as Antibody Capture, select those FASTQs and specify library type as "Antibody Capture Multiplex (OCM)".
- See OCM Cell Ranger documentation for analysis consideration details.
Cell or sample multiplexing with Antibody Capture data
- Select the FASTQ files corresponding to the Gene Expression library and specify the appropriate library type. Then, select the FASTQ files for the Antibody Capture library and specify library type as "Hashing with Antibody Capture".
- See hashing Cell Ranger documentation for analysis consideration details.
CellPlex multiplexing data
- Select the FASTQ files corresponding to the Gene Expression library and specify the appropriate library type. Then, select the FASTQ files for the Multiplexing Capture library (CMO) and specify library type as "CellPlex Multiplexing Capture".
- See Multiplexing Capture Cell Ranger documentation for analysis consideration details.
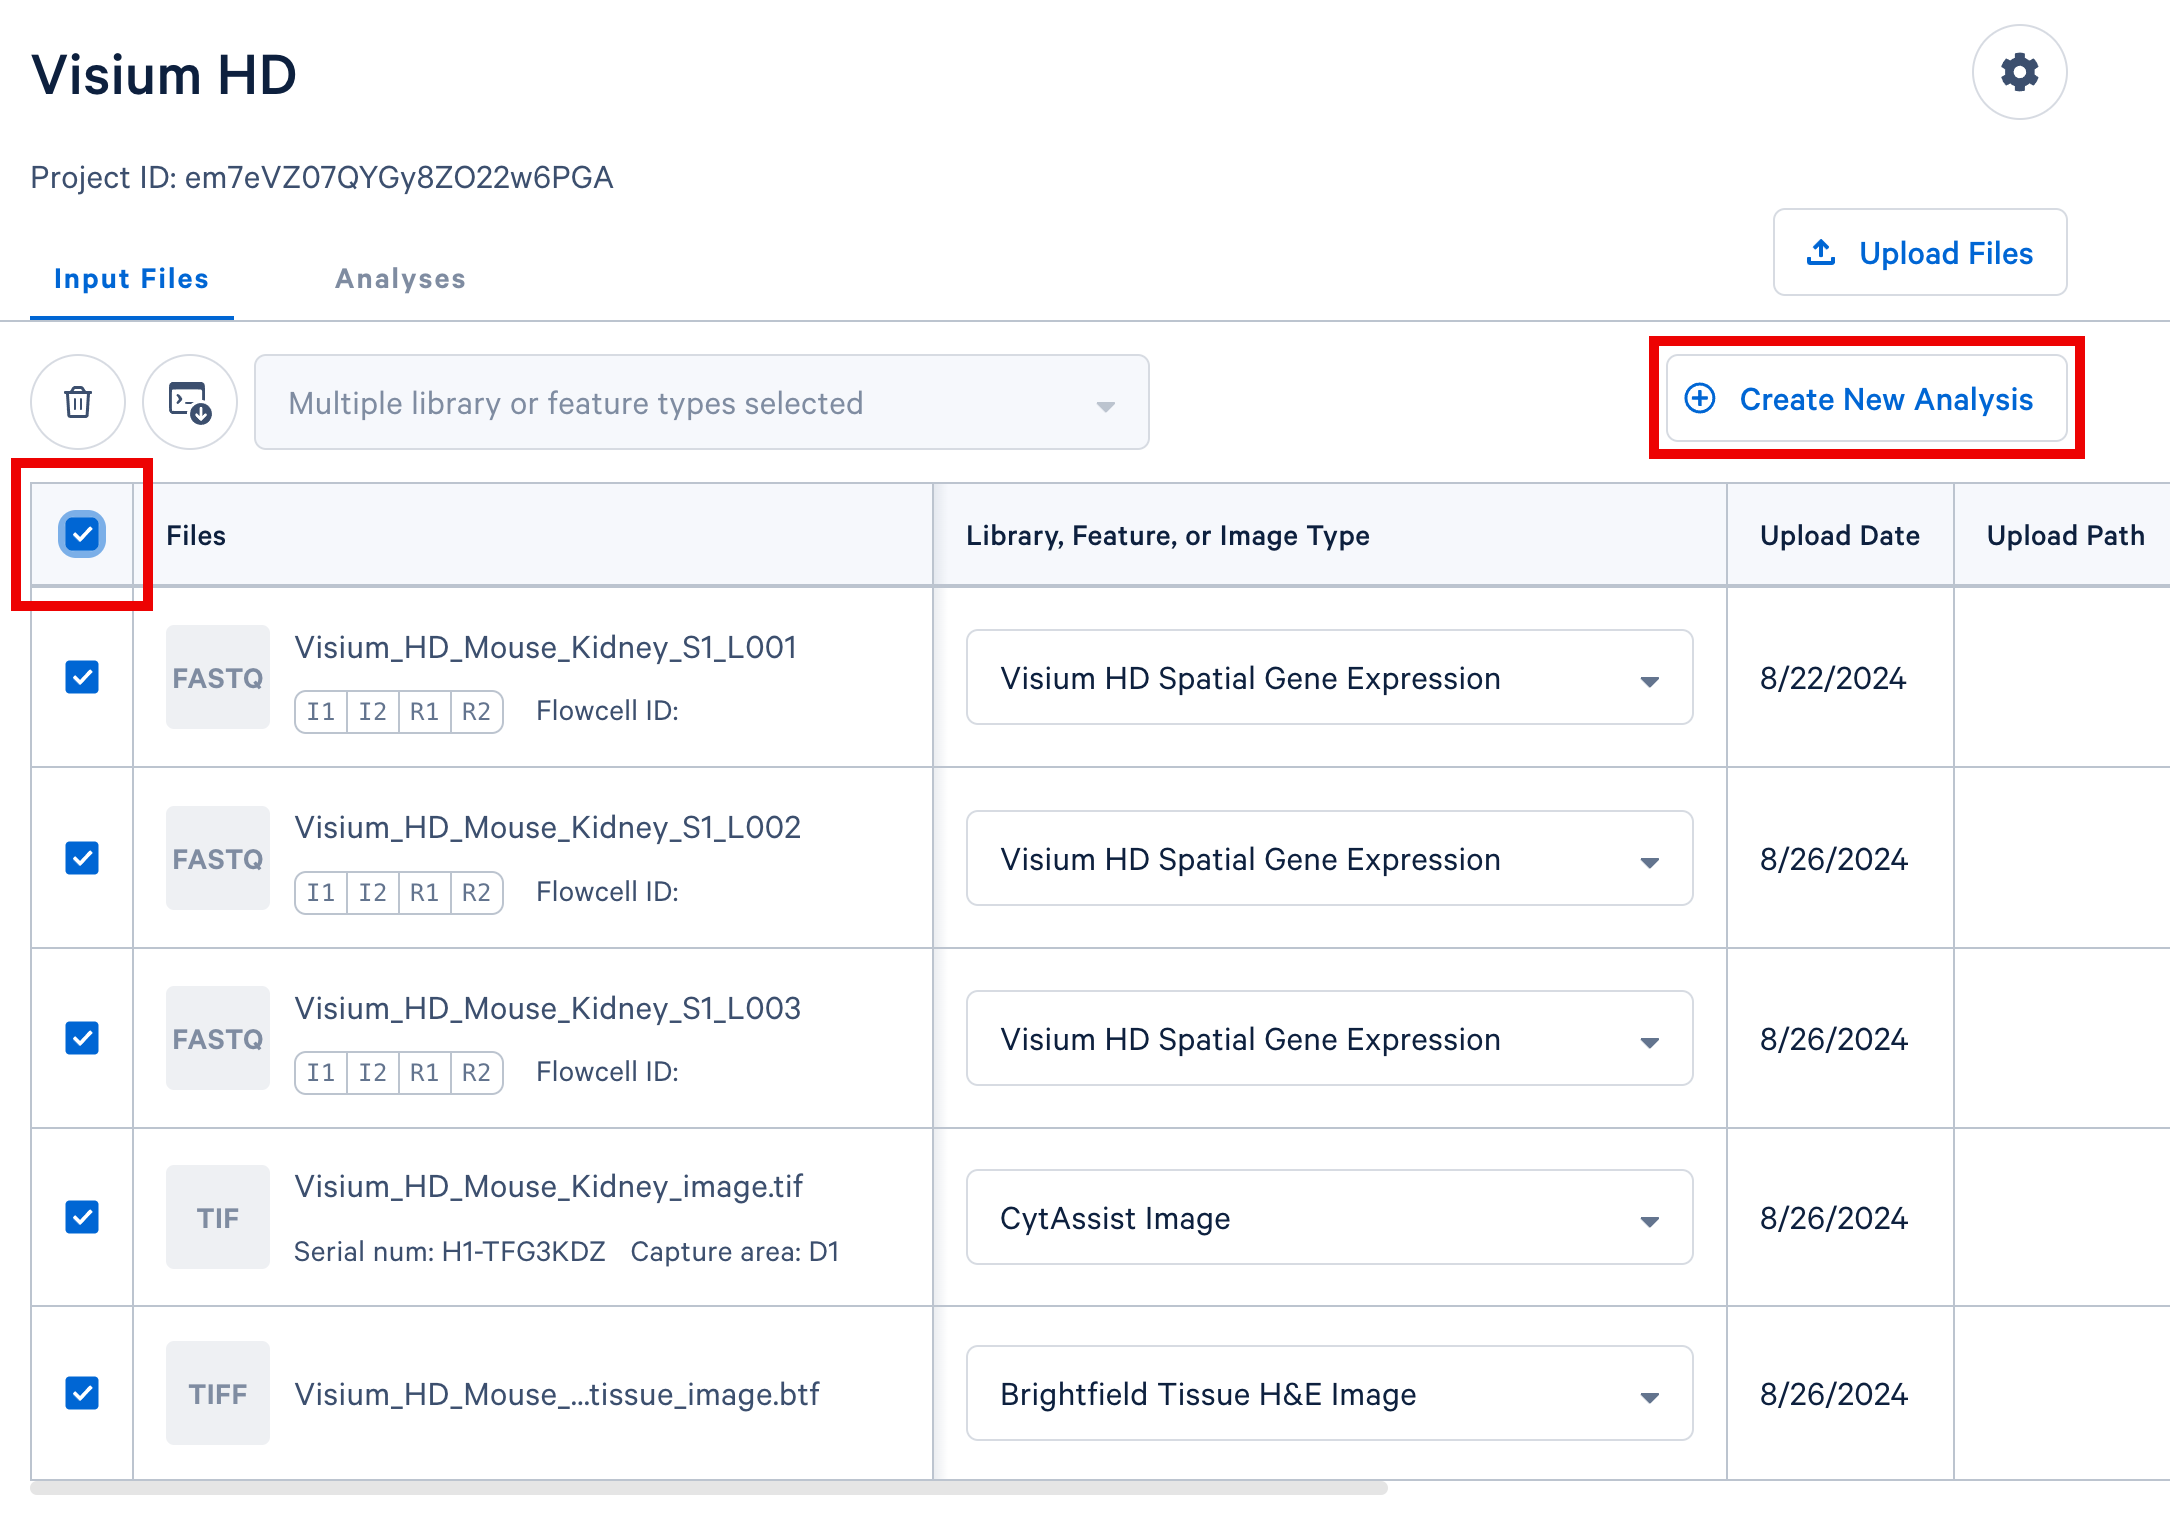
In your Cloud Analysis project, select the input files from a single experiment (either a single GEM well for single cell, or a single slide for spatial) and click the "Create New Analysis" button to proceed.
In this Visium experiment example, we include three sets of FASTQ files from three sequencing lanes, the CytAssist image, and the brightfield H&E tissue image.
aggr pipelines, both Cell Ranger and Cell Ranger ARC require FASTQ files originating from a single GEM well. A GEM well can yield one or more sequencing libraries, and each library can be associated with multiple FASTQ sets based on sequencing configuration. Refer to the Cell Ranger documentation for Universal 3', 5', and Flex Gene Expression assays or the Cell Ranger ARC documentation for multiome data for details and examples regarding GEM wells and sequencing libraries.Depending on the data you are analyzing, the web app will automatically open a setup form corresponding to our recommended pipeline for your data.
- By default, the newest pipeline versions are recommended. You may select older versions from the "Pipeline" field in the setup form.
- Each field has a short description to explain the appropriate usage of default and advanced parameters. For information about any field, please refer to the appropriate documentation:
- Cell Ranger documentation for Single Cell Gene Expression and Immune Profiling data
- Cell Ranger ARC documentation for Epi Multiome data
- Space Ranger count for Visium HD data
cellranger multi analyses, the form autogenerates the multi config CSV file; you do not need to create one. This file will be available for inspection and download after the analysis has been created.Sample Information: For experiments with multiple samples, you can either manually select or type sample and barcode information in the web app, or upload a sample barcode CSV file.
- The CSV file format can be a full multi config CSV or simply the
[samples]section of the multi config CSV file. - The CSV must contain a
sample_idcolumn header to correctly upload to the web app. The barcode ID column name depends on the experiment type. For examples, refer to the Cell Ranger documentation for multiplex multi config CSV formats:
After entering values for all required fields and any applicable optional fields, select the "Run Analysis" button. This will initiate your pipeline run.
Compute time varies based on the size and types of data that you are analyzing, but typically take a few hours to complete. By default, you will receive an email notification when your analyses complete. To disable this notification, update your preferences in Account Settings. After your analysis completes, you can download your output files.
Below is a step-by-step video demonstrating how to create a Cell Ranger analysis on 10x Genomics Cloud Analysis. In this example, one sample was processed in one GEM well and on one flow cell, as illustrated below. After BCL files are converted to FASTQ files (e.g., with Cell Ranger mkfastq or Illumina BCL software), the data can be analyzed with the Cell Ranger count pipeline.
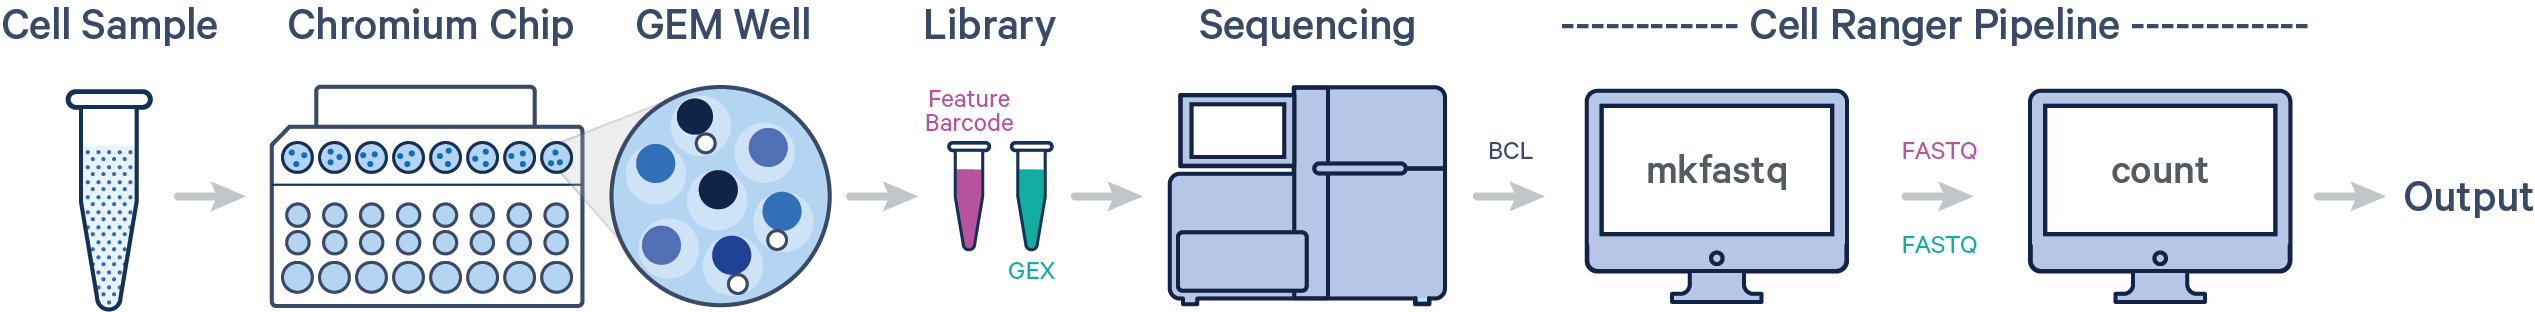
A single GEM well can yield multiple physical libraries: one Gene Expression library and one or more Feature Barcode libraries. The example below has one Gene Expression library.
Cell type annotation can be applied to standard Cell Ranger and Cell Ranger ARC outputs. The annotation model is in beta.
Data integration is the process of merging multiple experiments into a single dataset in order to boost statistical power and enable robust biological comparisons. An important aspect of this process is eliminating confounding technical variations.
Cloud Analysis offers two workflows for data integration:
The optimal choice depends on your experimental design and analysis objectives. Key differences and guidance on when to use each workflow are detailed here. Refer to this Knowledge Base Article for questions related to aggregating gene expression data from different 10x Genomics assay chemistries.
For singleplexed libraries or multiplexed libraries processed on separate GEM wells, the data from each GEM well data must first be analyzed independently using Cell Ranger multi. Subsequently, these individual datasets can be integrated using either the Cell Ranger aggr pipeline or the SCTransform/Harmony workflow.
When handling many samples multiplexed onto a single GEM well (e.g., using OCM), the multiplexed library should be processed using a single Cell Ranger multi run.