Note: 10x Genomics does not provide support for community-developed tools and makes no guarantees regarding their function or performance. Please contact tool developers with any questions. If you have feedback about Analysis Guides, please email analysis-guides@10xgenomics.com.
For over two decades, researchers have used qPCR, microarray, and bulk RNA sequencing technologies to identify genes that are differentially expressed in samples from two (or more) conditions (e.g. cases vs. controls, treated vs. untreated, etc.). Typically, these techniques use bulk tissue as the starting material and sequence multiple biological replicates per condition. While cost-effective and powerful at answering certain biological questions, bulk tissue techniques can have disadvantages. For example, bulk tissue is often heterogeneous, containing many different cell types. If cell populations are not sorted, the measured gene expression is the averaged global gene expression across different cell types. As a result, for genes that are differentially expressed between conditions, results could be confounded by different cell type compositions. For genes that appear to have constant expression in bulk between conditions, the expression levels may actually vary significantly within specific cell types, and averaging across all cell types results in loss of valuable information.
Single cell RNA sequencing allows gene expression measurement for individual cells, and uses that gene expression information to assign cell type labels to each cell, effectively "computationally sorting cells". Therefore, differential gene expression (DGE) between conditions (multi-condition DGE) can be done separately for each cell type, enabling direct interpretation of the underlying differences in biological pathway(s) and/or mechanism(s).
Samples as biological replicates for DGE between conditions
Gene expression profiles of cells from the same sample are known to be correlated. That is, for any given cell type and condition, cells from one sample are likely more similar to each other than cells taken from different samples. Testing gene expression differences across conditions without considering this correlation can lead to pseudoreplication, which occurs when observations not statistically independent are treated as if they are. Besides, ignoring variability in gene expression across samples, and treating cells (as opposed to samples) as independent biological replicates can lead to false discoveries (Squair et al. 2021. Therefore, it is important to treat each sample and not each cell as the experimental unit of interest.
Multi-condition DGE analysis approaches in scRNAseq data
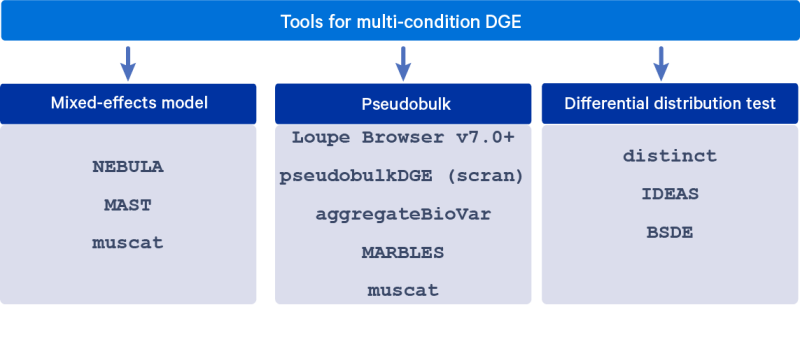
Several DGE algorithms have been developed to account for the grouped nature of cells from the same sample in the differential expression analysis, in order to obtain valid hypothesis testing results. These algorithms include fitting mixed-effects models, summing counts across cells within a sample (pseudobulk), and testing for differences in distributions. This article describes these modeling approaches in detail and lists a few commonly used tools for each of them.
General analysis workflow
After raw data processing, scRNAseq downstream analysis often start with quality filtering and cell type annotation. If multiple samples are being analyzed, these samples can be integrated after batch correction, if required (as described in our Batch Effect Correction Analysis Guide). Cell clustering can be performed in the integrated data. Then each cluster will be assigned a cell type based on the expression levels of putative marker genes. Alternatively, automated cell type annotation methods may be used to annotate each cell type (Web Resources for Cell Type Annotation). Once cell type annotations are available, cell-type specific DGE can be analyzed across conditions. Note that the raw counts should be used for DGE analysis, and not the normalized or batch corrected data, unless specifically noted in the tutorial for a tool.
Mixed-effects model: A classic approach to handling correlated data is via the use of mixed-effects models that use random effects to account for the correlation between observations. The condition/group of interest is modeled as a fixed effect and a sample-specific random intercept models the correlation between cells from the same sample (and cell type).
Pseudobulk: Fitting mixed-effects models at the scale of single cell data (thousands of observations) using standard statistical software is extremely computationally intensive. A simpler approach is to sum up the UMI counts within a cell type for each sample, and proceed with multi-condition DE using methods developed for bulk RNAseq.
Differential distribution test: Rather than testing for a difference in the mean expression of each gene across conditions, single cell data enables us to estimate and understand the distribution of the expression of a gene across cells of the same cell type in each sample. These distributions may have different means, as is addressed by the previous two approaches, but differential distribution testing can also detect more subtle differences, such as a change in variance or the number of modes. We can test whether these distributions are different between conditions/groups.
| Tool name | Description | Approach | Tutorial | Publication |
|---|---|---|---|---|
| muscat | Several variants of mixed-effects models and pseudobulk methods are implemented in this package, and benchmarked in the accompanying paper. | Mixed-effects model or pseudobulk | Differential state analysis with muscat | Crowell HL, et al. muscat detects subpopulation-specific state transitions from multi-sample multi-condition single-cell transcriptomics data. Nat Commun 2020 |
| NEBULA | NEBULA implements faster algorithms for fitting generalized linear mixed-effects models in the context of multi-condition DE with single cell data | Mixed-effects model | Basic usage of NEBULA | He L, et al. NEBULA is a fast negative binomial mixed model for differential or co-expression analysis of large-scale multi-subject single-cell data. Commun Biol 4: 629, 2021 |
| MAST | Tailored to single cell gene expression data that contains many zero counts. In addition to modeling the expression level of a gene, this method also models whether or not a cell expresses a gene. It supports the inclusion of random effects in the model, enabling users to fit mixed-effects models and perform multi-condition DE. | Mixed-effects model | No tutorial available yet. Example code: Zimmerman et al. code for MAST with random effect (line 61) | Finak G, et al. MAST: a flexible statistical framework for assessing transcriptional changes and characterizing heterogeneity in single-cell RNA sequencing data. Genome Biol 16:278, 2015 |
| pseudobulkDGE in scran | A function in the general purpose single cell analysis package scran which wraps two commonly used bulk RNA seq DE tools edgeR and limma-voom for use with single cell data in a pseudobulk approach. | pseudobulk | DE analysis between conditions | N.A. |
| aggregateBioVar | Package which facilitates creating pseudobulk datasets per cell type in the Bioconductor SummarizedExperiment data structure for use in bulk RNA seq differential expression tools. | pseudobulk | Multi-subject scRNA-seq Analysis | Thurman, Andrew L., et al. Differential gene expression analysis for multi-subject single-cell RNA-sequencing studies with aggregateBioVar. Bioinformatics, 19: 3243–3251, 2021 |
| MARBLES | Accounts for known cell type relationships as part of the differential expression analysis, after first pseudobulking the data. Since there are generally known relationships between the different cell types in a dataset (for example, related through a hierarchy), the hypotheses of differential expression for a given gene in each of the cell types may not be independent. | pseudobulk | MARBLES vignette | Zhu B, et al. A Markov random field model-based approach for differentially expressed gene detection from single-cell RNA-seq data. Brief Bioinformatics 2022 |
| distinct | Tests for differences in the distribution of gene expression between conditions. First the empirical distribution per sample for a given gene in each cell type is computed. It is then averaging across samples within a condition to estimate a condition-specific distribution. Finally, the magnitude of the difference between conditions is computed. It approximates the null distribution of differences based on permutations of cells across samples. | Differential distribution test | distinct: a method for differential analyses via hierarchical permutation tests | Tiberi S, et al. distinct: a novel approach to differential distribution analyses. bioRxiv 2022 |
| IDEAS | Estimates the distribution of each gene’s expression for each cell type in each sample, computes pairwise distances between the estimated distribution per sample, and uses distance-based tests or kernel regression to test for differences in distributions between conditions. | Differential distribution test | Individual level Differential Expression Analysis for Single cells | Zhang M, et al. IDEAS: individual level differential expression analysis for single-cell RNA-seq data. Genome Biol 2022 |
| BSDE | Estimates the distribution of each gene’s expression for each cell type in each sample, and estimates an aggregated distribution for each condition using optimal transport methods. The distance between the aggregated distributions per condition is computed, and the null distribution of this distance is estimated by permuting the condition labels. | Differential distribution test | An Introduction to BSDE | Zhang, Mengqi, et al. BSDE: barycenter single-cell differential expression for case–control studies. Bioinformatics 2022 |
Additional related papers
- Squair J W, et al. Confronting false discoveries in single-cell differential expression. Nat Commun 12: 5692, 2021
- Murphy AE, et al. A balanced measure shows superior performance of pseudobulk methods over mixed models and pseudoreplication approaches in single-cell RNA-sequencing analysis. bioRxiv 2022
- GagnonJ, et al. Recommendations of Scrna-Seq Differential Gene Expression Analysis Based on Comprehensive Benchmarking. Life 12: 850, 2022.
Required skills and resources
- Ability to program in a scripting language (most commonly R or Python)
Things to watch out for
- The scientific community has not yet agreed on a single best approach to DGE between conditions. Our advice is to try several approaches and confirm that the results are congruent with your model system’s biology.
- Some methods described above (specifically some of them based on mixed-effects models) may be computationally intensive for large datasets.