Note: 10x Genomics does not provide support for community-developed tools and makes no guarantees regarding their function or performance. Please contact tool developers with any questions. If you have feedback about Analysis Guides, please email analysis-guides@10xgenomics.com.
The Epi Multiome ATAC + Gene Expression assay from 10x Genomics simultaneously profiles chromatin accessibility and gene expression (GEX) in the same cells, clarifying the relationship between epigenetic regulation and transcription at single cell resolution. For example, compared to single cell GEX or ATAC datasets alone, this assay may enable better separation of major cell types (Kim et al. 2025), direct correlation of regulatory networks (Yan et al. 2024), and improved cell fate velocity prediction (Li et al. 2023).
Following sample preparation, sequencing, and running the Cell Ranger ARC software pipeline, you are now ready to dive deeper into your Epi Multiome ATAC + Gene Expression analysis. Key questions include:
- How to perform data quality control?
- What are common downstream analysis methods?
- How to integrate data for experimental comparison?
This guide summarizes a few available approaches and provides links to resources that may be helpful for progressing from Cell Ranger ARC outputs to downstream data exploration and interpretation. This list is by no means exhaustive, but is meant to be a starting point on your analysis journey. Since Multiome data analysis is a rapidly-evolving field, new approaches continue to be developed.
In addition to the methods highlighted in this article, readers are encouraged to visit the 10x Genomics publications website and browse relevant papers published with Epi Multiome ATAC + Gene Expression data to gain inspiration from published methods that are relevant to your own research. Pay particular attention to key figures and think about how to replicate those analysis approaches to explore your own data.
This article outlines a general workflow for analysis of 10x Multiome data, spanning quality assessment, clustering, and data integration. It then provides a list of links and resources, including R and Python community-developed software tools and tutorials.
The Epi Multiome ATAC + Gene Expression product contains two library types and sequencing data outputs that are derived from the same cells. The single cell GEX data are 3’ RNA sequencing reads, allowing researchers to profile and quantify transcript counts in the cells from a sample, while the single cell ATAC (Assay for Transposase-Accessible Chromatin) data allow for chromatin accessibility profiling. Understanding these two data types, and how they are processed together during data analysis, is important for understanding technical variation and other details of your downstream data analysis.
There are abundant resources for understanding single cell RNA-seq analysis, including these Analysis Guides:
- Best Practices for analysis of 10x Genomics Single Cell RNA-seq Data
- Introduction to 10x Genomics Single Cell Data Analysis: Continuing Your Journey after Running Cell Ranger
Unlike single cell RNA-seq data transcriptional profiling data that are measured by directly counting UMIs of the mRNA transcripts in the cell, ATAC data are collected by sequencing short fragments of accessible genomic DNA that were cut by transposase enzymes. The presence of these fragments allows researchers to infer the accessibility of the genomic DNA location and then later connect that information with the transcriptional profile.
For a comprehensive overview of methodologies, computational approaches, and challenges of analyzing single cell ATAC data, including Multiome, see Wang et al. (2025).
ATAC peaks, fragments, and cut sites
The terms fragment and cut site are commonly confused. The distinction between them is important to keep in mind when reviewing the QC metrics. As shown in the figure below, each end of a fragment identifies a transposase cut site. A cut site indicates a position on the genome that is accessible, as the transposase enzyme was able to bind there. The fragment is the full sequence between the cut sites and may be either nucleosome free, or wrapped around one or more nucleosomes.
Peak calling in ATAC data is based on cut sites, not fragments. During the peak calling process, fragments from all cells in the dataset are combined to identify the overall regions of open chromatin. For more details on the peak calling algorithm, see the Cell Ranger ATAC algorithms page.
Careful quality control (QC) evaluation of the files output from Cell Ranger ARC is the foundation of any single cell analysis to ensure that the data represent true biological variation, rather than technical noise that may be observed when there are abundant dead or low-quality cells. After running Cell Ranger ARC, carefully review the output files.
Output files
The web_summary.html file, which contains important summary metrics, serves as the primary starting point for reviewing Cell Ranger ARC outputs. For more information on how to interpret the individual metrics within the web summary, see this Technical Note "Interpreting Cell Ranger ARC Web Summary Files for Single Cell Multiome ATAC + Gene Expression Assay".
For hands-on experience with Multiome QC analysis, see our companion tutorial, Quality Control and Filtering of 10x Genomics Epi Multiome Data.
The peak-barcode matrix files, found in the filtered_peak_bc_matrix directory, contain counts of cut sites within each peak region for each barcode. Each row is a feature with a peak within a range of coordinates. The peaks.bed files contain the output of the peak-calling algorithm, where each peak represents an interval on the genome that has a local enrichment of transposase cut-sites.
$ head filtered_peak_bc_matrix/peaks.bed
chr1 237588 237917
chr1 564444 565537
chr1 567478 568248
chr1 569021 569641
chr1 713461 715293
chr1 752379 753032
chr1 762073 763379
chr1 773651 774064
chr1 779547 780286
chr1 793345 794375
For more information on the algorithms underlying these matrices, see this page.
The per_barcode_metrics.csv file has metrics information about every observed barcode:
$ cd /home/jdoe/runs/sample345/outs
$ head -4 per_barcode_metrics.csv
barcode,gex_barcode,atac_barcode,is_cell,excluded_reason,gex_raw_reads,gex_mapped_reads,gex_conf_intergenic_reads,gex_conf_exonic_reads,gex_conf_intronic_reads,gex_conf_exonic_unique_reads,gex_conf_exonic_antisense_reads,gex_conf_exonic_dup_reads,gex_exonic_umis,gex_conf_intronic_unique_reads,gex_conf_intronic_antisense_reads,gex_conf_intronic_dup_reads,gex_intronic_umis,gex_conf_txomic_unique_reads,gex_umis_count,gex_genes_count,atac_raw_reads,atac_unmapped_reads,atac_lowmapq,atac_dup_reads,atac_chimeric_reads,atac_mitochondrial_reads,atac_fragments,atac_TSS_fragments,atac_peak_region_fragments,atac_peak_region_cutsites
AAACAGCCAAACAACA-1,AAACAGCCAAACAACA-1,ACAGCGGGTGTGTTAC-1,0,0,11,10,1,7,2,6,1,4,2,0,2,0,0,6,2,2,9,0,2,1,0,0,6,4,6,12
AAACAGCCAAACATAG-1,AAACAGCCAAACATAG-1,ACAGCGGGTTGTTCTT-1,0,2,7,7,0,6,1,6,0,5,1,0,1,0,0,6,1,1,3,0,2,0,0,0,1,0,0,0
AAACAGCCAAATATCC-1,AAACAGCCAAATATCC-1,ACAGCGGGTTGTGACT-1,1,0,58263,56138,2528,33577,17962,31480,1827,27942,3431,11276,6479,9899,1316,30809,4747,2272,16029,141,1332,6440,157,22,7937,4822,7074,13986
QC analysis
For 10x Multiome QC analysis, best practices typically include checking:
- Fragment counts (ATAC)
- Peak targeting (ATAC)
- Transcription start site (TSS) targeting (ATAC)
- TSS enrichment (see article on Understanding the TSS enrichment score)
- Nucleosome signal
- UMI counts (GEX) counts per cell
Each of these metrics is discussed in detail in our Epi Multiome QC and Filtering analysis tutorial, which demonstrates how they can be used to identify and filter out low-quality barcodes.
Multiplet detection
In some cases, cell multiplet (or doublet) artifacts are found in Multiome data, where two or more cells are captured in the same droplet and sequenced together. These may be recovered as a single droplet in the final dataset. This could be a mixture of two different cell types or the same cell type. Cell Ranger ARC identifies and removes gel bead multiplets, where there are two or more barcodes associated with a single cell. However, cell multiplets are not identified by Cell Ranger ARC. In this case, there are third-party computational methods, such as scDblFinder (tutorial) and AMULET, for identifying and removing cell multiplets.
The QC considerations for single cell RNA-seq data can also be applicable to Epi Multiome data. Be mindful of applying arbitrary thresholds for counts that might be present in some tutorials, as these are usually suggestions or starting points for further investigations. Adjust these thresholds based on your specific dataset. See the Analysis Guide, Common Considerations for Quality Control Filters for Single Cell RNAseq Data. See also the Joint RNA and ATAC analysis: 10x multiomic QC tutorial, written by the authors of the Signac package in R.
Loupe Browser (10x Genomics) offers a graphical interface for visualization and exploration of Cell Ranger ARC results. This software can be used to view UMAP plots, clustering of cell types, and feature plots of gene expression or open chromatin regions. For more information, see the following pages:
- Loupe Browser Multiome ATAC + Gene Expression tutorial
- Navigating Multiome ATAC + Gene Expression data
- Exploring Feature Linkages with Loupe Browser
- Multiome Data Concepts
Integrative Genomics Viewer (IGV) is a common visualization tool that can be used with the peak file, BAM, .bai, and the cut site bigwig output files from Cell Ranger ARC. Use these files to examine where the fragments and their coverage align in relationship to genes in the reference and to look at the chromatin accessibility around specific loci of interest. This can be used to check fragment pile-ups at specific peak locations and to assess confidence in the peak calls. For example, the following figure from the Epi Multiome QC and Filtering analysis tutorial shows a large pile-up of high-map-quality fragments, and the peaks look clean and well-defined in the coverage track.
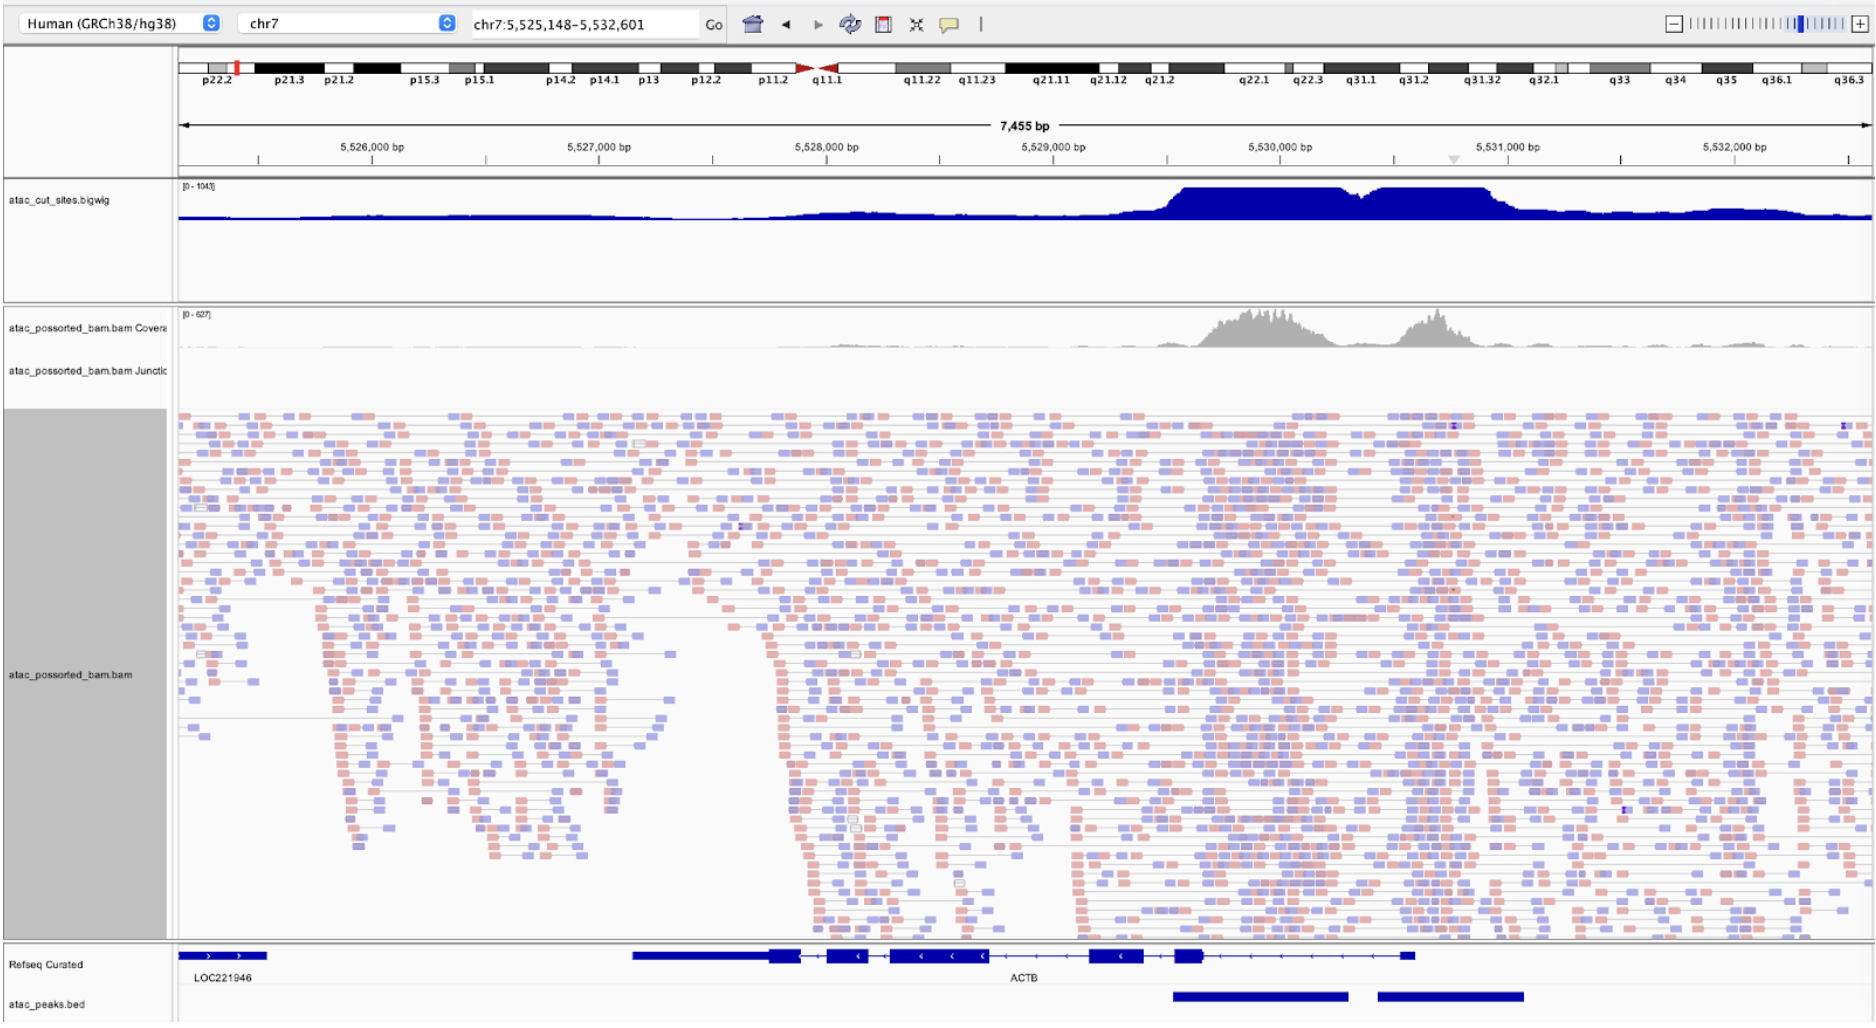
The coverage track can be a source of confusion. The coverage track from the BAM file shows read coverage. However, as we discussed before, the entirety of the fragment is not accessible, only the cut sites. The bigwig file contains a track of the smoothed cut sites and this is what is used to call peaks, not the coverage track.
To compare multiple samples (e.g., experimental treatment vs. control of the same sample type), combine them using the Cell Ranger ARC aggr pipeline. There are also methods to combine samples using third party tools.
Differential accessibility
Differential chromatin accessibility in Epi Multiome data is computed by statistically comparing peaks between samples or conditions to identify regulatory regions that are more open in one group. These differences can be directly linked to matched differential gene expression from the same cells (Teo et al. 2024). Cell Ranger ARC implements a differential accessibility analysis algorithm for ATAC data (described here). In addition, there are tutorials for third party tools available, e.g., Signac.
Batch effects
In some cases, when samples are combined, sources of variation may cause batch effects. Before attempting to apply correction algorithms to your data, check whether there are batch effects present. For more information on batch effect correction with ATAC data, see our Analysis Guide, Batch Effect Correction in Chromium Single Cell ATAC data.
The following are a few complementary tools for 10x Multiome data for the purpose of supplementing secondary analysis. This list is not exhaustive and not in any particular order.
Weighted Nearest Neighbor (WNN) Analysis, implemented in Seurat (tutorial), jointly clusters and visualizes cells by learning cell-resolved contributions from RNA and ATAC. The standard workflow involves:
- Pre-processing both RNA and ATAC data separately
- Building a weighted-nearest neighbor (WNN) graph that integrates information
- UMAP visualization and graph-based clustering
For large-scale scATAC-seq and Multiome datasets, ArchR: Large-scale Single-cell ATAC Integration (ArchR; tutorial) provides an extensive workflow for:
- Efficient QC and doublet detection
- Clustering/dimensionality reduction
- Gene score computation and integration with gene expression
Enhlink (ATAC tutorial; Multiome tutorial) is a specialized toolkit for enhancer-promoter linkage inference from scATAC-seq or multiomic data. Highlights include:
- Cluster- and covariate-aware linkage detection
- Intersection of ATAC and RNA linkages for robust, cross-modal regulatory mapping
- Handles batch/covariate imbalance, supporting complex experimental designs
SnapATAC2 (tutorial) enables MEX/AnnData formatting, rigorous QC, filtering, dimensionality reduction, clustering, and downstream gene/gene activity analyses.
Scvi-tools (ATAC tutorial; Multiome tutorial) includes probabilistic modeling for Multiome and ATAC-only data, supporting robust batch correction and annotation.
Multi-Omics Factor Analysis (MOFA+) (Argelaguet et al. 2020) is an unsupervised Bayesian factor analysis framework that generalizes PCA to multiomics datasets:
- Discovers (latent) factors of shared and modality-specific variation
- Can infer hidden structure across modalities, impute missing values, and support scalable analysis of large, non-Gaussian datasets
- Naturally accommodates both group/batch and multi-modal designs
For further inspiration, see the following journal articles and Application Note.
- Luo et al. (2024): Benchmarking computational methods for single-cell chromatin data analysis
- Cusanovich et al. (2018): A Single-Cell Atlas of In Vivo Mammalian Chromatin Accessibility
- Yan et al. (2020): From reads to insight: a hitchhiker’s guide to ATAC-seq data analysis
- Wang et al. (2025): Computational Analyses and Challenges of Single-cell ATAC-seq
- 10x Genomics Application Note: Single cell and spatial multiomics identifies Alzheimer’s disease markers