Layer by layer: Mapping the prefrontal cortex with whole transcriptome spatial gene expression

Guest Author: Liz Lucero
Scientists from the Lieber Institute for Brain Development explore the relationships between cellular function, phenotype, and location in the prefrontal cortex using spatial gene expression technology. Watch the on-demand webinar recording.
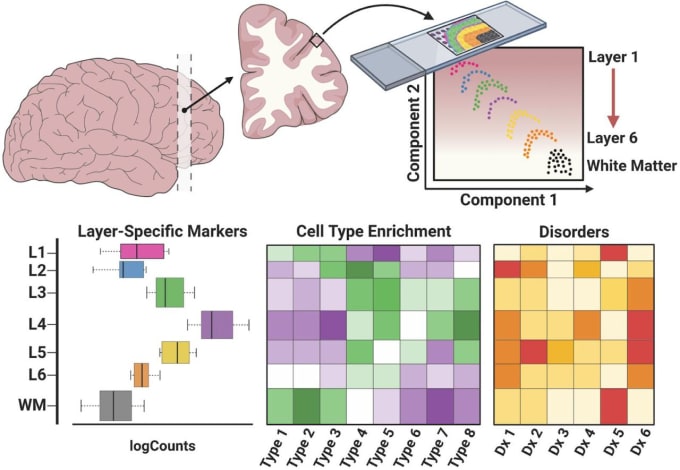
In a recent webinar hosted byThe Scientist, Kristen Maynard, PhD, and Leonard Collado-Torres, PhD, research scientists at the Lieber Institute for Brain Development discussed findings from their pre-print, “Transcriptome-scale spatial gene expression in the human dorsolateral prefrontal cortex.” Leveraging spatial gene expression technology, the research team analyzed 12 tissue samples from the six-layered human dorsolateral prefrontal cortex, and explored how the laminar position of a brain cell impacts its gene expression, morphology, physiology, and function.
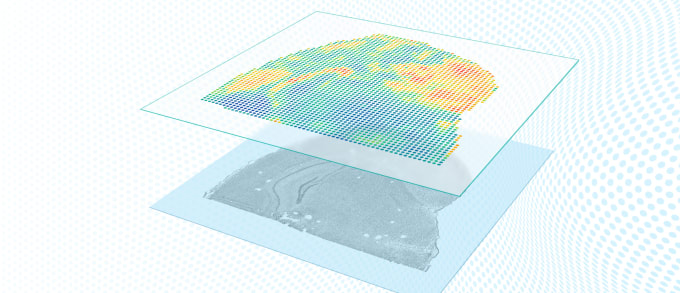
Maynard and Collado-Torres were joined by 10x Genomics Senior Product Marketing Manager, Spatial Solutions, Courtney Anderson, PhD, who provided an overview of the Visium Spatial Gene Expression Solution, running through the workflow and explaining how spatially resolved, whole transcriptome analysis enables interrogation of complex, heterogeneous tissues while maintaining morphological context.
You can watch the full on-demand webinar now, or keep reading to see some highlights from the Q&A following the presentation. Find out what Anderson, Maynard, and Collado-Torres had to say about some key areas of spatial gene expression study.
Sample quality and Visium specifications
In a spatial gene expression experiment, what is the recommended RNA quality of samples?
The RNA integrity number (RIN) of a sample is an important factor to take into account when preparing your experiment. A higher RIN indicates a better quality sample, making it more likely that your resulting data will be better quality as well. Lower RIN scores can mean that the sample has degraded, and may not be of sufficient quality to move forward with the experiment. Maynard explained that her team prioritized samples with higher RINs, ensuring that they had a RIN of at least 7. Anderson added that the recommended RIN for samples being run on the Visium Spatial Gene Expression Solution is 7 or greater. Samples tested in-house at 10x Genomics have yielded best quality results when at or above this threshold.
How many genes can be detected per cluster, on average?
Anderson said that, while highly dependent on the biology of the tissue, the Visium Spatial Gene Expression Solution can detect, on average, 12,000 genes per spot and up to 22,000 genes per capture area.
Analyzing spatial gene expression data from layered brain tissue
How were the laminar positions of cells determined after sequencing? How was resolution maintained between the different layers of brain tissue?
In their experiment, Maynard and Collado-Torres spatially mapped cells to their laminar positions within human brain tissue. Maynard described the process of annotating the layers, explaining that they used several methods. For example, they first visualized gene expression within histological context using known information about layer densities, spacing, and genes, such as PTP4.
For layer-enriched genes, are the gene expression signals coming from cells located in that layer or cells from a different layer?
This question was tricky for Maynard and Collado-Torres as it could be interpreted in different ways. Collado-Torres explained that a single spot could contain more than one cell because of the density of certain layers, but that they were confident in their results. Maynard added, however, that the question could also be referring to whether they were picking up transcripts in one layer that may be from axons or dendrites passing through from another layer. She admitted that they don’t know the answer but that it is a possibility. To refine their results, Collado-Torres suggested that they could possibly add in extra transition, or boundary, layers between each of the existing layers.
Does spatial gene expression provide sufficient resolution to segregate data into signals coming from cell bodies or nuclei versus neuropils—spots lacking any cell bodies—or synapses?
Collado-Torres explained how his team’s experimental design would allow for the identification of neuropils. Using the pairs of adjacent spatial replicates, you could inspect the images to ensure that a cell body identified in one slice did not correspond to a cell in the replicate slice, allowing you to differentiate true neuropil spots.
To learn more about this experiment and the Visium Spatial Gene Expression Solution, watch the full, on-demand webinar recording →