Answering Your Questions About the Visium Spatial Gene Expression Solution

10x Genomics is helping make it possible to explore the spatial dynamics of complex tissue biology and understand the impact of the cellular microenvironment on normal development and disease pathology. With the Visium Spatial Gene Expression Solution, researchers can profile total mRNA from intact tissue sections without the need for target pre-selection, then overlay that gene expression information onto a high-resolution image of the H&E stained tissue.
This solution utilizes traditional pathology methods, including tissue sectioning, slide preparation, H&E staining, microscopy and imaging, while also incorporating next generation sequencing. As such, the Visium Spatial Gene Expression Solution may have some features that are new to our customers, whether they’re experts in scRNA-seq experiments or tissue analysis. To help make adoption of the Visium Solution as efficient as possible, scientists at 10x Genomics have developed two training webinars:
Getting Started with the Visium Spatial Gene Expression Solution. Watch on-demand →
Exploring New Frontiers - Analyzing and Visualizing Visium Gene Expression Data. Watch on-demand →
These webinars address key experimental considerations, ranging from best practices for sectioning tissue, to spatial gene expression data analysis using Space Ranger and Loupe Browser. Below, we’ve collected some answers to common questions about the Visium Spatial Gene Expression Solution, based on the Q&A with members of our R&D and Software Teams following each webinar:
Questions about Tissue Preparation
Can different tissue types be run on a single Visium Spatial Gene Expression slide?
Yes, different tissue types can be tested on the Visium Spatial Gene Expression slide. Each slide contains four capture areas, so tissue sections from up to four different tissue types can be tested on a single slide. Optimal permeabilization times for each tissue will need to be pre-determined by performing the Tissue Optimization (TO) experiment, using one TO slide per tissue type.
Are formalin-fixed paraffin-embedded (FFPE) tissues compatible with Visium?
Only fresh frozen tissues embedded in OCT have been validated with the Visium Spatial Gene Expression Solution. Members of the R&D Team at 10x Genomics are actively investigating potential FFPE options for the future.
Can tissues be IHC stained?
Currently, the Visium Spatial Gene Expression workflow is optimized for H&E staining. Incorporation of IHC staining into this workflow is another potential area of active investigation for the R&D Team at 10x Genomics.
Is there a maximum tissue section thickness?
The section thickness for the Visium Spatial Gene Expression slides will depend upon the tissue type. For example, fatty tissues generally require thicker sections. Customers should try to achieve a good quality section at the minimum recommended section thickness for their tissue type. While 5–35 µm sections have been tested in-house, 10 µm is used for most tissue types.
Visit our support site for a list of optimized tissue types and their recommended section thickness.
It is also important to note that tissue thickness must be consistent between the Tissue Optimization and Spatial Gene Expression slides, as changing the tissue thickness may result in ineffective permeabilization.
For detailed information on how to properly handle and prepare tissue for cryosectioning, download our Tissue Preparation Guide →
Questions about Visium Spatial Gene Expression Slides
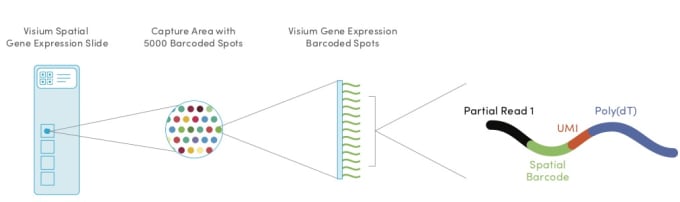
Within each of the four capture areas of the Visium Spatial Gene Expression slides, there are approximately 5000 barcoded spots, which in turn contain millions of spatially barcoded capture oligonucleotides. Tissue mRNA is released upon permeabilization and binds to the barcoded oligos, enabling capture of gene expression information.
Is it possible that a spot may capture more than one cell type?
Yes, depending on what region is being studied in the tissue, the barcoded spot will likely cover more than one cell type. This is dependent upon the tissue type, the cell sizes within the tissue, and the density of those cells. Each barcoded spot is approximately 50 microns in diameter, and the distance from the center of one spot to the center of another is approximately 100 microns. The spots are staggered to minimize the distance between them.
With these physical circumstances, on average, a researcher will see anywhere between 1 and 10 cells captured per spot. Again, these may or may not be the same cell type, depending on the tissue. It can be helpful to imagine each spot as a kind of “mini-bulk” experiment, where the researcher gathers the average gene expression data across a very small subset of cells. And it’s another area of active investigation on the part of the R&D Team at 10x Genomics to potentially minimize the spot size.
What is the variability of gene expression between subsequent sections measured on the same slide and between slides?
There is no straightforward answer here, since each tissue section is unique and thus has some innate variability. However, the most effective way to maintain consistency of gene expression data between sections on the same slide or between slides is through tissue quality control. This entails skillful tissue preparation and cryosectioning.
Additionally, it is best practice to use technical replicates; in other words, two or more sections of the same representative area of the tissue. Members of the R&D Team have found that technical replicates from representative sections are quite similar. In one trial experiment, they took four consecutive tissue sections from a mouse brain and placed them on one slide. They repeated this same experiment for six weeks, taking four more consecutive sections and placing them on a new slide each week. They compared the gene expression data across the technical replicates, and noted an R-squared value of 0.99 indicating highly correlated data. In general, technical replicates can give higher confidence in the experimental results.
Are the Visium Spatial Tissue Optimization or Gene Expression slides re-usable if not all sections are used?
Slides are one-time use only, whether or not all of the capture areas are used during processing. This is because the workflow incorporates steps, including staining, rinsing and re-drying the slides, that disrupt oligonucleotide barcodes on unused capture areas and decrease their overall sensitivity.
What is the purpose of the Imaging Test Slide?
The Imaging Test Slide provided in the Visium Accessory Kit has two purposes. One, to determine if the customer's imaging system is compatible with Visium. And two, to be used to set up imaging programs for the images that need to be acquired during the Visium Tissue Optimization and Gene Expression workflows.
For more details, please read the Visium Spatial Gene Expression Imaging Guidelines Technical Note →
Questions about Analyzing Spatial Gene Expression Data
Following slide imaging, cDNA library construction, and sequencing, researchers will have two inputs for the Space Ranger data analysis pipeline: FASTQ files with sequencing data and a high-resolution image of their tissue sections. The following questions address subsequent data analysis and visualization steps.
Do you need programming or bioinformatics experience to analyze the data?
Generally, a researcher will need limited bioinformatics experience to use Space Ranger. The Space Ranger pipeline runs on a linux machine; this will require the researcher know basic command line operations and how to log on and off a linux server. For the most part, however, Space Ranger is highly automated. The files and algorithms that make Space Ranger work are self contained in the software. As such, a researcher must simply feed Space Ranger their two input files following sequencing and allow the software to generate spatial gene expression data.
Loupe Browser has a completely graphical interface, and requires no programming at all. You may get to a point in your research process, however, where you want to ask a very specific question of your spatial gene expression data, or create a custom figure. This may require that you learn R or another scripting programming language.
I have sequenced data from the old Spatial Transcriptomics pipeline. Can I analyze them with Space Ranger and Loupe Browser?
You cannot. The data types are different enough that they won't be compatible. The current tools that are available for the spatial transcriptomic data are still the recommended path forward if you have that data type.
Are there any 3rd party tools for R, similar to Seurat, for analyzing spatial gene expression data?
Yes, there are! In fact, the number of third party tools to analyze spatial gene expression data is growing rapidly. Some options include Spaniel and Giotto. And Seurat is one option as well. The output matrix from the Space Ranger pipeline is the same format as the Feature Barcode matrix output from Cell Ranger. Researchers can enter this output directly into Seurat for further analysis. You can learn more about the Seurat workflow for spatial gene expression data here →
Additionally, 10x Genomics Computational Biologists created R resources to help customers perform deep analysis on their samples. These R resources enable researchers to visualize multiple genes, samples, or features—like genes, UMIs and clusters—at once. This may be particularly helpful if a researcher wants to examine samples with different characteristics or under unique experimental conditions: for example, a wild type, diseased and treated sample.
You can access these R resources on our support website →
And read this recent blog post to learn more about the software tools for the Visium Spatial Gene Expression Solution!
Whether experienced in sequencing and data analysis, or immersed in pathological tissue analysis, our customers can find many use cases for the Visium Spatial Gene Expression Solution. Users can now explore complex tissue biology like never before: discovering novel biomarkers, identifying genes expressed in disease, and developing a deeper understanding of the spatial relationship between cellular environment, cell type and organization, and gene expression.
You can explore more questions about the Visium Spatial Gene Expression Solution by watching our recorded webinars:
Getting Started with the Visium Spatial Gene Expression Solution. Watch on-demand →
Exploring New Frontiers - Analyzing and Visualizing Visium Gene Expression Data. Watch on-demand →