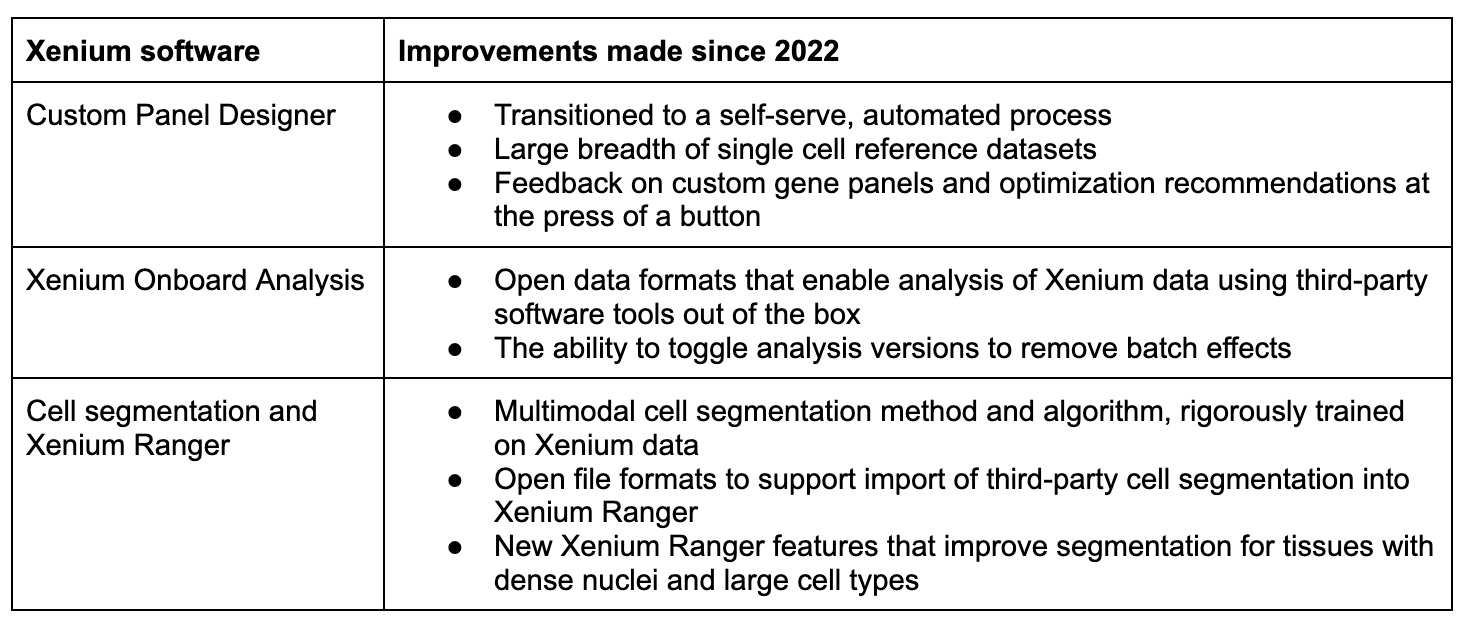
Xenium software improvements that make single cell spatial imaging faster, easier, and more powerful

As research tools and the information they provide become more advanced, software tools become even more critical to facilitate data exploration and discovery. Just like the Xenium Analyzer instrument or Xenium gene and protein panels, the Xenium software ecosystem is bringing continuous innovation to customers to enable their critical research.
Since the Xenium launch in 2022, software capabilities have made experimental design faster, user experience more intuitive, and Xenium data readouts more accurate and powerful. This blog explores those software improvements, providing a snapshot of where the Xenium platform started, where it is now, and how that benefits you.
Keep reading to explore transformative improvements to Xenium software tools related to:
- Faster, self-serve custom panel design
- Easy analysis compatibility with third-party tools
- More accurate cell segmentation with an integrated staining and algorithmic approach
Jump ahead to a summary table of these Xenium software improvements and key resources.

Discover the Xenium Analysis ecosystem
Want to take a couple steps back to get an overview of the Xenium Analysis pipelines? Find out how onboard analysis works, and try a Xenium Explorer demo to see how intuitive in situ data exploration can be.
Faster, easier custom panel design
The Xenium In Situ platform features a diverse choice of gene panels. These panels define what RNA transcripts you’d like to detect at subcellular resolution within your tissue samples. There are a number of pre-designed base panels compatible with human and mouse tissue, which can be customized with up to 100 genes, or you can develop fully custom gene panels of up to 480 genes for more species.
Customization gives you the power to answer the specific questions you are most interested in. And it’s driving significant research, as over 70% of Xenium runs leverage custom panels.
These unparalleled customization capabilities are made possible by our Xenium Panel Designer software, which acts essentially as a self-service portal to design, validate, and optimize your custom gene list.
Where we started with custom panel design capabilities
Within six months of our original Xenium launch in 2022, we had the first iteration of the Xenium Panel Designer available. Michael Siddiqui, PhD, Senior Product Manager of Software at 10x Genomics, described the process of submitting a design to this earliest version of the tool:
“We started with a form where you gave us inputs, like chemistry, panel type, and plexy. You had to have a specific file format to upload and a list of genes. This is the key thing—you waited. Then, a member of the 10x Applied Bioinformatics team would complete the design for you.”
Why all the waiting? Getting feedback on the quality of a custom gene list is a critical aspect of the custom panel design process. Single cell reference datasets from the specific tissue type and conditions of the proposed study can help identify best gene candidates. However, customers had to provide that reference themselves, which could present a task that felt time-consuming and complex due to file format requirements.
All together, this process led to a wait time of typically over a month to receive a validated custom gene panel design (not including the time it took for consumables to ship).
Improvements within a powerful self-serve model
Since 2022, we’ve made significant improvements to the Custom Panel Designer tool that have made it a self-serve platform that can deliver designs—from a gene list to consumables in your hands—in a week to 10 days.
Two critical components have made this self-serve model possible:
1. A growing bank of single cell reference datasets curated by 10x Genomics
“One of the big updates we're about to push out is going from 30 off-the-shelf single cell reference datasets to almost 60.” Alex Sockell, PhD, Staff Product Manager for Xenium consumables at 10x Genomics, commented on the expansion of curated single cell reference datasets that are available to customers designing Xenium panels.
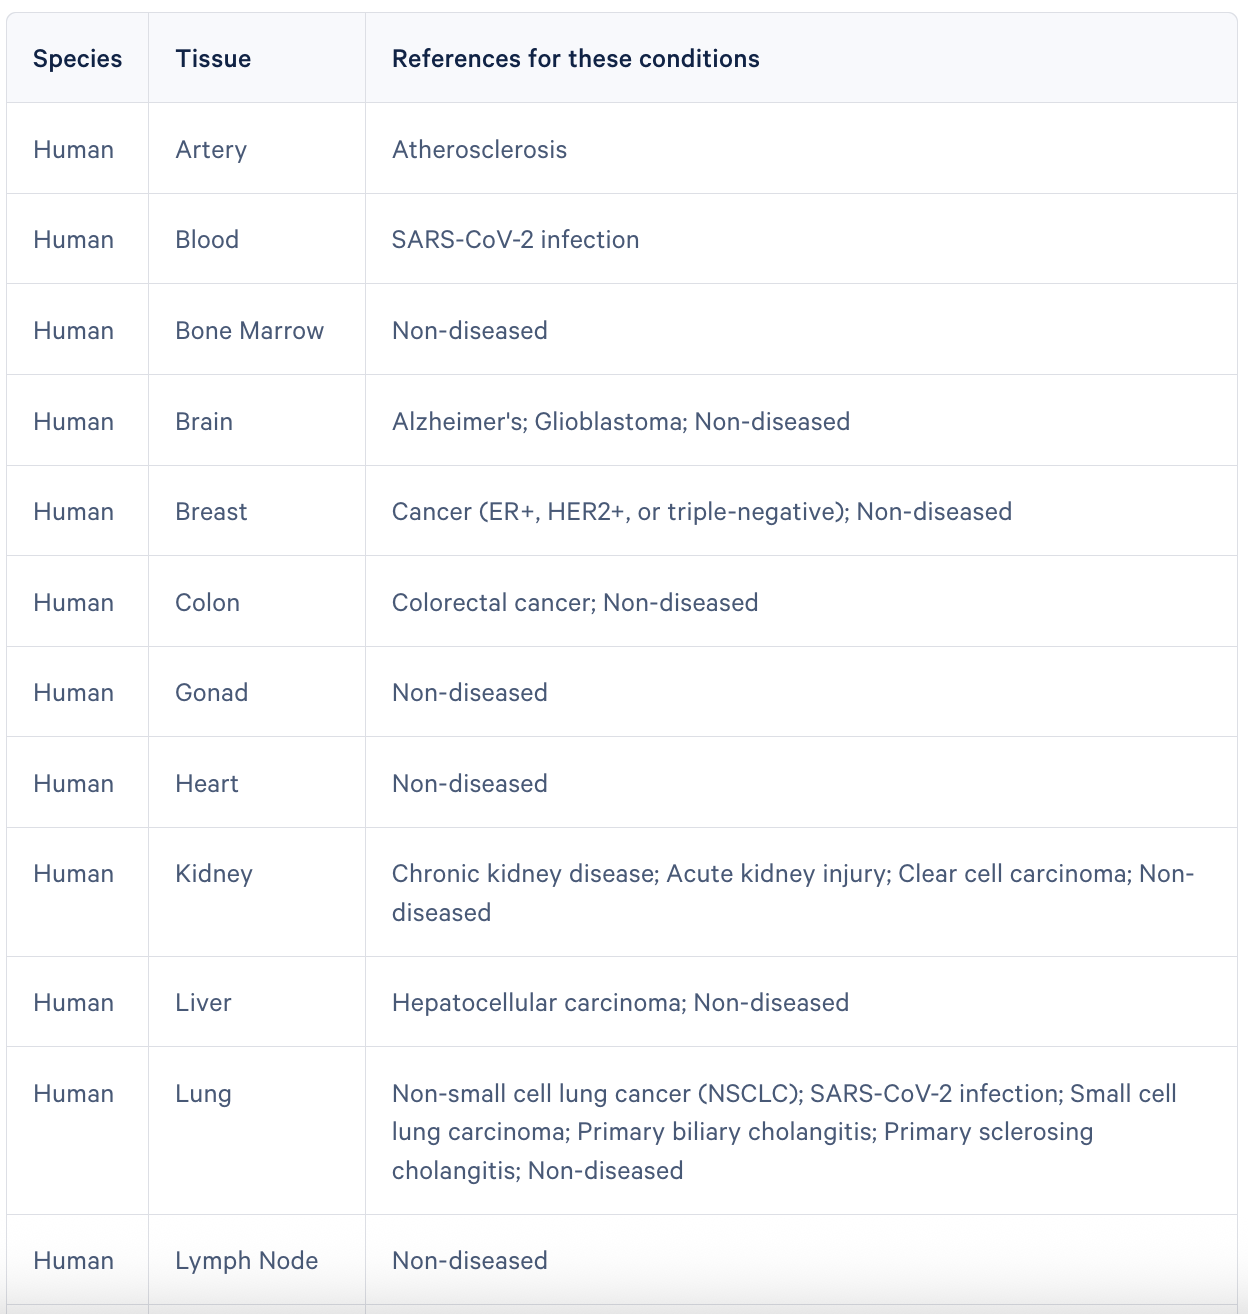
*This table does not reflect all single cell references.
“Expanding the available references enables a much wider customer base to be able to do this. It used to be that you needed to be an experienced bioinformatician to do this process, and now you don’t. You can be a biologist who only knows what tissue types you're using and what genes you care about.”
2. Algorithms within the Custom Panel Designer tool that provide immediate feedback and optimization recommendations for custom gene lists
Validation of a custom gene list once required back-and-forth email communication with a 10x computational biologist, but it’s now enabled by the click of a button in the designer portal.
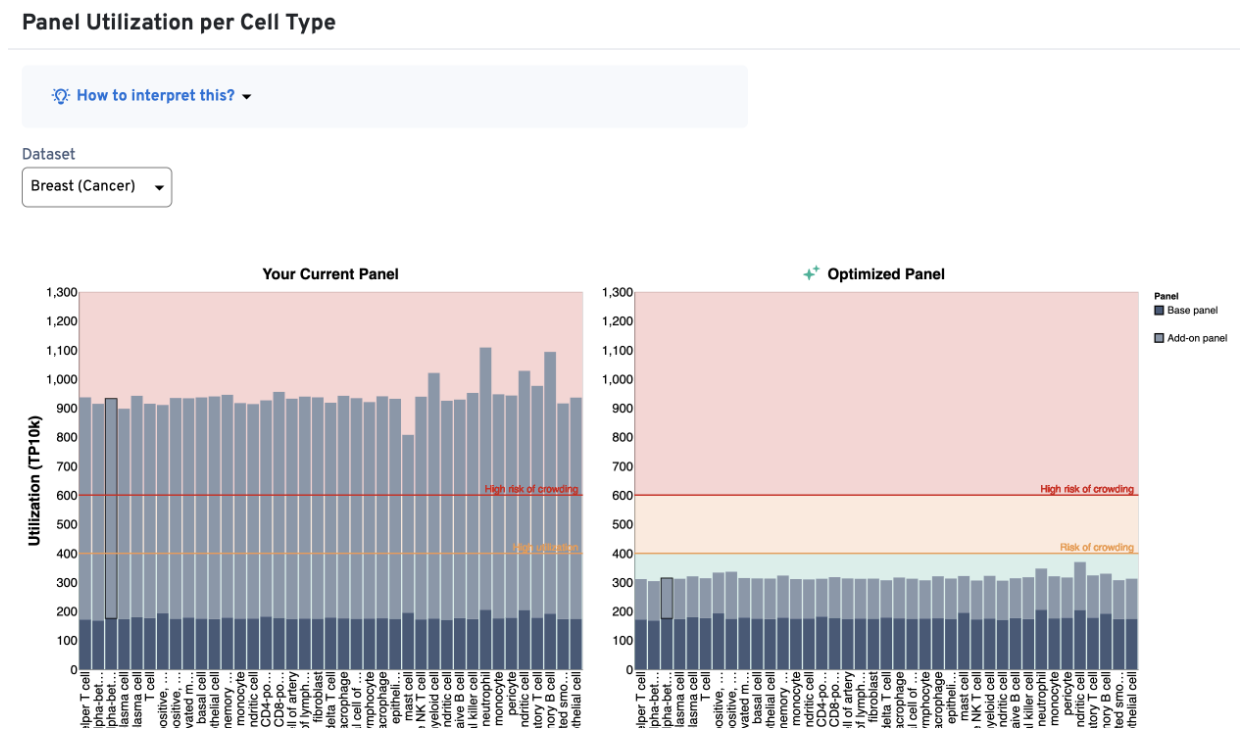
Now, users have options for design iteration that puts control back into their hands. That could mean removing a gene from the panel or reducing the number of probe sets targeting a highly expressed gene.
This automated workflow allows users to make informed decisions about how and why to move forward with a certain panel design, and it communicates those options for improvement with clearer design alerts than were available in the first version of the Custom Panel Designer tool.
Resources:
- Single cell reference datasets
- Knowledge Base article with guidance for genes that cause optical crowding
Easy file formats and third-party analysis compatibility
What do you do with a spatial data output that bridges histology and molecular biology? Software, both third-party and 10x-developed tools, ultimately unlocked the Xenium platform’s potential for transformative biological insights.
“What was novel about Xenium when it first launched was that it not only had the single cell data that single cell users are familiar with, it also had very high-resolution images for tissue context and single RNA molecule information within that tissue,” said Matt Cai, PhD, Product Manager for Spatial Bioinformatics at 10x Genomics.
Cai works with his team to develop and evolve Xenium platform software tools, including Xenium Onboard Analysis and Xenium Ranger. These tools help make sense of Xenium single cell spatial imaging data.
“There were big challenges with how to give customers data and data formats that they could easily read using existing tools,” said Cai.
The solution came down to intentional collaboration with popular third-party analysis developers to ensure file compatibility:
“Our customers regularly use community-developed, third-party software tools. We worked with method developers to ensure that their tools were compatible with Xenium, and we used open data formats so that they could see exactly what Xenium outputs would look like. Then, when our products were released, customers would be able to quickly start using these tools. It’s about helping them get started in the most frictionless way.”
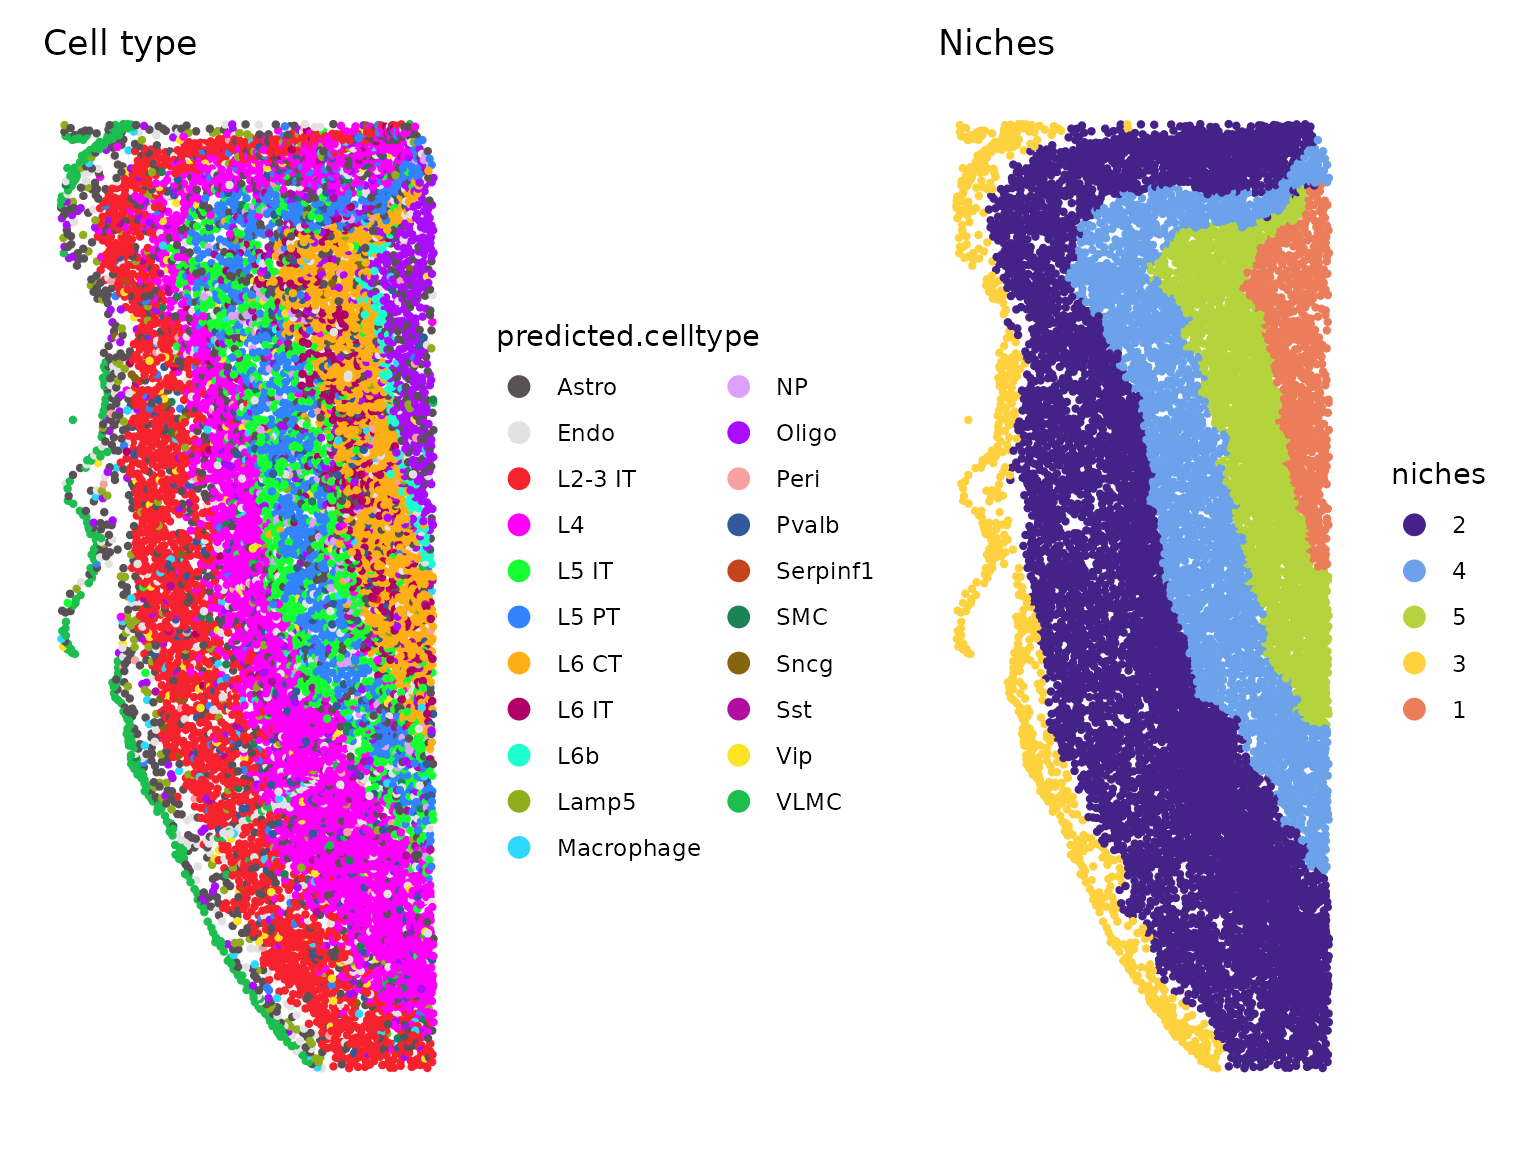
Because of these efforts, popular third-party tools are compatible with Xenium data outputs right out of the box, and enable researchers to perform powerful spatial analysis. This analysis journey typically starts with annotating the cell types in a tissue section, then can expand to include:
- Context discovery: This could entail looking for where certain tissue regions end and others begin (such as tumor cells and stroma in a cancerous tissue) and identifying the cell types enriched in each region. A researcher could ask how that cellular composition changes under different treatment conditions and at different stages of disease, or how various cell types could be an indication of the severity of the disease or treatment response.
- Nearest-neighbor analysis: This exploratory approach is less based on the morphology of the tissue, instead looking more broadly at what cell types associate and interact with each other across the whole tissue section.
The benefits of Xenium Onboard Analysis and version control
Xenium Onboard Analysis is one of the most powerful software features of the platform, allowing researchers to start exploring their data immediately after a Xenium run completes. Onboard analysis pipelines support the analysis of gene and protein expression data, as well as image processing, cell segmentation, and transcript decoding. Xenium Onboard Analysis also performs secondary analysis on the cell-feature matrix to generate principal component analysis, UMAP, graph-based and K-means clustering, and differential expression analysis results.
Periodic updates to Xenium Onboard Analysis once presented a challenge to Xenium customers, as Matt Cai, Product Manager, explained: “When we change the software versions on the instrument, this introduces batch effects. For customers doing longitudinal studies, this introduced analysis friction or difficulties because now they had to address this software version as a batch effect in their large-scale experiment.”
Now, customers can choose between Onboard Analysis versions on the instrument, solving this pain point around batch effects. Cai continued to explain how this works: “Previously, we introduced a toggle so that you can pick between analysis pipeline versions if you're doing a long-running study. With the newest version (v4.0) we've kept this toggle so that a customer can maintain the previous major version, but they can upgrade their instrument software too—get all the bug fixes and stability fixes—without introducing batch effects in their data.”
Resources:
Cell segmentation algorithms built for your Xenium data
Cell segmentation software improvements are among the most important updates to the entire Xenium platform since its original launch because this capability is what makes Xenium data “single cell.” You need accurate cell segmentation to have accurate single cell spatial data—to assign transcripts to the right cells, to do cell typing, and other spatial analysis.
Xenium v1 launched with a nuclei-expansion-based cell segmentation method. Within a year, we shipped a multimodal cell segmentation staining protocol and a new cell segmentation algorithm. Matt Cai explained the significance of this algorithm and how it differs from other cell segmentation software:
“There's a common misconception that we use an open source cell segmentation algorithm and cell segmentation representation that other in situ tools use. When you use an off-the-shelf cell segmentation model, that model could be trained on general immunofluorescence microscopy data. So it's not going to be as well fitted [to the data from the Xenium instrument] and, theoretically, the accuracy will be worse.”
“We developed our own cell segmentation representation and algorithm, and put a lot of effort into using Xenium data only to train models for nuclear segmentation, cell boundary segmentation, and interior cell staining. Our models are trained on data that's more representative of the images that our customers are actually segmenting on. We're doing something distinct from what other platforms do.”
New cell segmentation capabilities for specific cell types or niche tissues that have more complex segmentation requirements are also now available with Xenium Ranger v4.0. These apply to:
- Tissue types with dense nuclei. In some tissues, nuclei are too close together to segment using the DAPI image alone. We’ve updated our nuclear segmentation method to use the interior stain (18S rRNA marker) and the DAPI stain together. This can help clarify nuclei segmentation for tissues like retina or spleen.
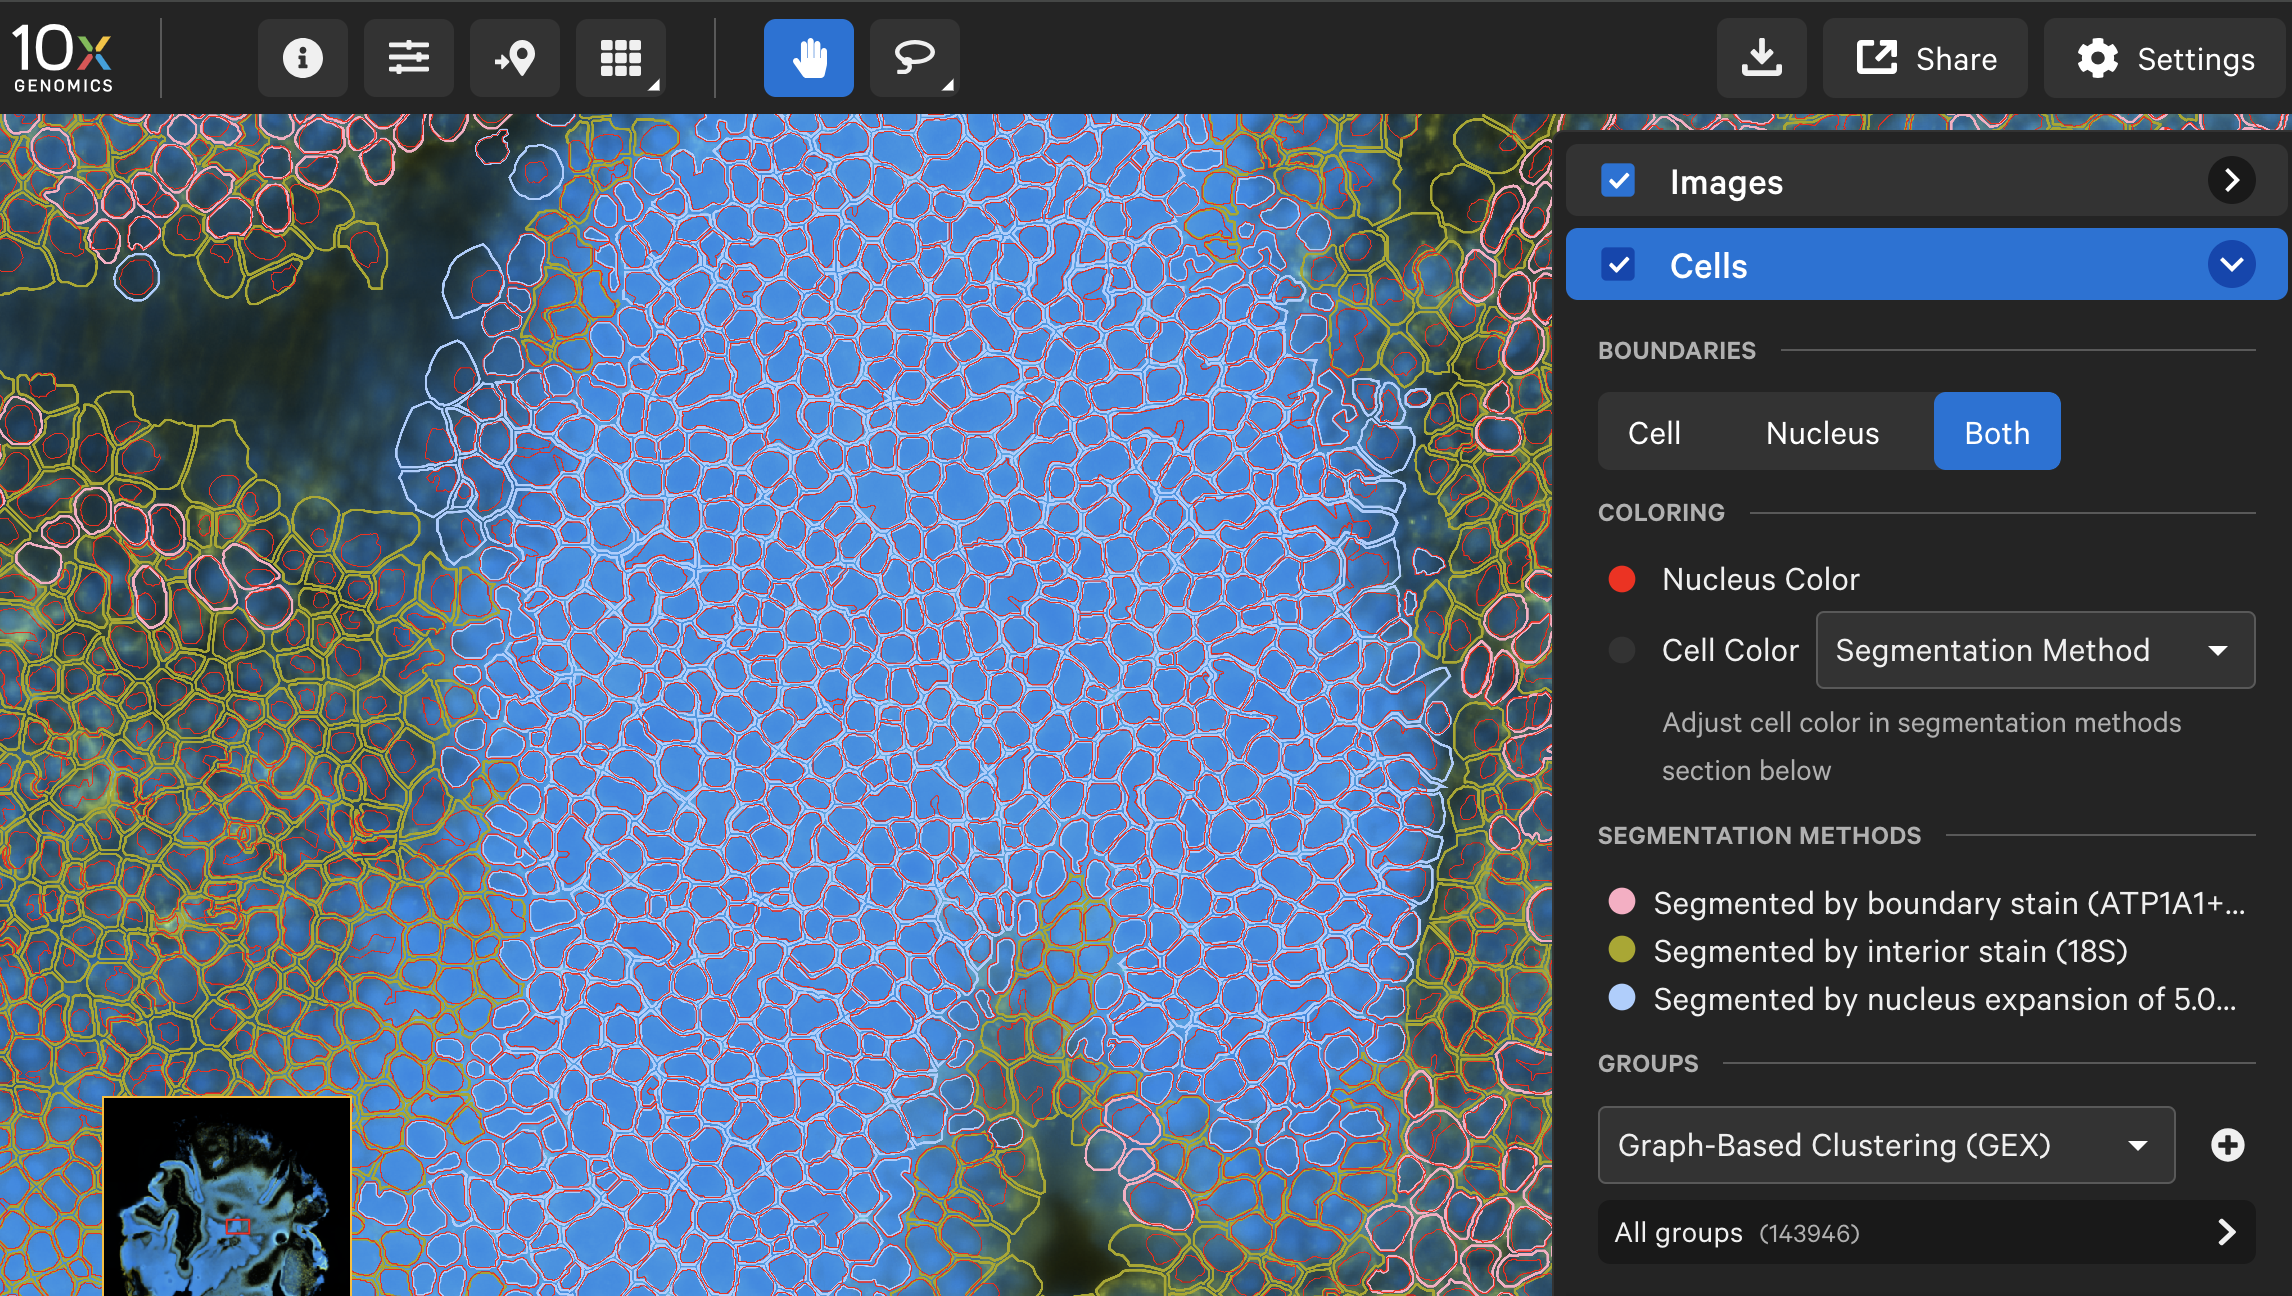
- Tissue with large cell types. The multimodal cell segmentation method didn’t always work for tissues with large cells, such as muscle, adipocytes, or neurons. Now, in Xenium Ranger, customers can choose to use a feature called large cell segmentation to segment cells that are larger than 25 μm in diameter.
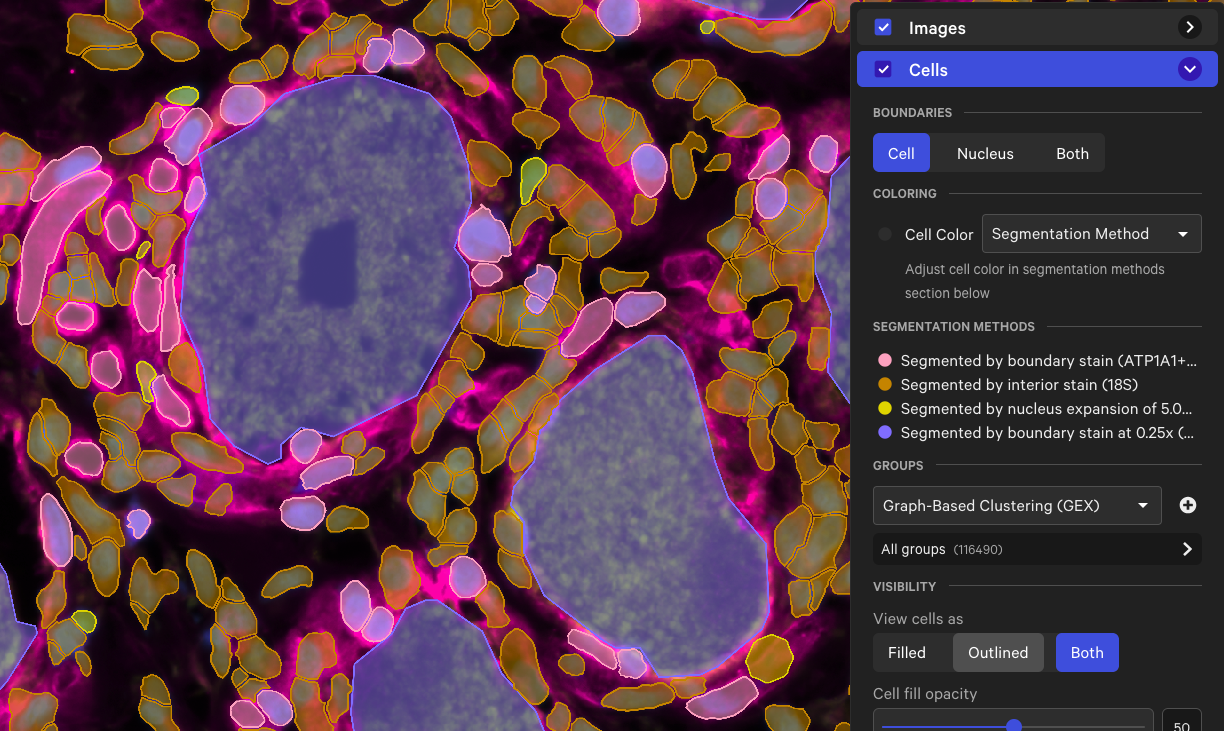
Additionally, the latest version of Xenium Ranger analysis software is fully backwards compatible. That means you can enhance your old cell segmentation by reanalyzing it on the latest version of Xenium Ranger, incorporating these improvements in nuclei and large cell segmentation.
Xenium software improvements since 2022
The improvements we’ve made to the Xenium software ecosystem since the platform’s launch in 2022 have made this tool more robust and powerful for your research. You can have confidence in a cell segmentation algorithm trained and equipped to untangle the most challenging tissues and cell types. You can guide your own analysis journey with the flexibility to easily leverage third-party software for spatial data analysis.
But more than that, we’re proud to see and hear that software improvements have made your daily lives easier. You can get started faster with custom designs and without painful overhead that once required bioinformatics experience that few researchers have. We’re committed to continuing to make Xenium single cell spatial imaging accessible and robust for all researchers, and software is a key part of that.
Key resources:
- Xenium Analysis overview
- Xenium Onboard Analysis pipeline
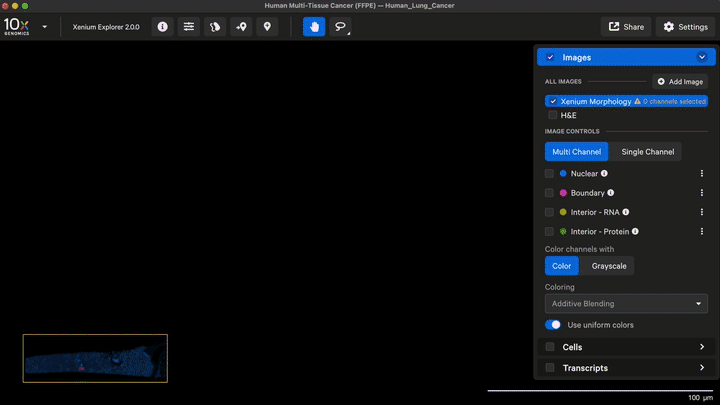
- Xenium Explorer software
- Xenium Custom Panel Designer overview

Get started with custom designs for your next Xenium experiment
If you’re excited to run your own experiment after seeing these powerful capabilities, check out our Xenium Panel Designer tool to start building a custom gene panel for your tissues of interest and research questions.
About the author:

Blog contributors: We'd like to thank the team for providing their expert insights!