To enable easier quality control for large-scale studies (i.e., Flex v2), the cellranger multi pipeline in Cell Ranger v10 and later outputs a qc_report.html so that users do not need to refer to a separate web_summary.html file for each of up to 384 samples. The metrics listed in the HTML report are also provided in CSV format (qc_library_metrics.csv and qc_sample_metrics.csv).
The qc_report.html is divided into four tabs: Gene Expression Library, Antibody Library, Samples Summary, and Experimental Design. The following sections cover each tab in detail.
The default view is the Gene Expression Library tab:
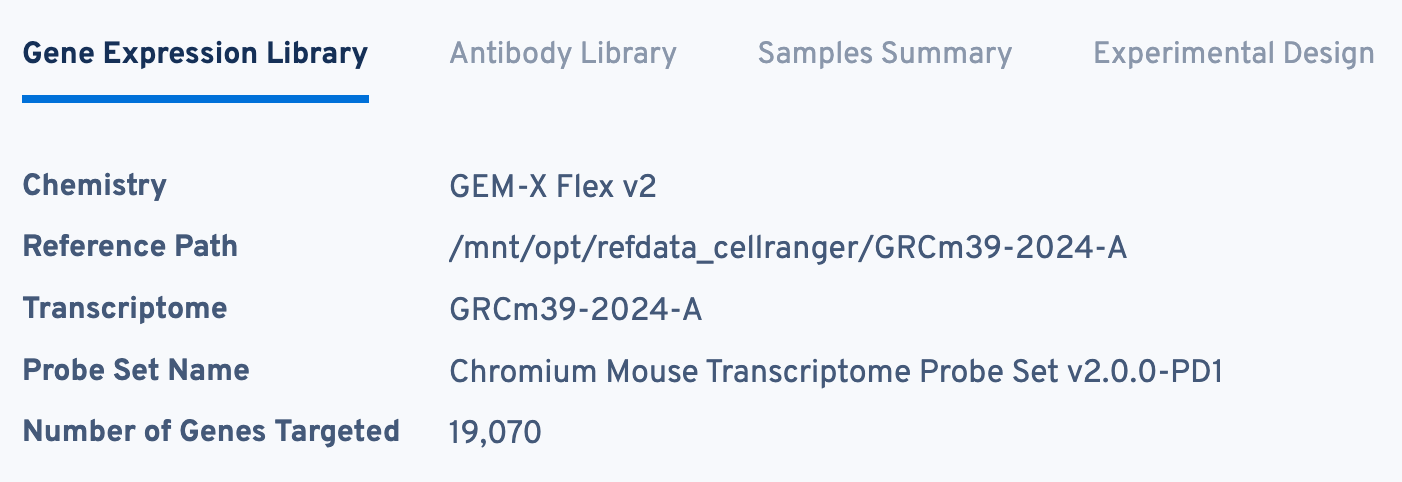
The top-level metadata can be useful to confirm the most essential parameters of your experiment:
- Chemistry: The assay chemistry used.
- Reference Path: The path to the reference.
- Transcriptome: The name of the transcriptome (usually matches the reference path).
- Probe Set Name: The name of the probe set. Flex v2 requires v2 probe sets.
- Number of Genes Targeted: The number of targeted genes based on the probe set used.
The next panel is Cell Calling Quality:
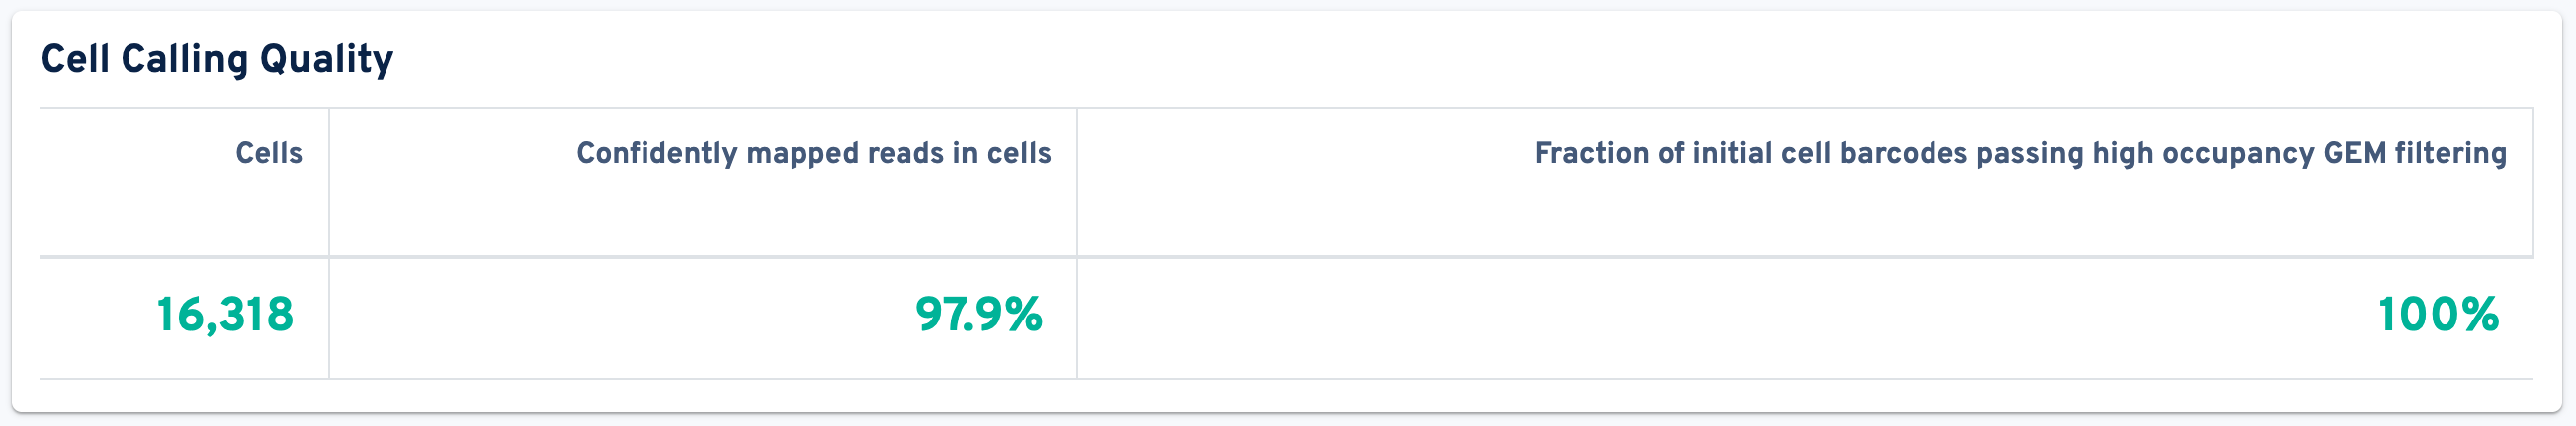
- Cells: The number of barcodes identified by the cell-calling algorithm as containing a cell. Barcodes removed by Protein Aggregate Detection and Filtering or High Occupancy GEM Filtering are not counted.
- Confidently mapped reads in cells: The fraction of valid-barcode, valid-UMI, confidently-mapped-to-the-whole-probe-set reads with cell-associated barcodes.
- Fraction of initial cell barcodes passing high occupancy GEM filtering: Fraction of cell-associated barcodes from initial cell calls that remain after high occupancy GEM filtering. Cell calling is performed and all barcodes associated with any GEMs that have significantly higher probe barcodes per GEM than we would expect from optimal chip loading are removed to mitigate higher than expected.
Further down the page is the GEX Barcode Rank Plot:
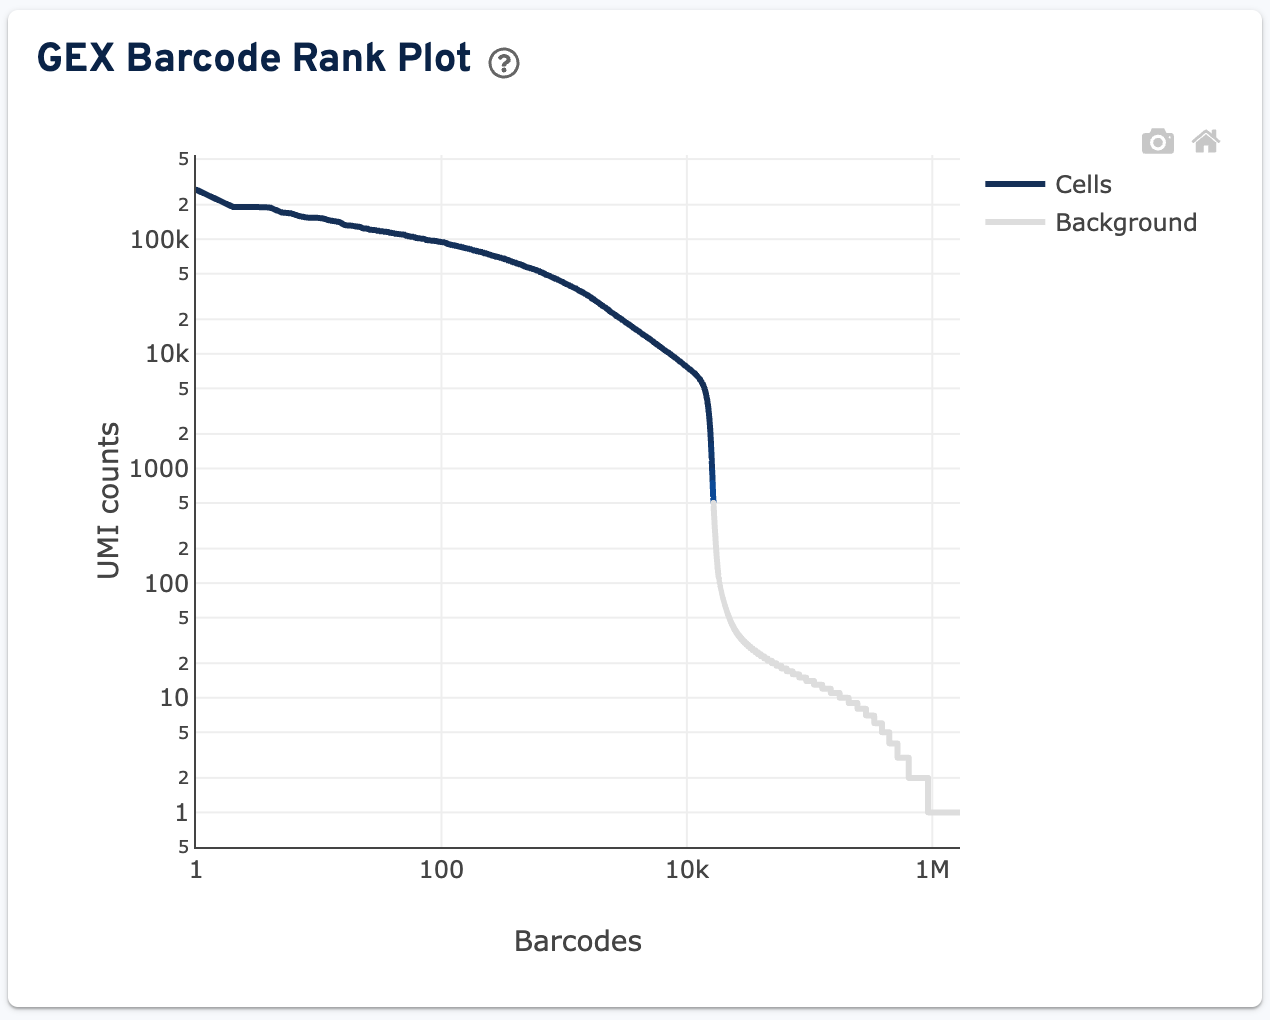
The plot shows filtered UMI counts mapped to each GEM barcode. Barcode-cell associations can be determined by UMI count or expression profile, or removed by Protein Aggregate Detection and Filtering and/or High Occupancy GEM Filtering steps. Therefore, some regions of the graph contain both cell-associated and background-associated barcodes. When present, Gene Expression data is used to identify these barcode populations. The color of the graph is based on the local density of barcodes that are cell-associated in these regions. Hovering over the plot displays the total number and percentage of barcodes in that region called as cells along with the number of UMI counts for those barcodes and barcode rank, ordered in descending order of UMI counts.
The Mapping Quality metrics are shown below the GEX Barcode Rank Plot:
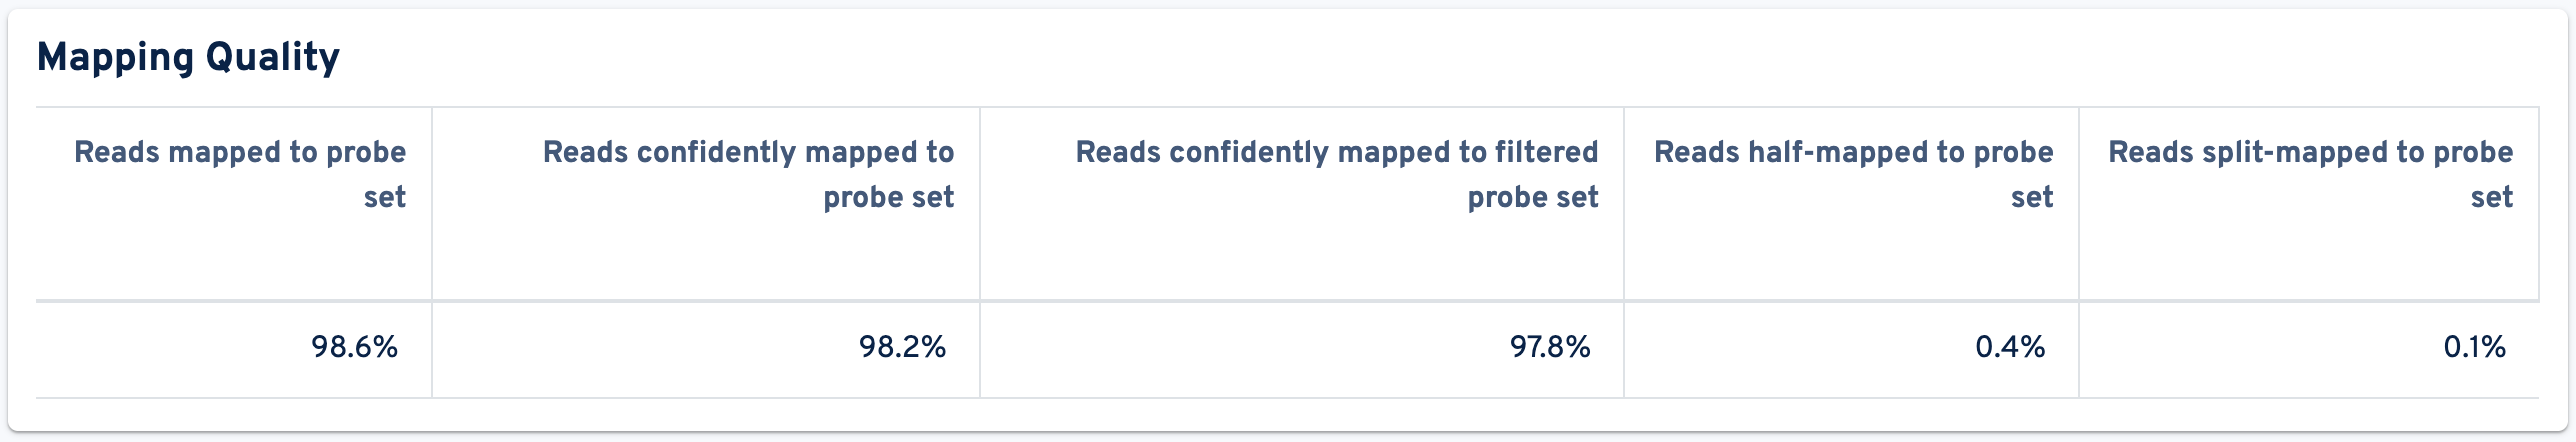
- Reads mapped to probe set: Fraction of reads that mapped to the probe set.
- Reads confidently mapped to probe set: Fraction of reads that mapped uniquely to a probe in the probe set.
- Reads confidently mapped to filtered probe set: Reads confidently mapped to filtered probe set.
- Reads half-mapped to probe set: Reads half-mapped to probe set.
- Reads split-mapped to probe set: Reads split-mapped to probe set.
The next panel shows the Library Quality metrics:
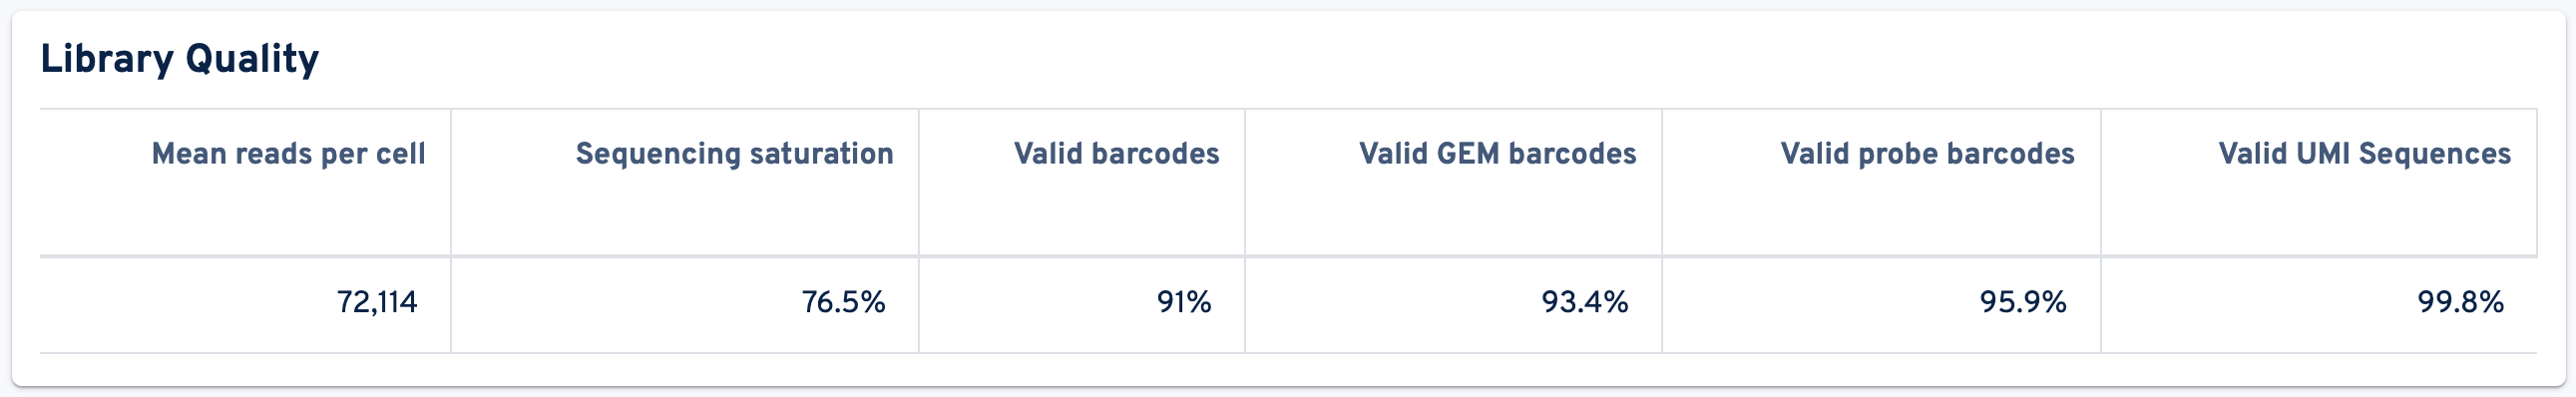
- Mean reads per cell: The total number of sequenced read pairs divided by the number of cell-associated barcodes.
- Sequencing saturation: The fraction of reads originating from an already-observed UMI. This fraction is a function of library complexity and sequencing depth. It is calculated as the ratio of reads with non-unique (cell barcode, UMI, gene) combinations to the total number of valid reads.
- Valid barcodes: Fraction of reads with barcodes that are present in the whitelist after barcode correction. The cell barcode is the combination of the GEM barcode and probe barcode and both parts must be valid following correction.
- Valid GEM barcodes: Fraction of reads with GEM barcodes that are present in the whitelist after barcode correction.
- Valid probe barcodes: Fraction of reads with probe barcodes that are present in the whitelist after barcode correction.
- Valid UMI Sequences: Fraction of reads with valid UMI sequences; i.e. UMI sequences that do not contain Ns and that are not homopolymers.
The Sequencing Run Quality panel shows metrics related to sequencing:
- Fastq ID: Unique identifier for each sequencing run.
- Number of reads: Total number of read pairs sequenced during this run.
- Q30 barcodes: Fraction of cell barcode bases with Q-score ≥ 30, excluding very low quality/no-call (Q ≤ 2) bases from the denominator. The cell barcode is the combination of the GEM barcode and probe barcode.
- Q30 GEM barcodes: Fraction of GEM barcode bases with Q-score ≥ 30, excluding very low quality/no-call (Q ≤ 2) bases from the denominator.
- Q30 probe barcodes: Fraction of probe barcode bases (or antibody multiplexing barcode bases for Flex with Antibody Feature Barcode) with Q-score ≥ 30, excluding very low quality/no-call (Q ≤ 2) bases from the denominator.
- Q30 UMI: Fraction of UMI bases with Q-score ≥ 30, excluding very low quality/no-call (Q ≤ 2) bases from the denominator.
- Q30 RNA read: Fraction of probe read bases (R2) with Q-score ≥ 30, excluding very low quality/no-call (Q ≤ 2) bases from the denominator.
The next panel shows the Metrics per probe barcode:
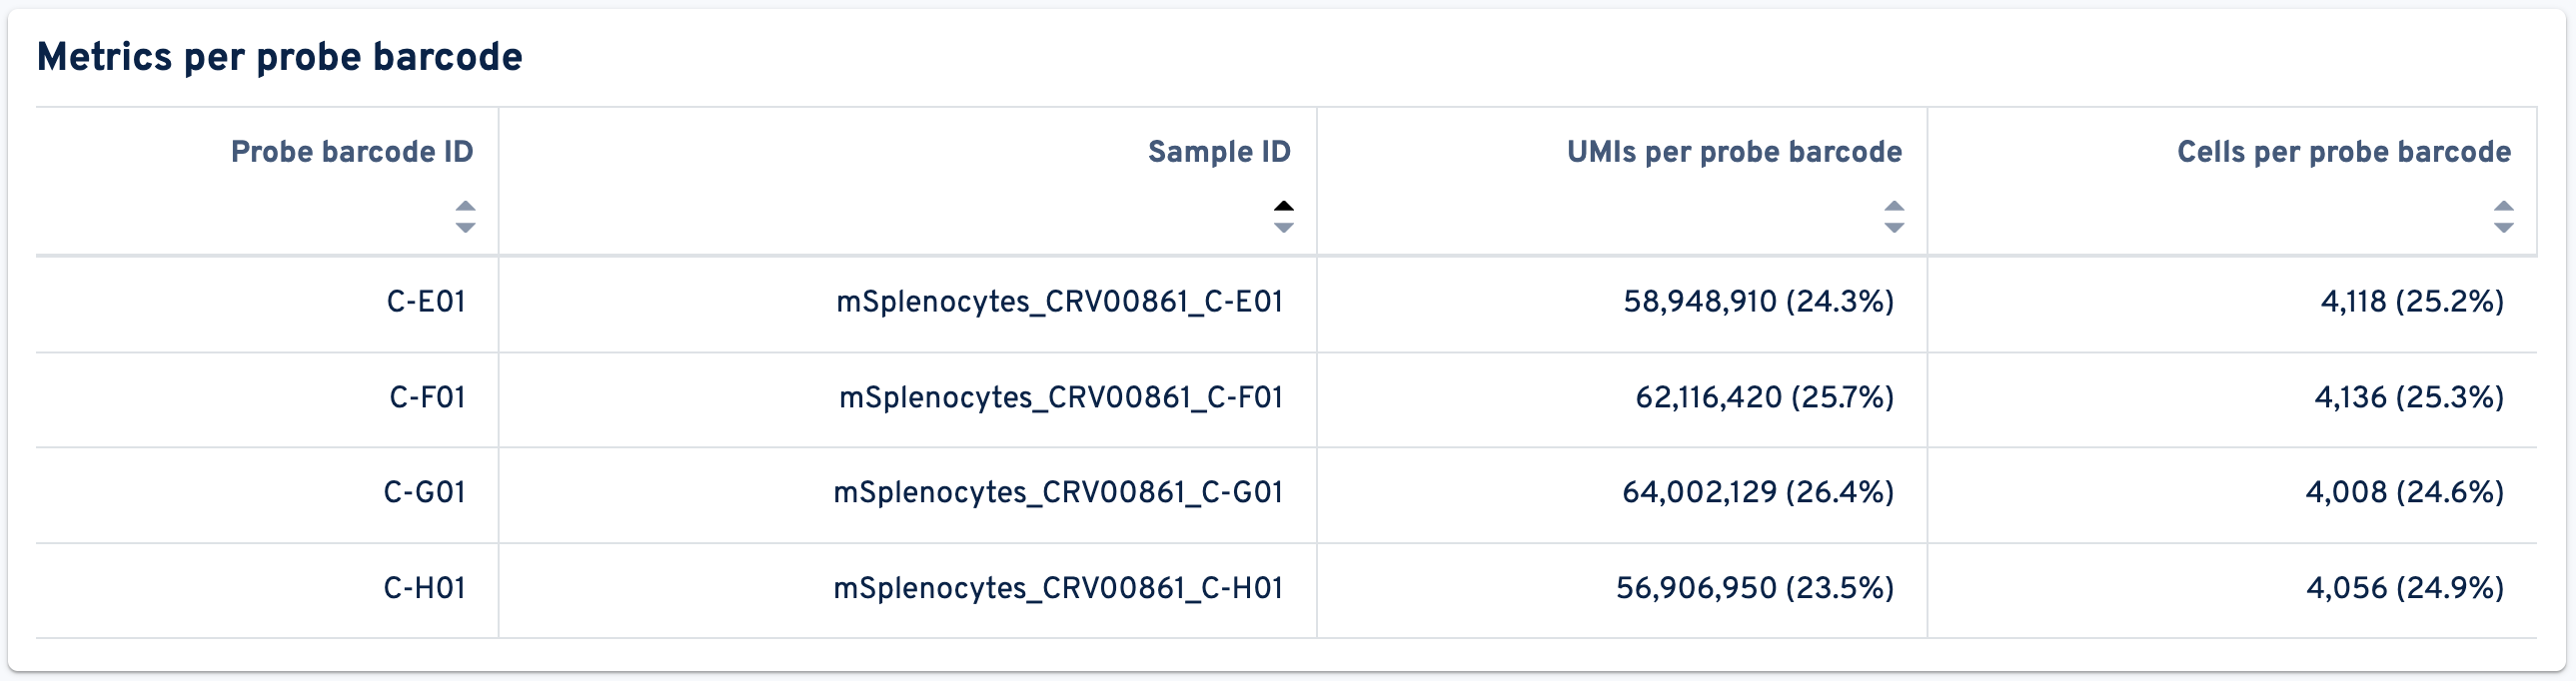
- Probe barcode ID: The identifier of this probe barcode.
- Sample ID: The identifier of the sample associated with this probe barcode.
- UMIs per probe barcode: UMIs per probe barcode.
- Cells per probe barcode: Number and fraction of cells per probe barcode amongst all cells detected in this GEM well. Cell calling is based on gene expression data when present.
The Sequencing Saturation plot can be used to evaulate whether more sequencing is beneficial, or if the gene expression library is over-sequenced:
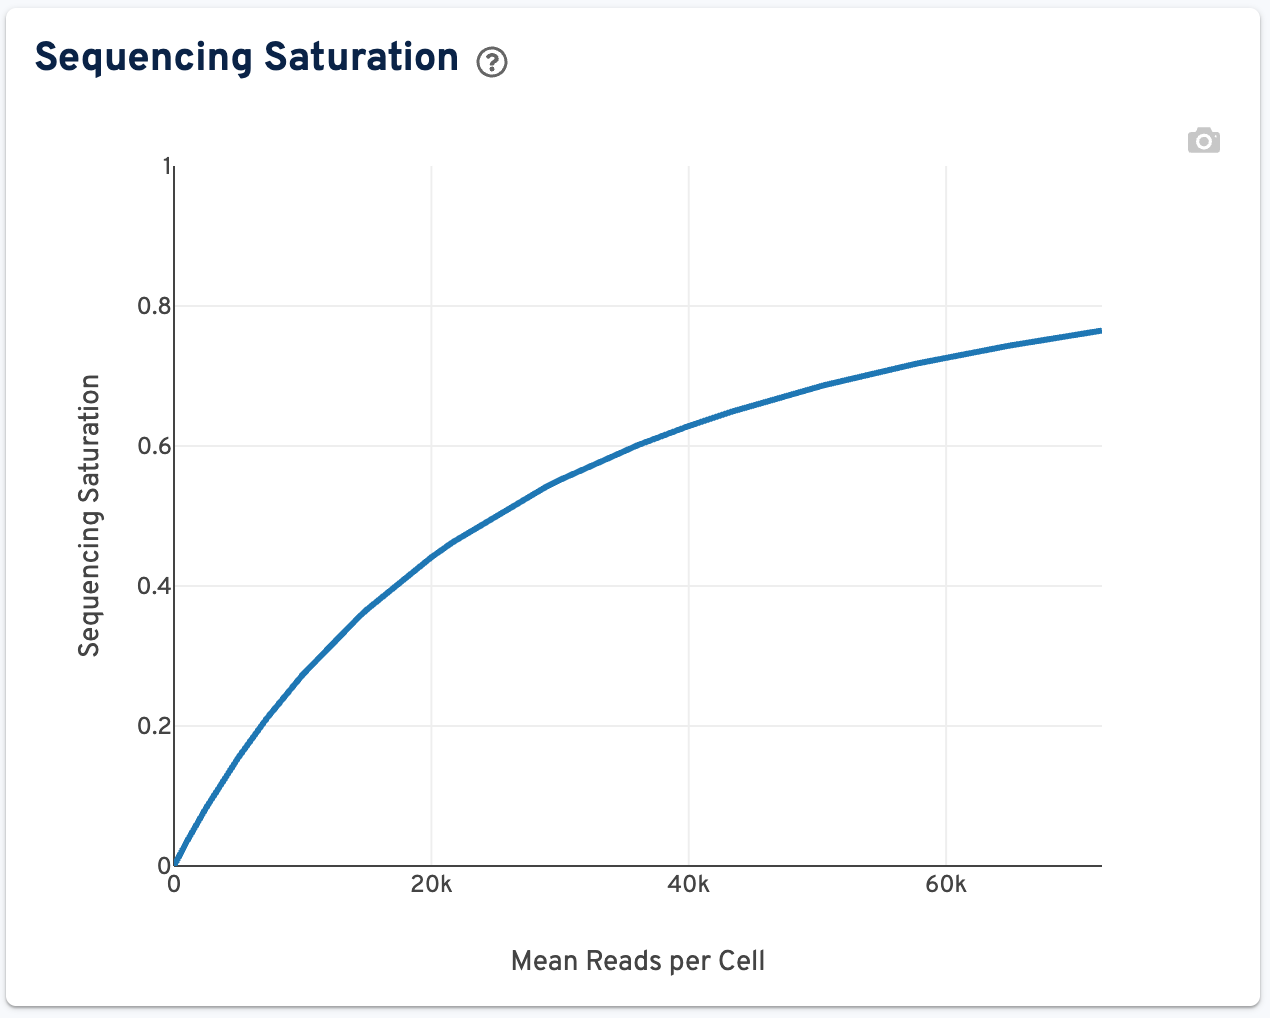
This plot shows the Sequencing Saturation metric as a function of downsampled sequencing depth (measured in mean reads per cell), up to the observed sequencing depth. Sequencing Saturation is a measure of the observed library complexity, and approaches 1.0 (100%) when all converted mRNA transcripts (or ligation products in the context of Flex libraries) have been sequenced. The slope of the curve near the endpoint can be interpreted as an upper bound to the benefit to be gained from increasing the sequencing depth beyond this point.
The Median Genes per Cell plot is shown to the right:
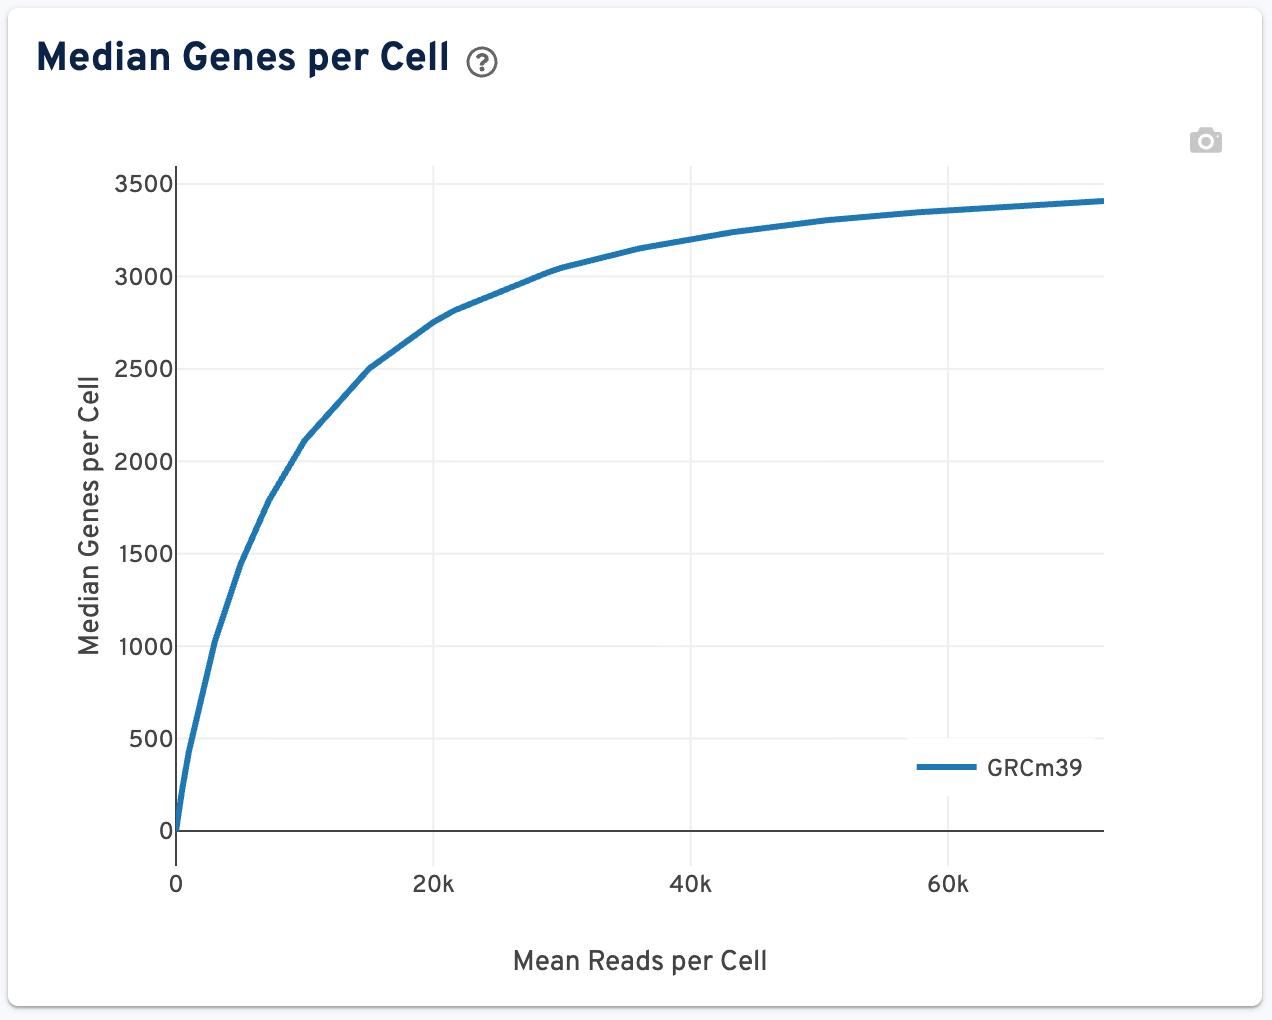
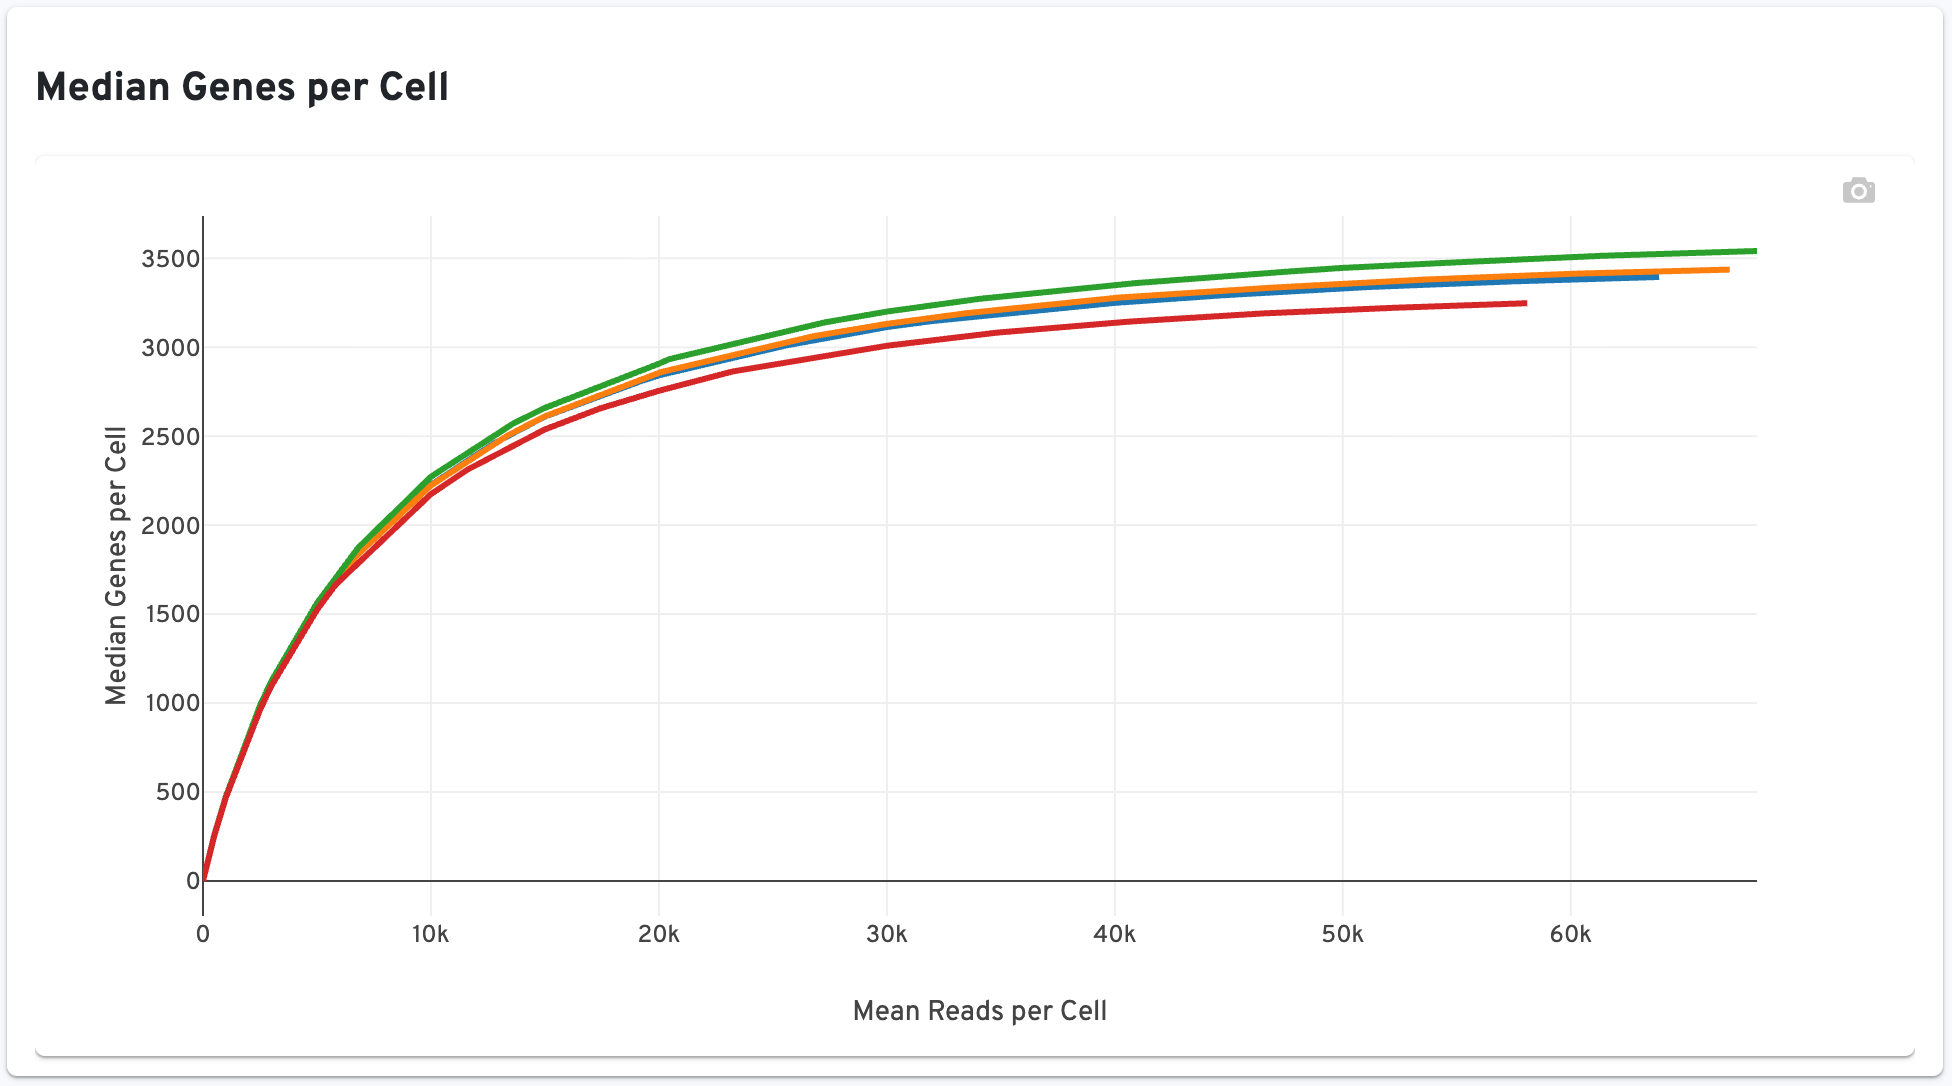
This plot shows the Median Genes per Cell as a function of downsampled sequencing depth in mean reads per cell, up to the observed sequencing depth. The slope of the curve near the endpoint can be interpreted as an upper bound to the benefit to be gained from increasing the sequencing depth beyond this point.
The tab concludes with the UMIs from Genomic DNA panel:
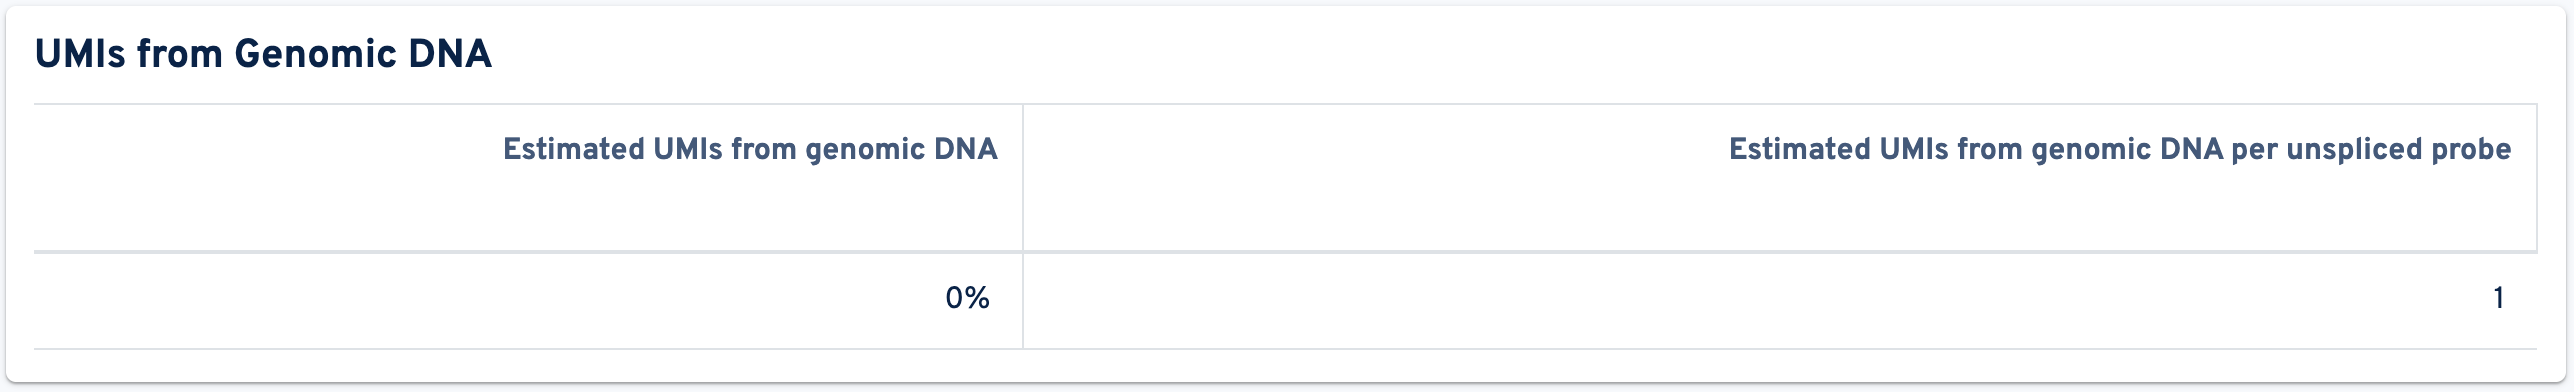
- Estimated UMIs from genomic DNA: The estimated fraction of filtered UMIs derived from genomic DNA based on the discordance between probes targeting exon-junction-spanning regions and non-exon-junction-spanning regions.
- Estimated UMIs from genomic DNA per unspliced probe: The estimated number of UMIs derived from genomic DNA for each probe targeting non-exon-junction-spanning regions. A probe not spanning an exon junction with a total UMI count below this value has a high likelihood of its UMIs being derived primarily from hybridization to genomic DNA rather than the mRNA.
Return to the top of the page and click the Antibody Library tab:
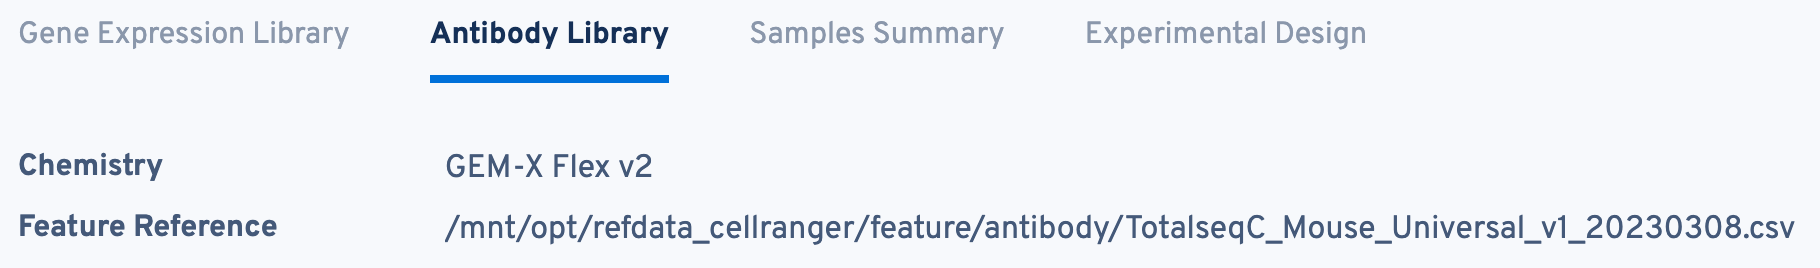
The structure of this tab is very similar to the Gene Expression Library tab. The Chemistry and Feature Reference are displayed again here for convenience.
The top panel displays the Antibody Expression metrics:
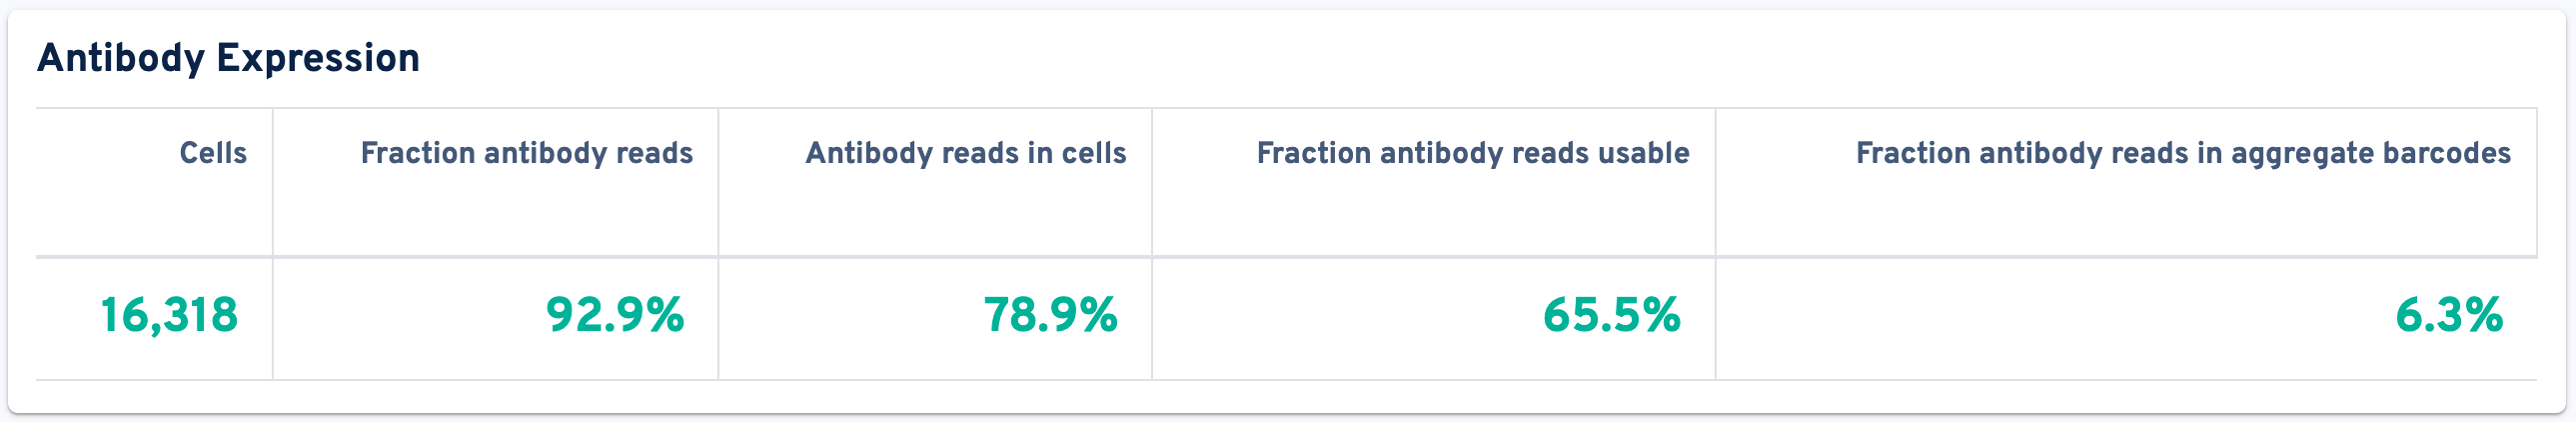
- Cells: The number of barcodes identified by the cell-calling algorithm as containing a cell. Barcodes removed by Protein Aggregate Detection and Filtering or High Occupancy GEM Filtering are not counted.
- Fraction antibody reads: Fraction of read pairs that contain a recognized antibody Feature Barcode.
- Antibody reads in cells: The fraction of valid-barcode, valid-UMI, recognized antibody Feature Barcode reads with cell-associated barcodes.
- Fraction antibody reads usable: Fraction of read pairs that contain a recognized antibody Feature Barcode, a valid UMI, and a cell-associated barcode.
- Fraction antibody reads in aggregate barcodes: Fraction of read pairs with valid barcodes that were removed because they are aggregates.
The next panel lists the Antibody Library Quality metrics:
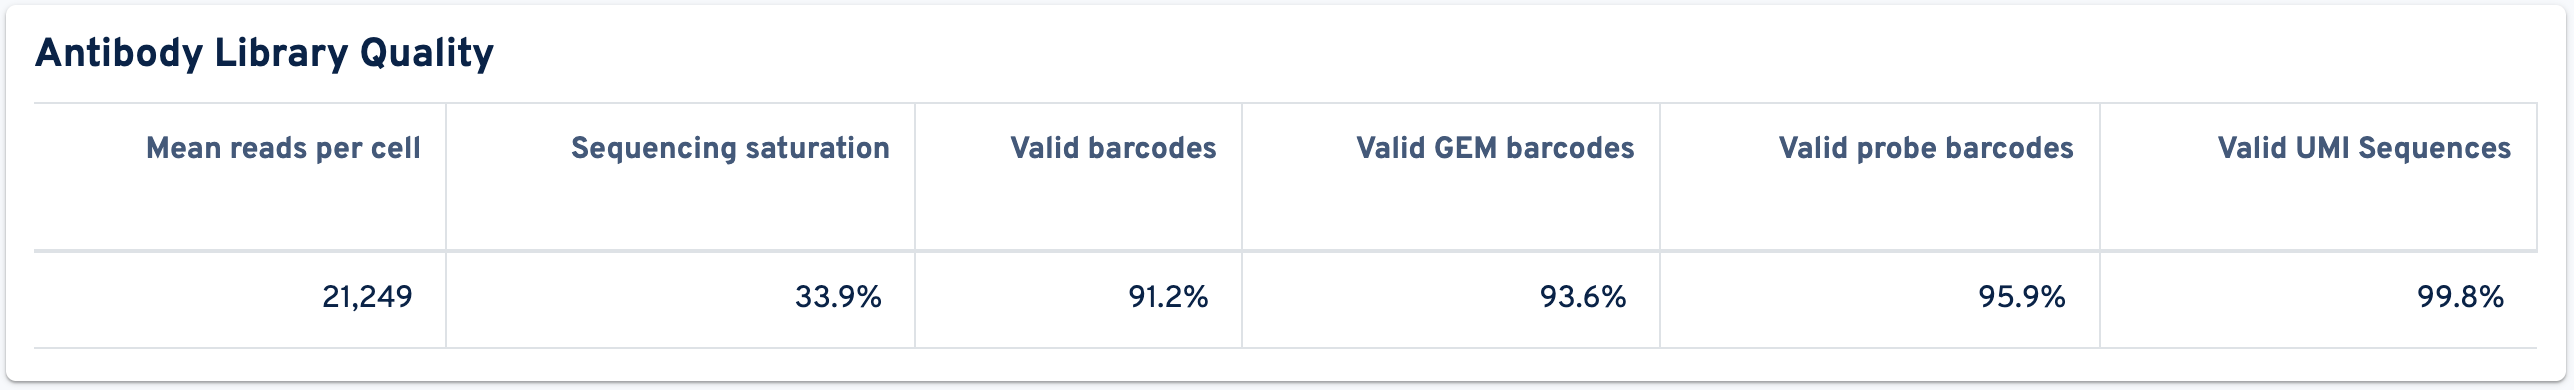
- Mean reads per cell: The total number of sequenced read pairs divided by the number of cell-associated barcodes.
- Sequencing saturation: The fraction of reads originating from an already-observed UMI. This fraction is a function of library complexity and sequencing depth. It is calculated as the ratio of reads with non-unique (cell barcode, UMI, Feature Barcode) combinations to the total number of valid reads.
- Valid barcodes: Fraction of reads with barcodes that are present in the whitelist after barcode correction. The cell barcode is the combination of the GEM barcode and probe barcode and both parts must be valid following correction.
- Valid GEM barcodes: Fraction of reads with GEM barcodes that are present in the whitelist after barcode correction.
- Valid probe barcodes: Fraction of reads with probe barcodes that are present in the whitelist after barcode correction.
- Valid UMI Sequences: Fraction of reads with valid UMI sequences; i.e. UMI sequences that do not contain Ns and that are not homopolymers.
The following panel displays metrics relevant to Antibody Sequencing Run Quality:
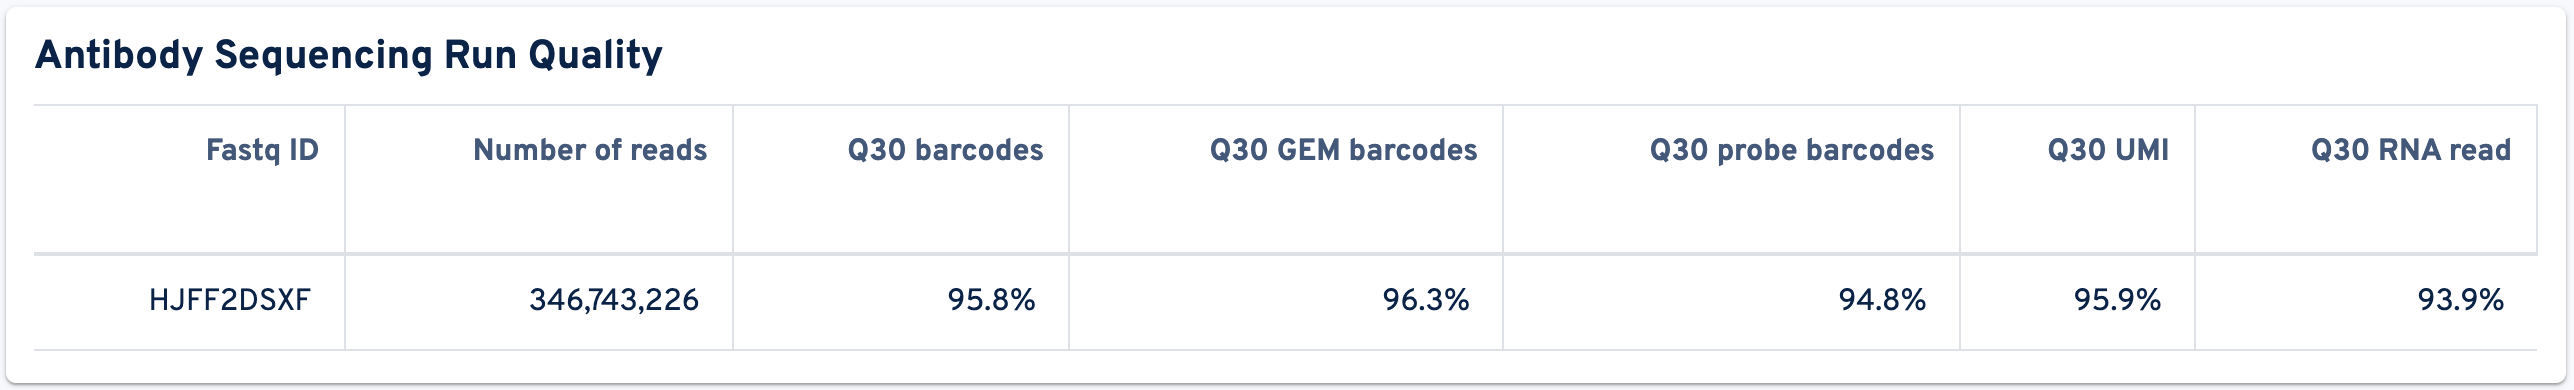
- Fastq ID: Unique identifier for each sequencing run.
- Number of reads: Total number of read pairs sequenced during this run.
- Q30 barcodes: Fraction of cell barcode bases with Q-score ≥ 30, excluding very low quality/no-call (Q ≤ 2) bases from the denominator. The cell barcode is the combination of the GEM barcode and probe barcode.
- Q30 GEM barcodes: Fraction of GEM barcode bases with Q-score ≥ 30, excluding very low quality/no-call (Q ≤ 2) bases from the denominator.
- Q30 probe barcodes: Fraction of probe barcode bases (or antibody multiplexing barcode bases for Flex with Antibody Feature Barcode) with Q-score ≥ 30, excluding very low quality/no-call (Q ≤ 2) bases from the denominator.
- Q30 UMI: Fraction of UMI bases with Q-score ≥ 30, excluding very low quality/no-call (Q ≤ 2) bases from the denominator.
- Q30 RNA read: Fraction of probe read bases (R2) with Q-score ≥ 30, excluding very low quality/no-call (Q ≤ 2) bases from the denominator.
After this, the Metrics per probe barcode metrics are shown:
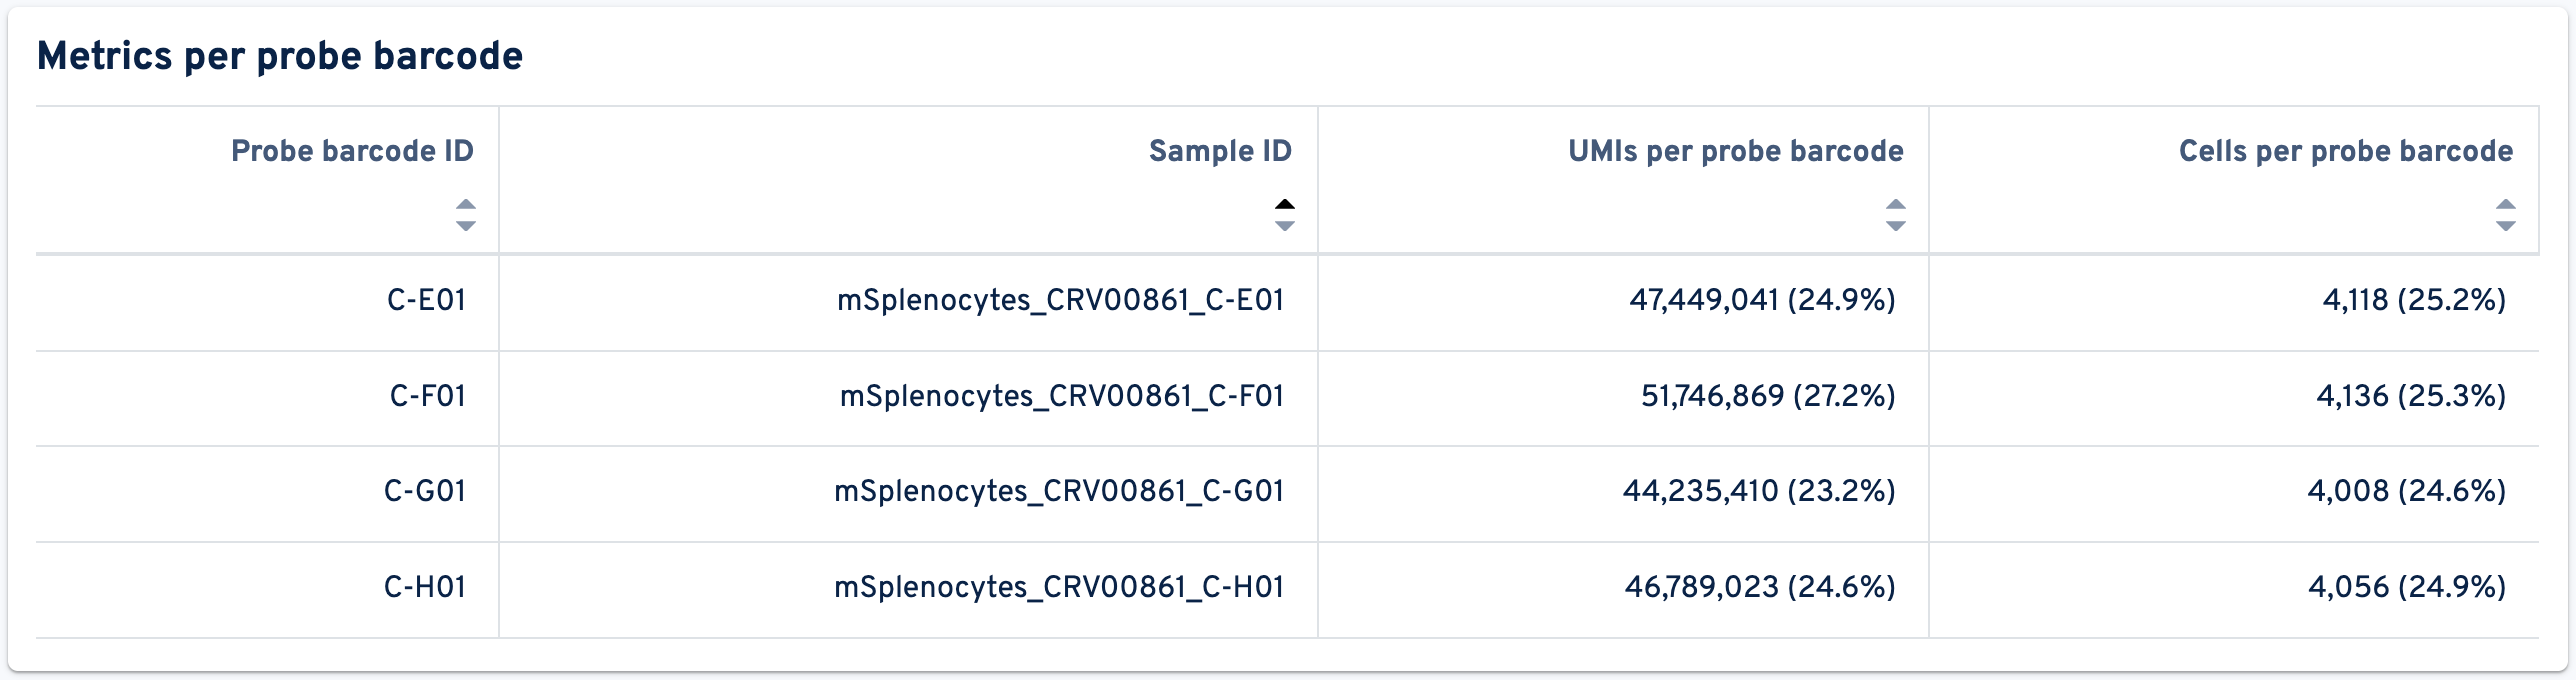
- Probe barcode ID: The identifier of this probe barcode.
- Sample ID: The identifier of the sample associated with this probe barcode.
- UMIs per probe barcode: Number and fraction of UMIs for this probe barcode amongst all UMIs for that library type in the raw feature-barcode matrix.
- Cells per probe barcode: Number and fraction of cells per probe barcode amongst all cells detected in this GEM well. Cell calling is based on gene expression data when present.
The final plot on this tab is the Antibody Barcode Rank Plot:
The plot shows filtered UMI counts mapped to each GEM barcode. Barcode-cell associations can be determined by UMI count or expression profile, or removed by Protein Aggregate Detection and Filtering and/or High Occupancy GEM Filtering steps. Therefore, some regions of the graph contain both cell-associated and background-associated barcodes. When present, Gene Expression data is used to identify these barcode populations. The color of the graph is based on the local density of barcodes that are cell-associated in these regions. Hovering over the plot displays the total number and percentage of barcodes in that region called as cells along with the number of UMI counts for those barcodes and barcode rank, ordered in descending order of UMI counts.
Return to the top of the page and click the Samples Summary tab:

On the left-hand side, you can use the Search box to search for a specific sample ID, toggle the View between visualizations or tables, and show only samples with Alerts:
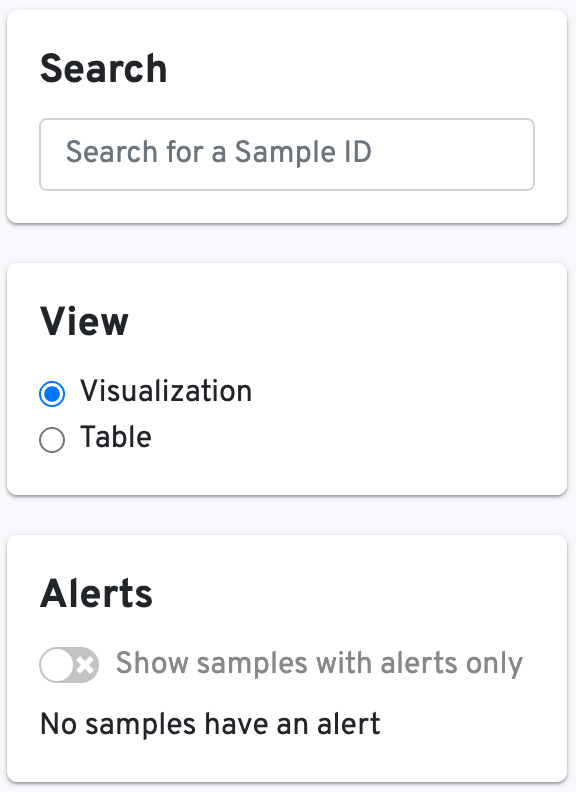
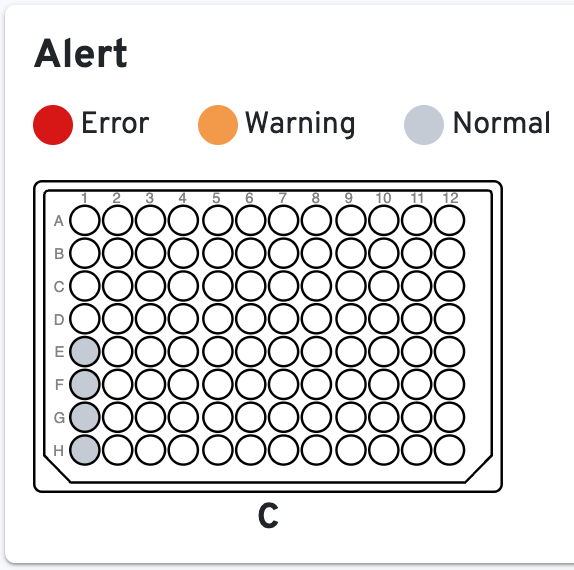
To the right, the Alert panel will show which samples have errors, warnings, or are normal:
Below that, a Barcode Rank Plot showing separate traces for each sample is displayed:
Next, you can view the Metrics panel as either a beeswarm plot or a heat map:
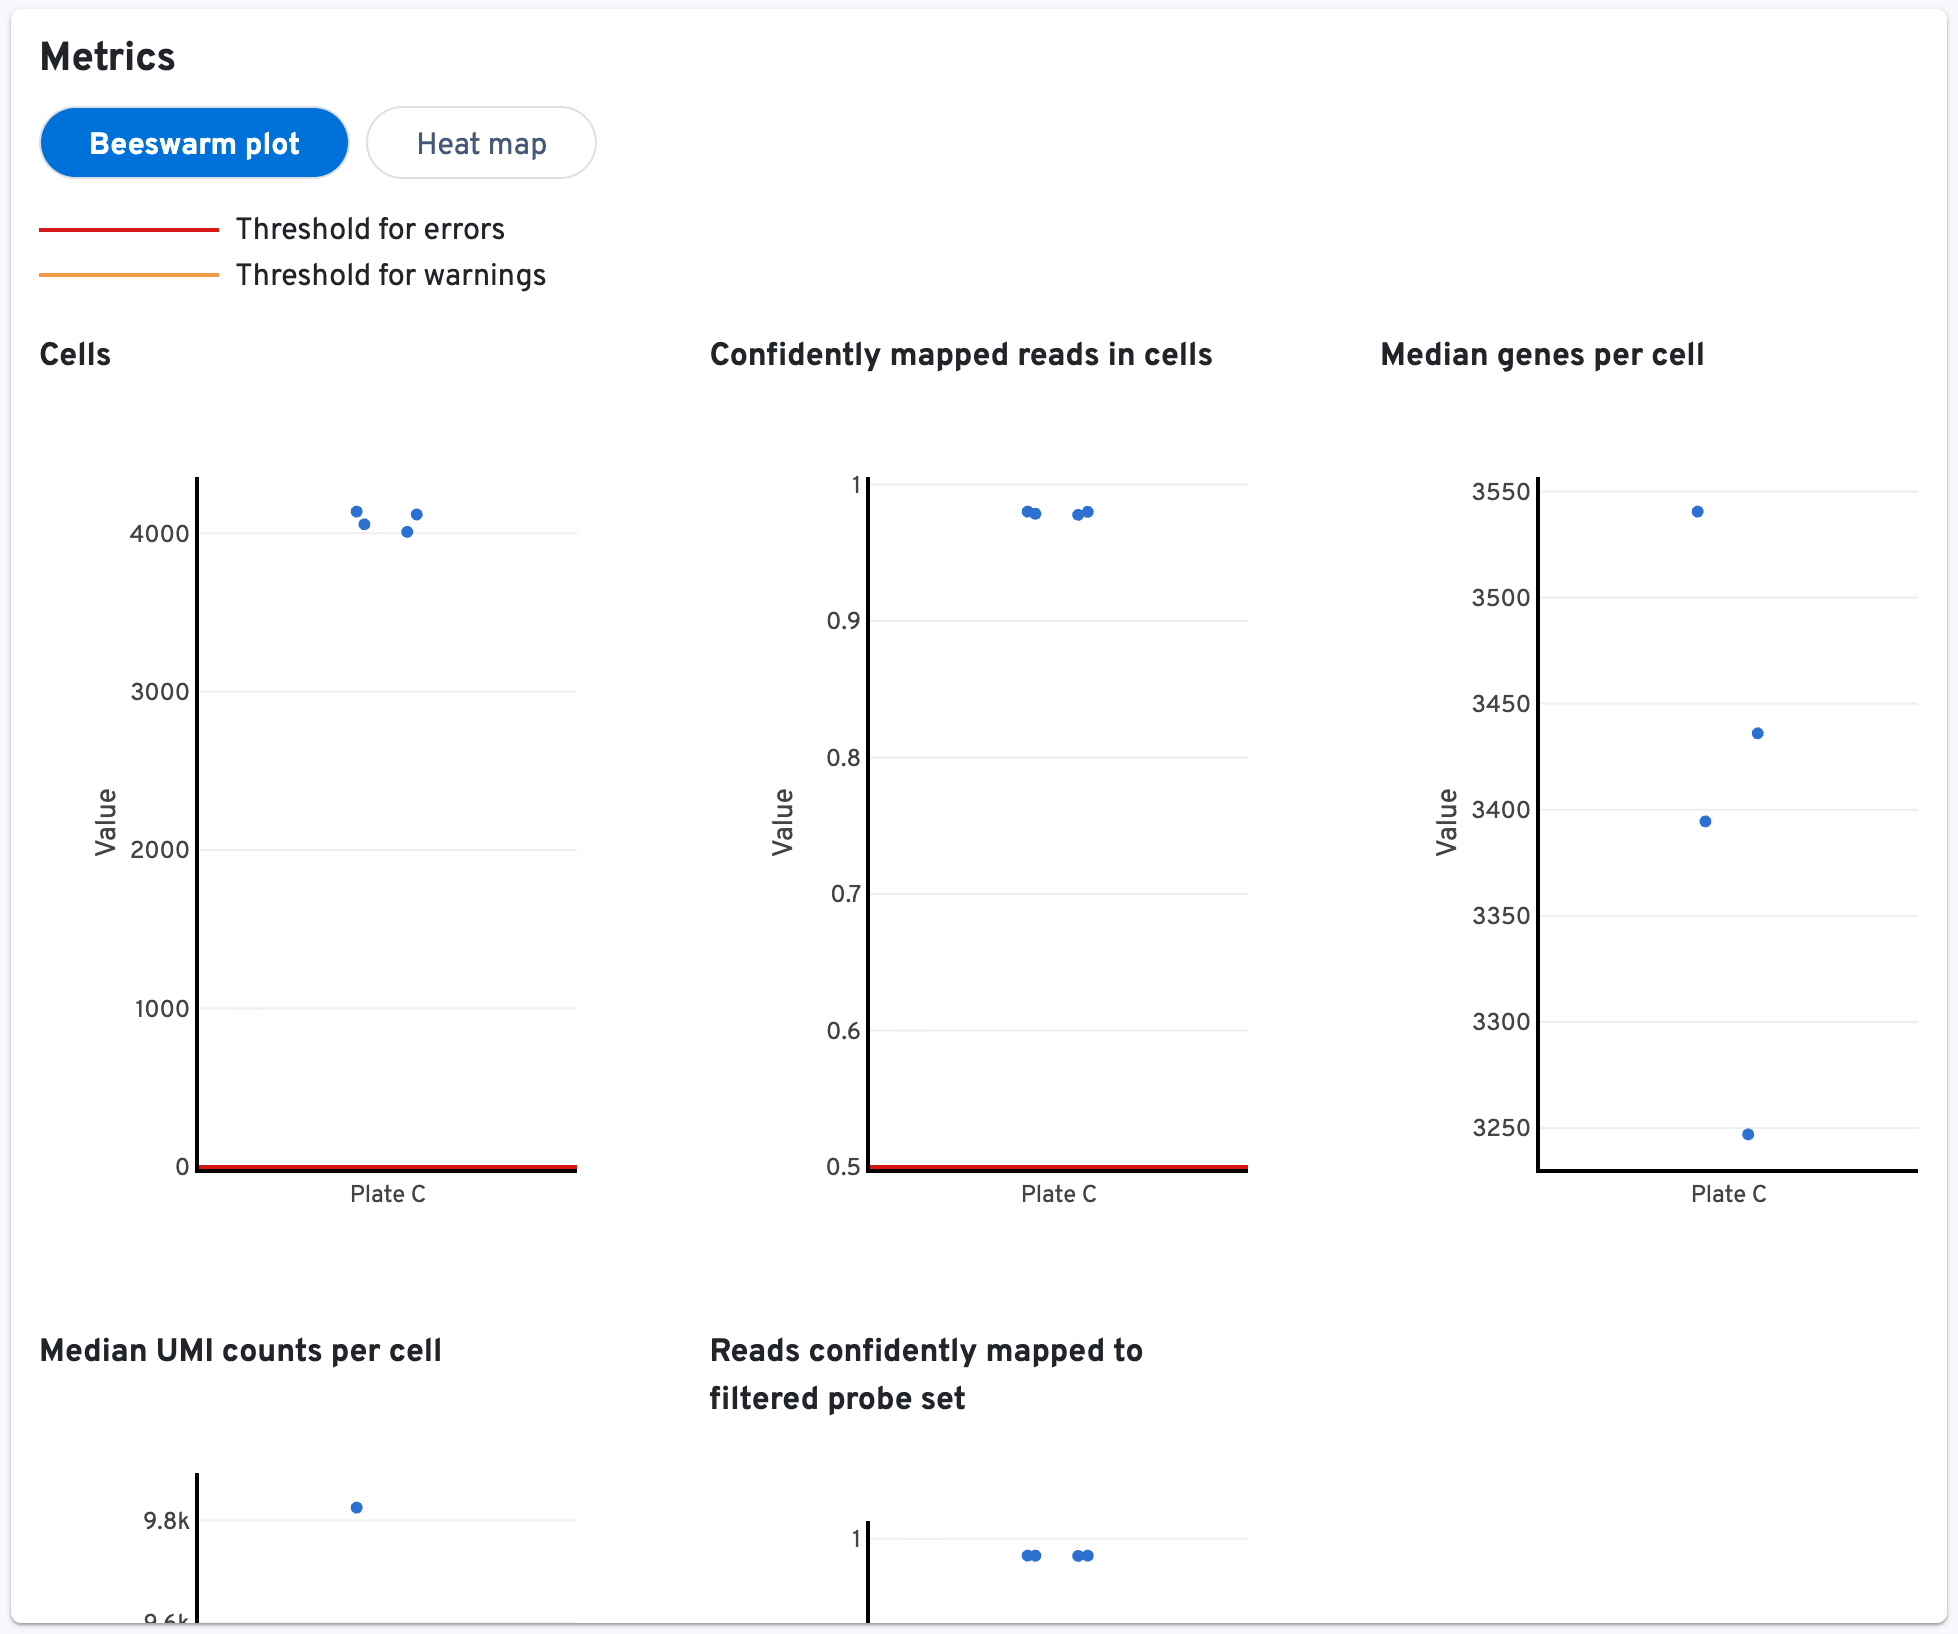
- Cells: Number of cells called from this sample.
- Confidently mapped reads in cells: The fraction of valid-barcode, valid-UMI, confidently-mapped-to-the-whole-probe-set reads with cell-associated barcodes.
- Median genes per cell: The median number of genes detected per cell called from this sample. Detection is defined as the presence of at least 1 UMI count.
- Median UMI counts per cell: Median number of UMIs obtained from the cells called from this sample.
- Reads confidently mapped to filtered probe set: Fraction of reads from probes that map to a unique gene. These reads are considered for UMI counting.
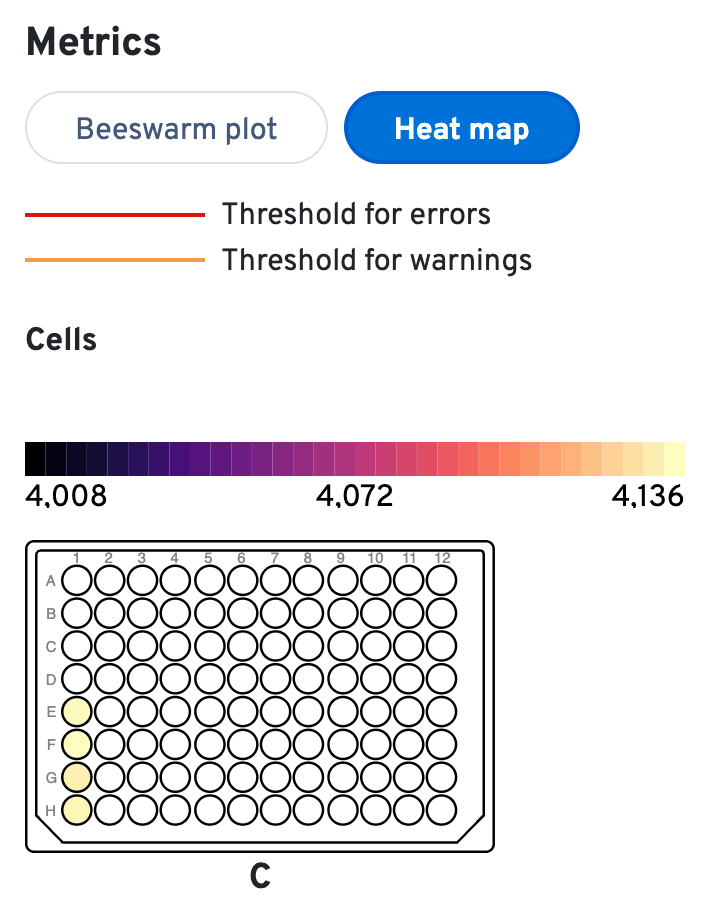
These metrics can also be visualized as heat maps:
Finally, the Median Genes per Cell plot is displayed:
Return to the top of the page and click the final tab, Experimental Design:
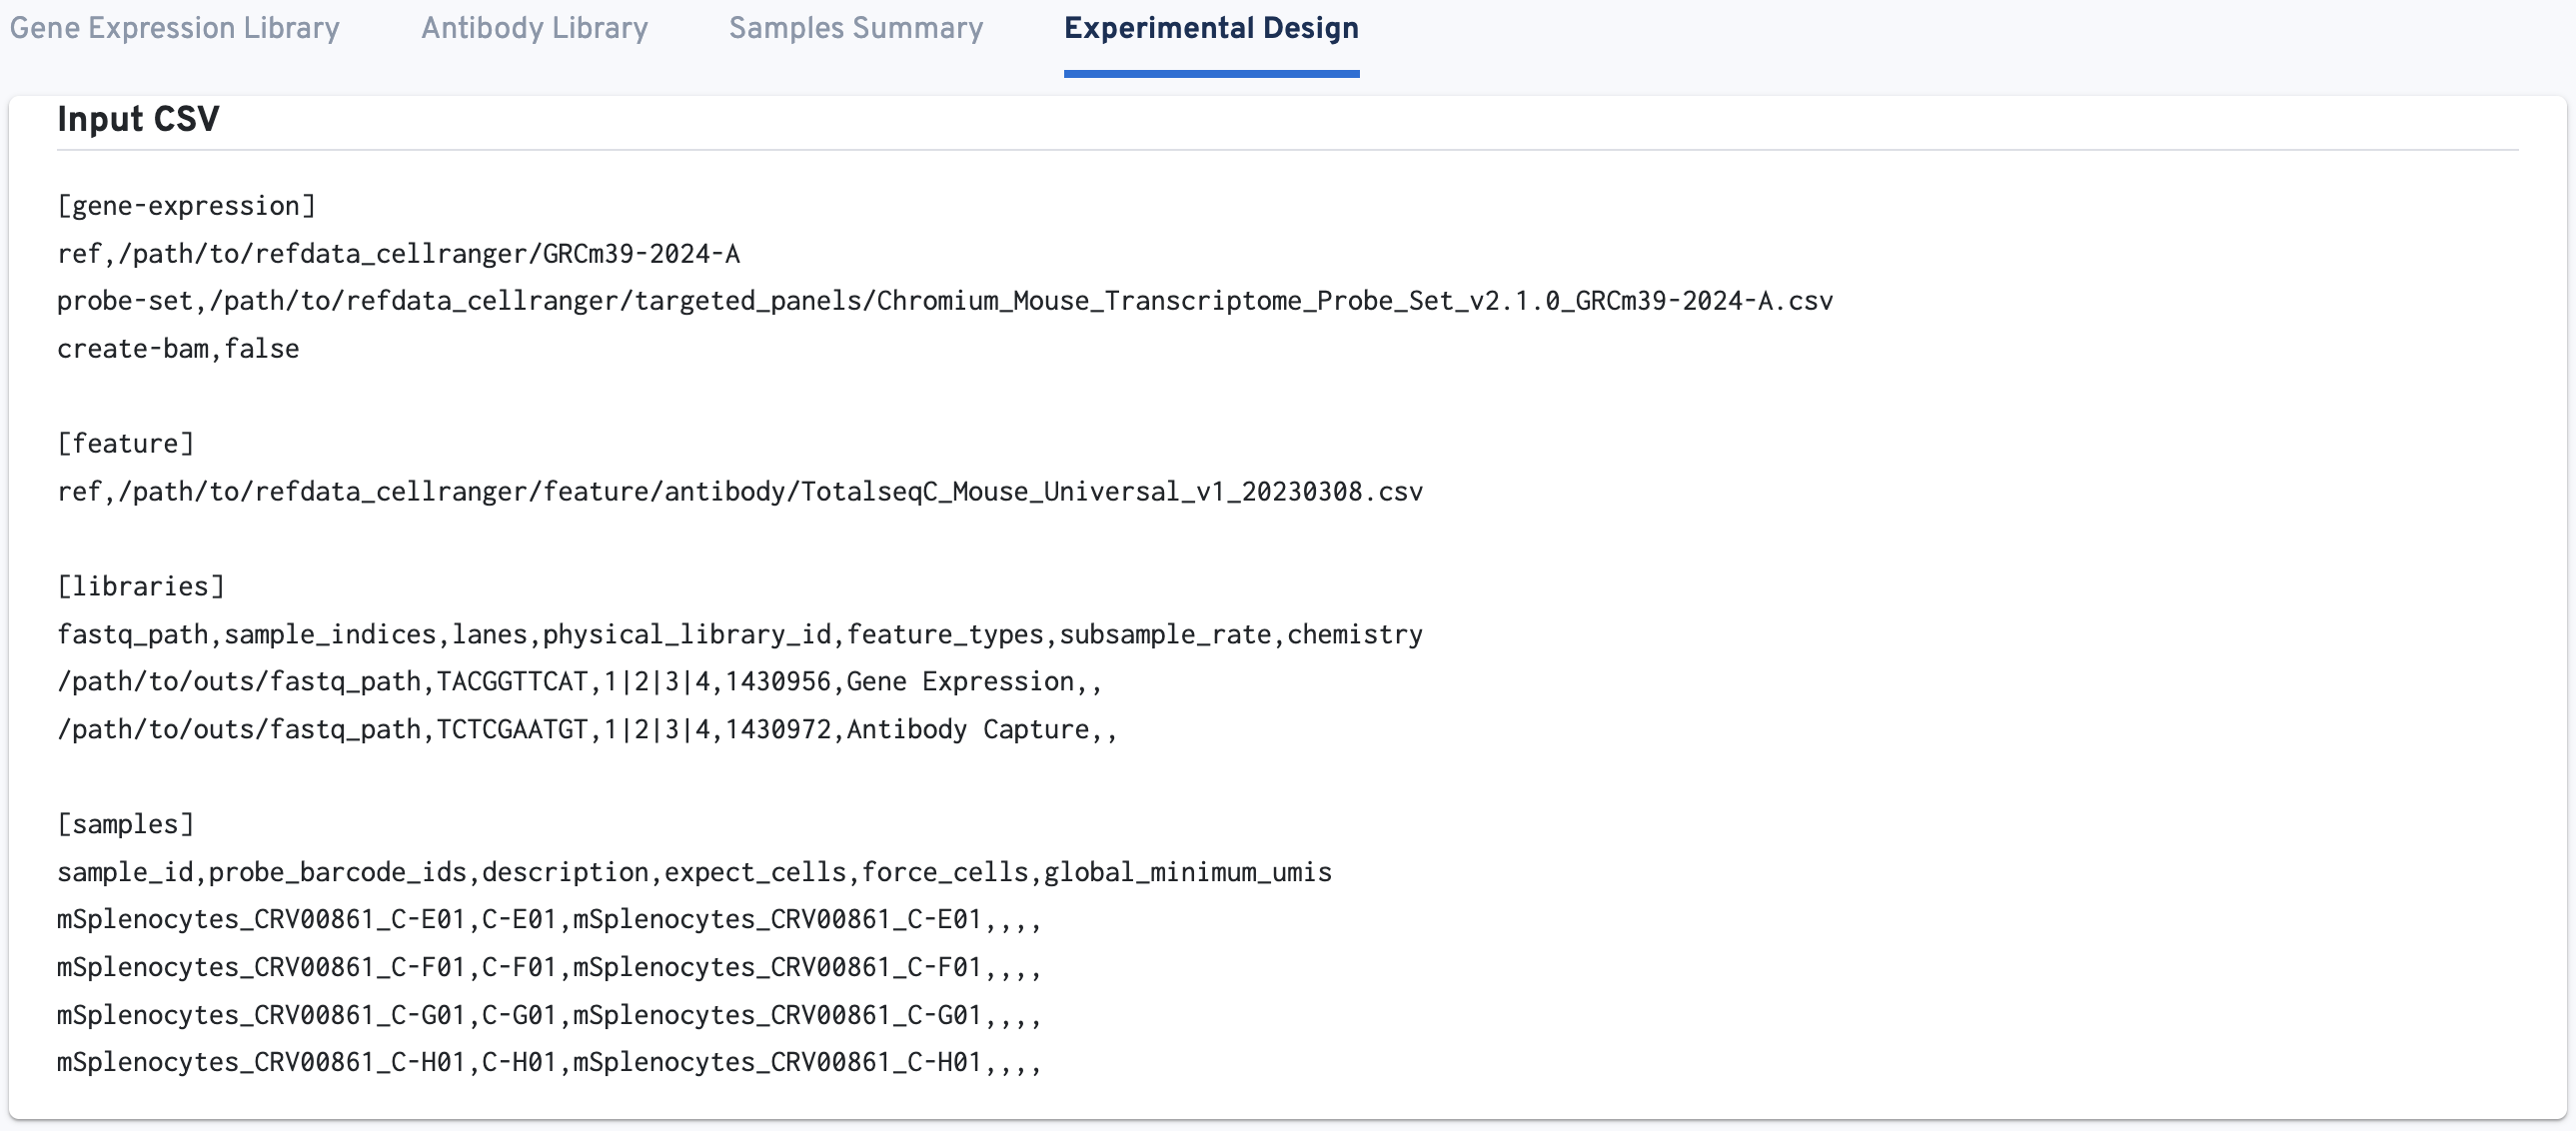
This tab shows the Input CSV (i.e., the multi config CSV) used for the cellranger multi run. Use this tab to confirm the analysis was run as expected given your experimental design.