FFPE Human Breast using the Entire Sample Area
In Situ Gene Expression dataset analyzed using Xenium Onboard Analysis 1.0.2

Learn about Xenium Analysis
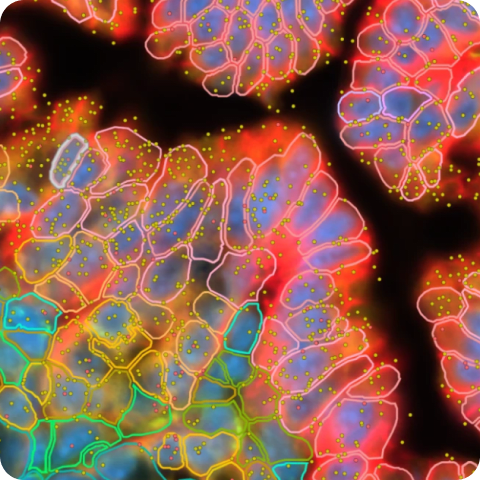
Demonstration of the Xenium platform's large imaging sample area, which enables high resolution and high throughput gene expression profiling. Replicate results demonstrate the high reproducibility of data generated by the platform.
The data were generated with the pre-designed Xenium Human Breast Gene Expression Panel (v1).
5µm sections from a formalin-fixed paraffin-embedded (FFPE) human breast resected tumor mass sample:
- Infiltrating Ductal Carcinoma (from Avaden Biosciences)
Tissues were prepared following the Xenium In Situ for FFPE - Tissue Preparation Handbook (CG000578).
Post-instrument processing followed the demonstrated protocol Xenium In Situ Gene Expression - Post-Xenium Analyzer H&E Staining (CG000613). The registered H&E image file is suitable for annotating regions. It may or may not be suitable for more refined exact sub-cellular resolution correspondence due to minute differences in the optics of the microscopy systems. Learn more in the H&E to Xenium DAPI Image Registration with Fiji Analysis Guide.
How to view data
Shared files are displayed in the Inputs/Slide tab and per-sample output files are in the Replicate tabs. Interactively explore data with Xenium Explorer by downloading the Xenium Output Bundle file. Load the Gene Groups CSV to create gene groups based on cell type markers. Follow these instructions to view the post-Xenium H&E image or image alignment file in Xenium Explorer.
Key metrics
| Metric | Replicate 1 | Replicate 2 |
|---|---|---|
| Median transcripts per cell | 100 | 97 |
| Cells detected | 892,966 | 885,523 |
| Decoded transcripts per 100 µm² | 58.8 | 56.6 |
| Total transcripts detected | 105,584,672 | 100,634,191 |
| Scanned tissue area (cm²) | 2.28 | 2.21 |
This dataset is licensed under the Creative Commons Attribution 4.0 International (CC BY 4.0) license. 10x citation guidelines available here.