The following tutorials review the major analysis capabilities available for Visium Spatial Gene Expression in Loupe Browser using a v1 mouse brain dataset.
Follow the instruction on the Installation page to download and install OS-specific software (Windows or macOS).
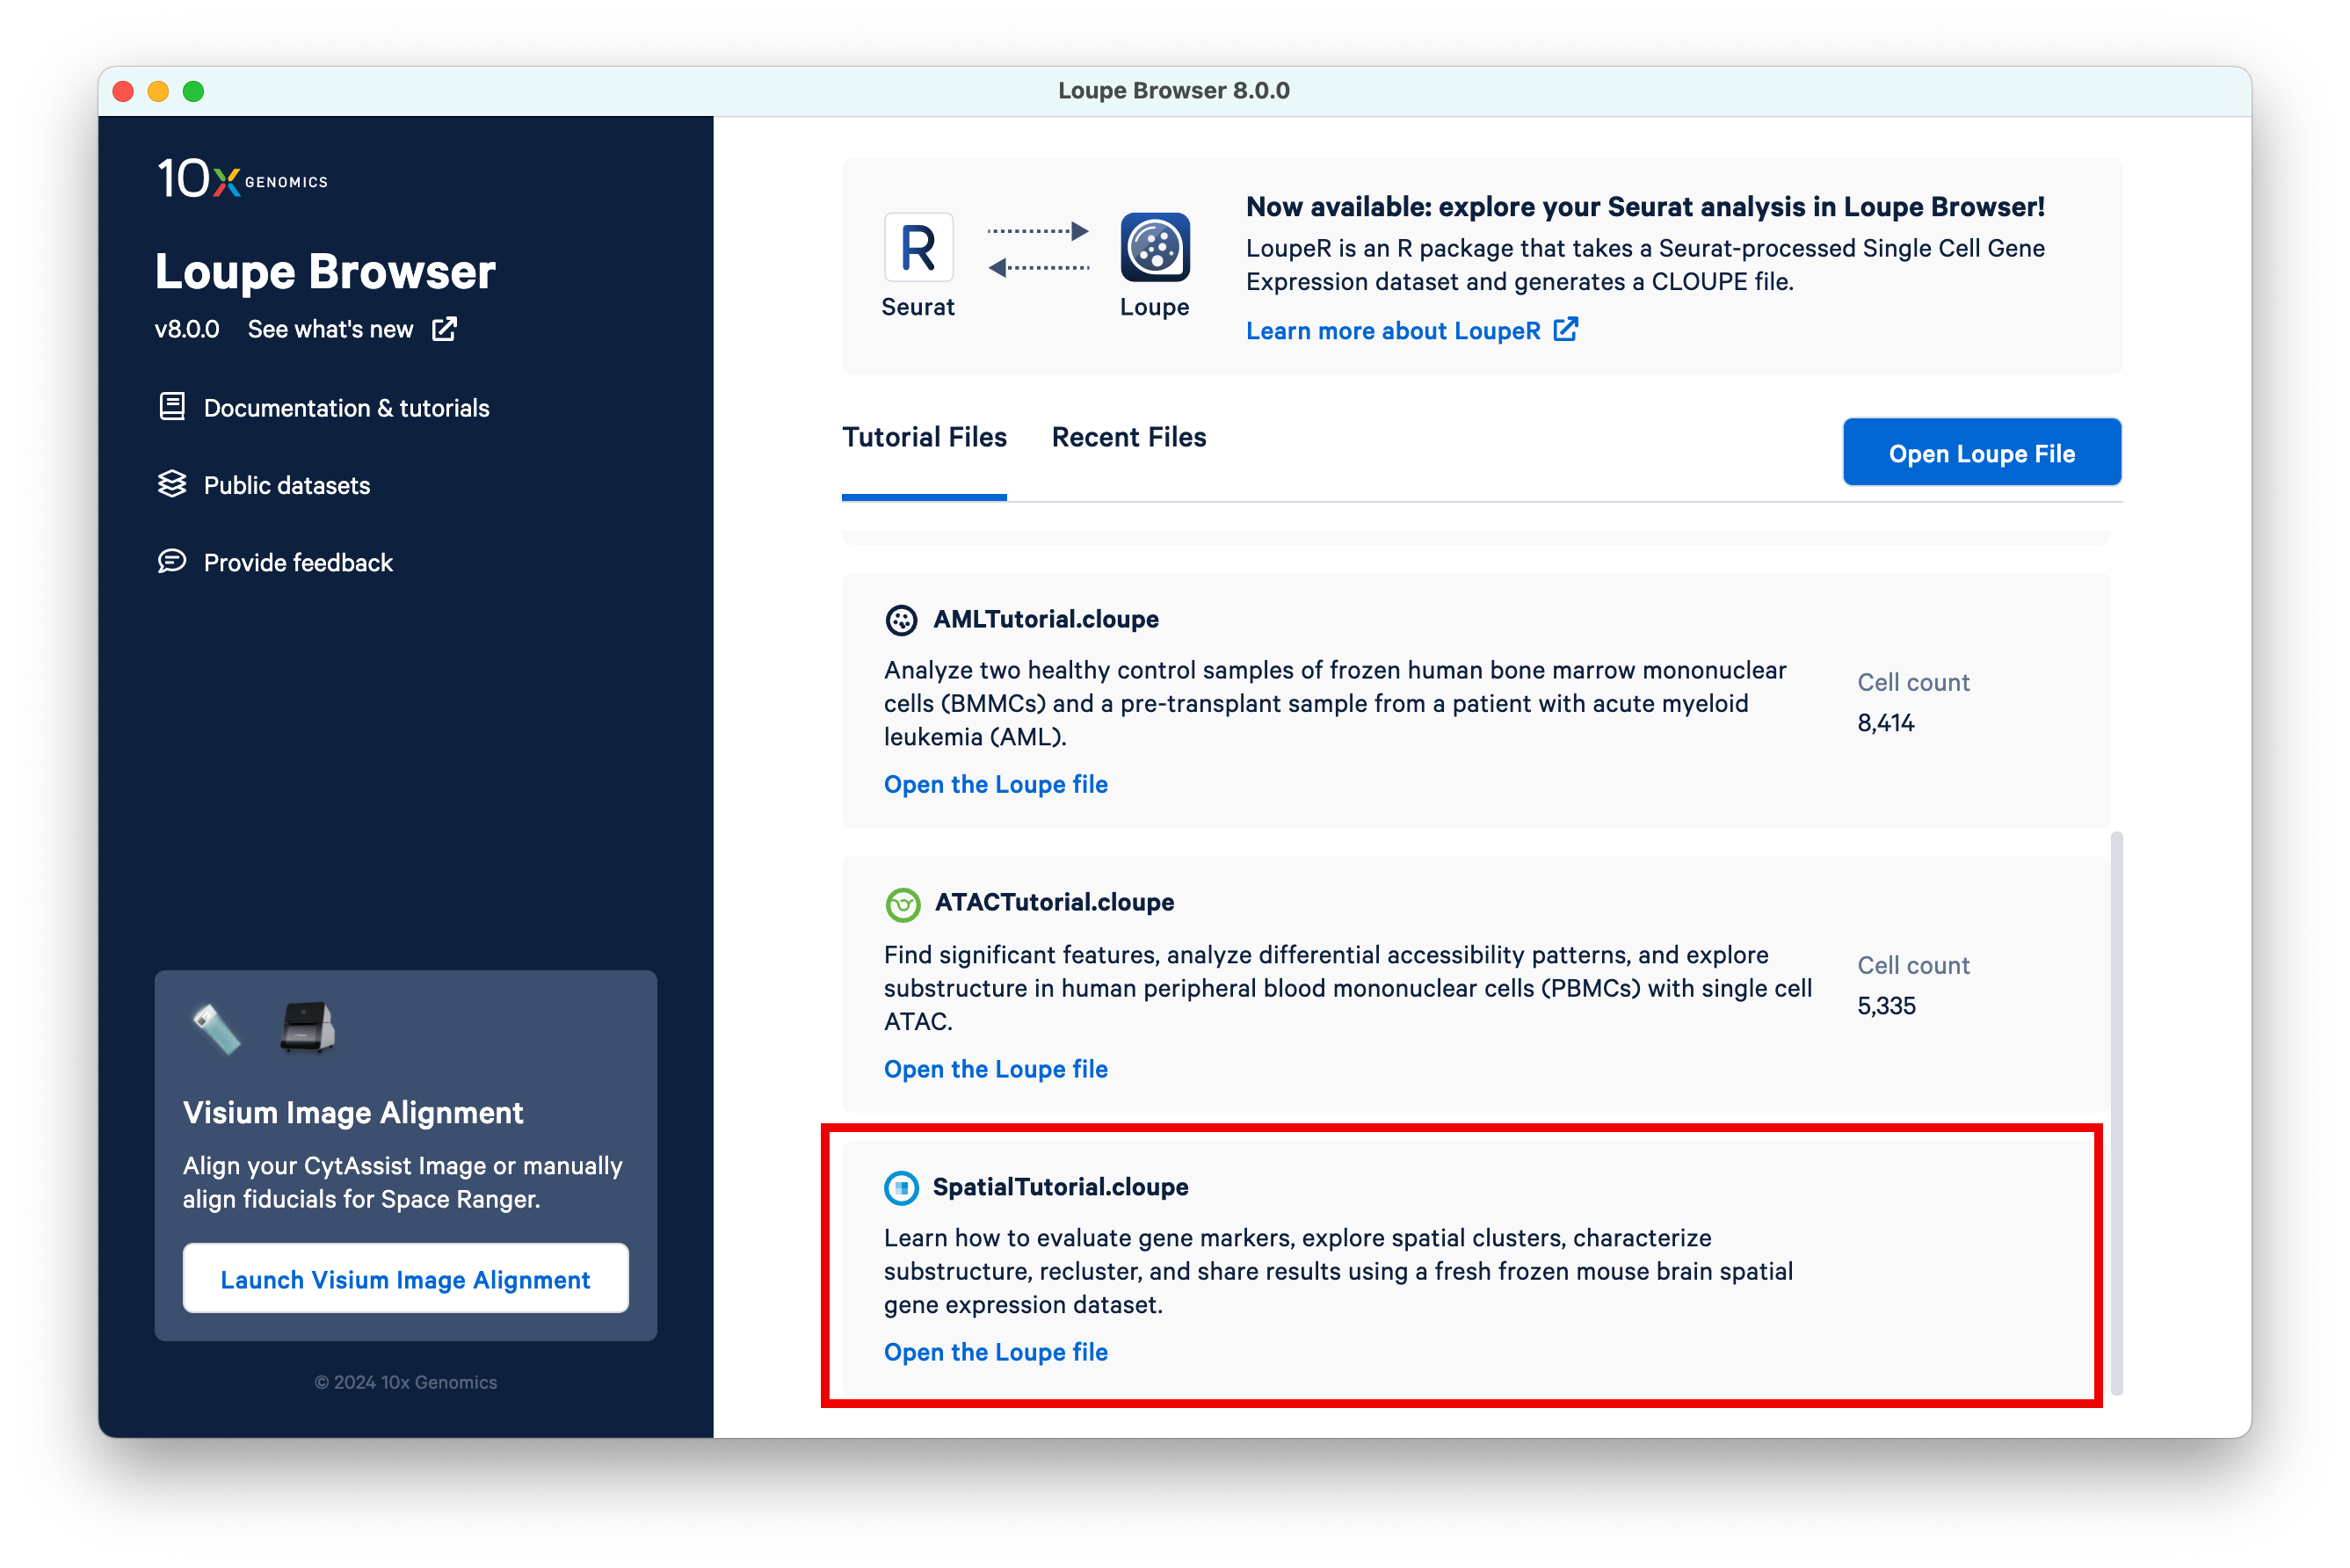
Click on the SpatialTutorial.cloupe file from the list of Tutorial Files.
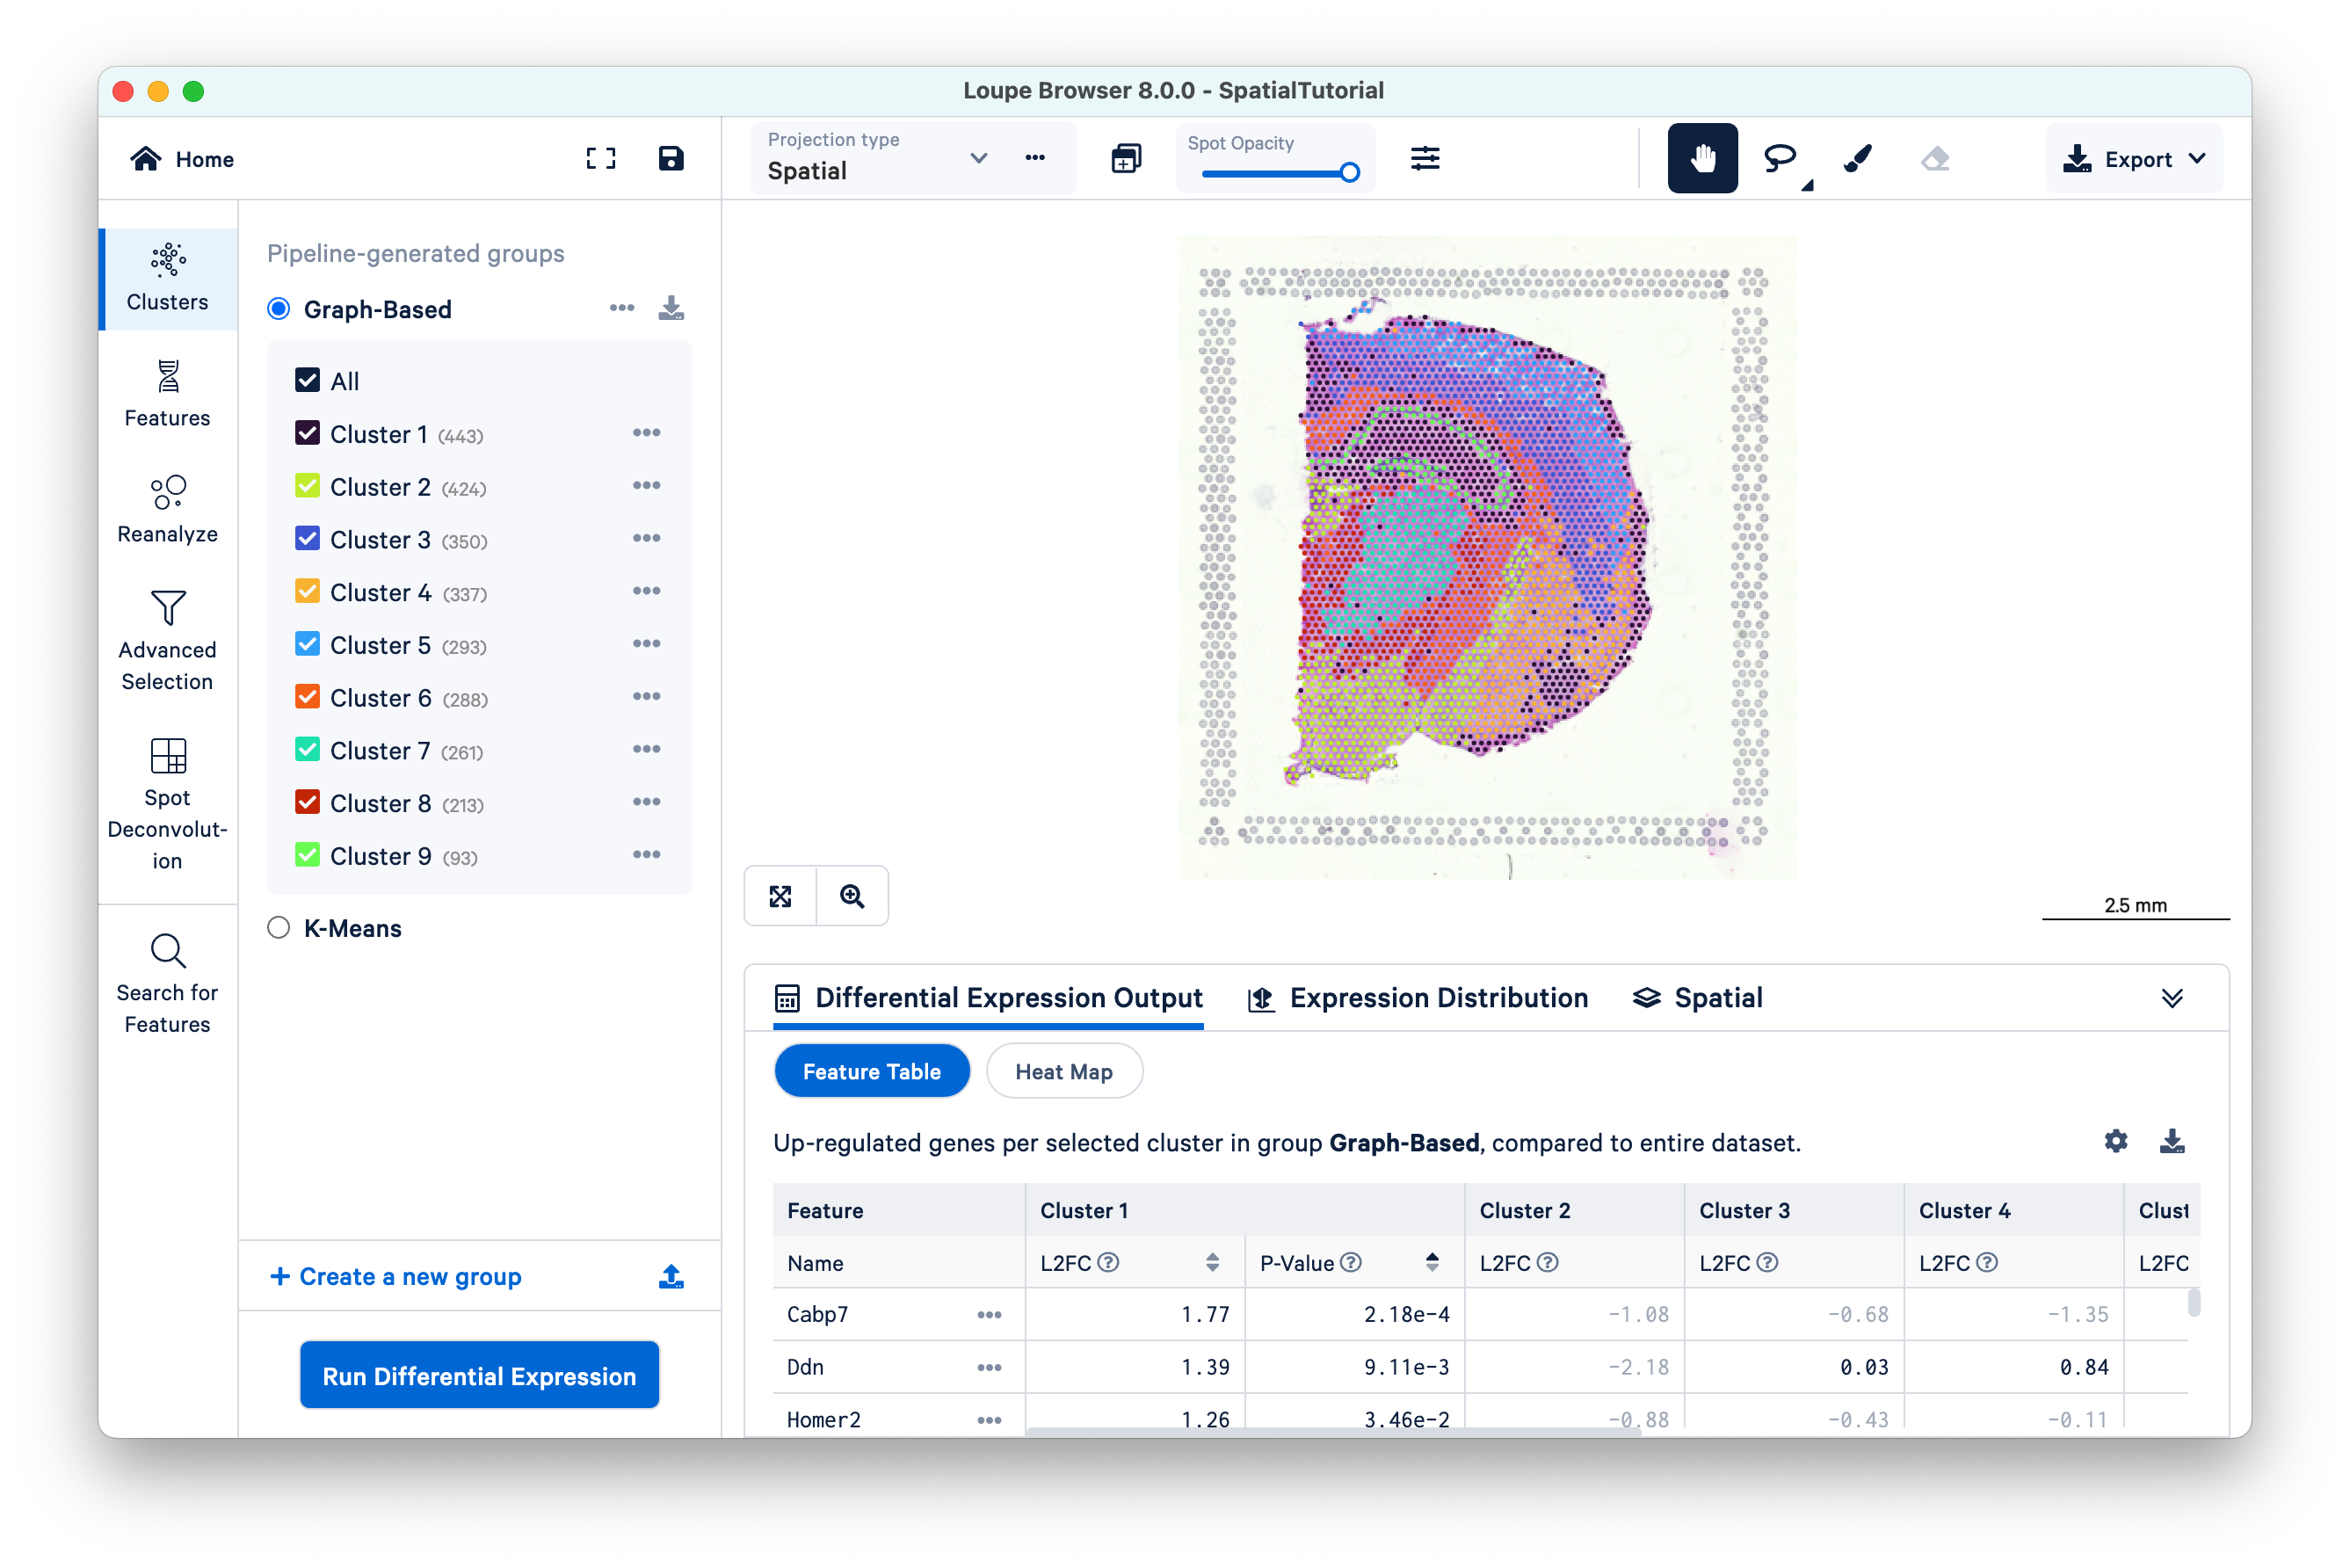
The file opens in a new window with the mouse brain image and the spots overlaid on top of the image. The spots are color-coded by the cluster that the spot was assigned to.
The SpatialTutorial was generated from fresh frozen mouse brain tissue section (Visium v1). A brightfield image of the hematoxylin & eosin (H&E) stained tissue section was acquired. Refer to the dataset page for more about the imaging and sequencing details. The embedded .cloupe file was generated by Space Ranger v1.3 pipeline which was run with automatic fiducial detection and image alignment arguments. Several other Spatial Gene Expression datasets are publicly hosted and available for download. These datasets include the .cloupe file that you can use to visualize the results. Visit the 10x Genomics datasets page to browse the latest datasets.
- Evaluate Gene Markers: Use gene markers of known cell type to view their spatial distribution, and explore the use of gene expression independent spatial enrichment metric Moran's I (v1.3 and later) to evaluate spatiality.
- Explore Spatial Clusters: Understand gene expression data in a spatial context and use gene lists to create custom categories and evaluate differential gene expression between them.
- Spatial Reclustering: Reanalyze spatial datasets for clusters or regions of interest by customizing clustering and projection parameters to identify new insights.
- Sharing Results: Save features of interest, export data tables, and plots from the Visium Spatial data.