Loupe 7.0 introduces a new user interface (UI) for intuitive data exploration. Components have been consolidated based on function, analysis options are always visible, differential expression is easier to find and use, and the feature tabs experience has improved. For more details on the UI and other improvements, see the Loupe Browser downloads page.
- Learn how to navigate the updated Loupe Browser 7.0 UI with the bundled Visium mouse brain dataset
- Learn what other Loupe tutorials are available for Visium users
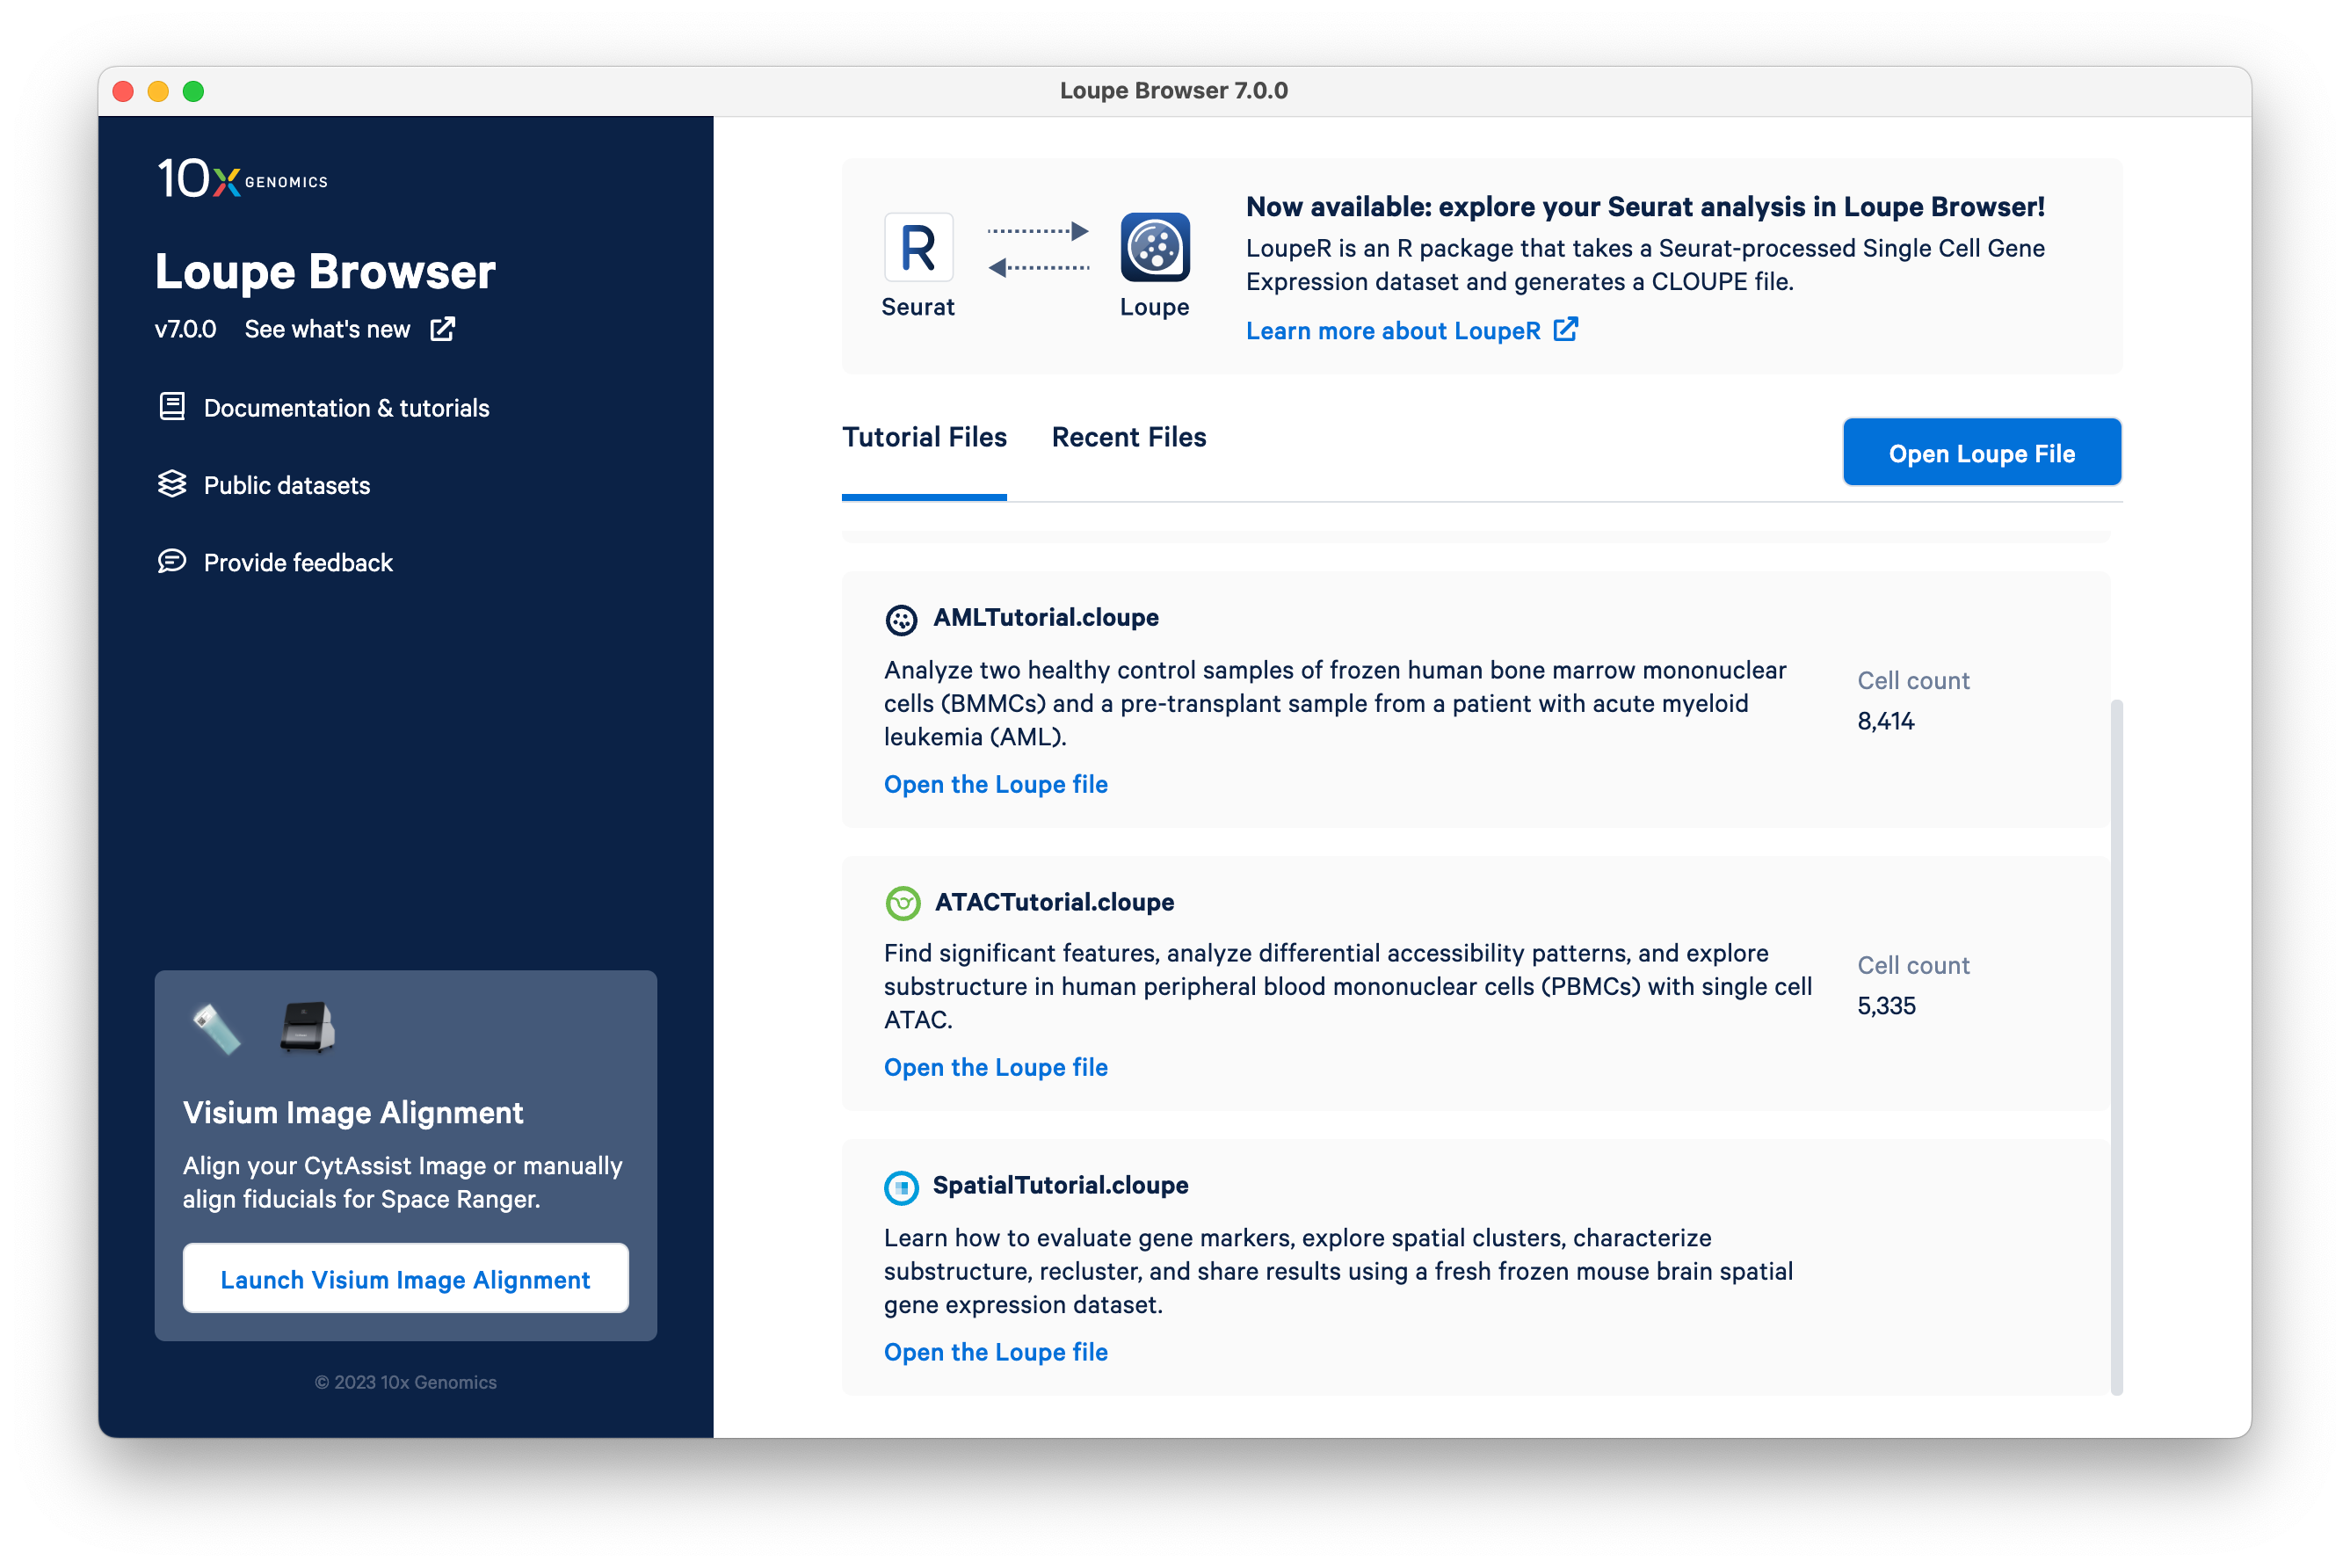
Once you have downloaded and installed Loupe Browser 7.0, open the browser and select SpatialTutorial.cloupe from the Tutorial Files tab to load the mouse brain dataset.
The SpatialTutorial was generated from a fresh frozen mouse brain tissue section, run with Space Ranger v2.1 (for more details see the full dataset description).
The following image provides an overview of the key components of the Loupe Browser interface. Each of these components is described in more detail below.
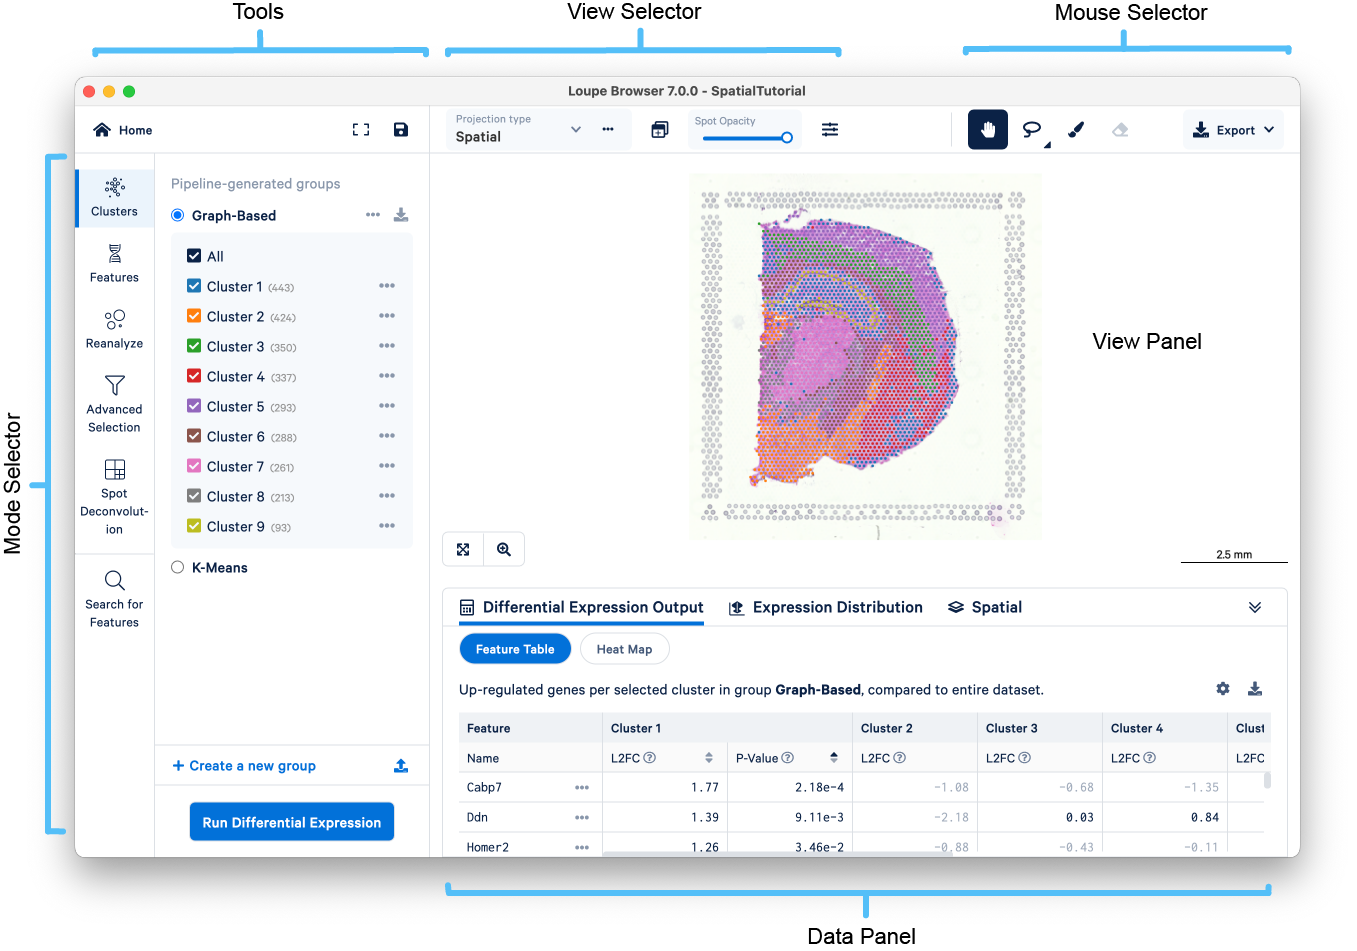
The workspace is centered around the View Panel, showing an H&E brightfield image of the tissue section overlaid with spots representing Visium Spatial Gene Expression data.
You can drag the mouse over the image to reposition the plot, and use the mouse wheel or track pad to zoom. Notice the cluster labels as you mouse over the plot. Spots are colored by the active legend in the sidebar.
- Click the autoscale icon
 to rescale the image to the screen size.
 - Toggle the zoom icon
 to zoom without using the mouse wheel or track pad.
Above and left of the View Panel are the Tools.

- Click the home icon
 to return to the home screen.
 - Click the hide icon
 to hide the UI.
 - The save icon
 saves your work.
To the right of the Tools is the View Selector, which controls what is displayed in the View Panel.
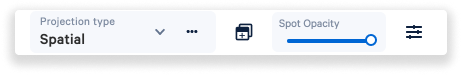
- Under the Projection Type dropdown, Spatial is the default view. You can also choose t-SNE, UMAP, or Feature Plot, or click
 to import a custom projection from a CSV file
  .
. - Click
 to open the projection in a new window.
 - Spot opacity can be controlled with the slider icon
 .
. - The filter table icon
 controls the projection settings.
On the top right of the window is the Mouse Selector.

- Click the pan icon
 to toggle the click-and-drag mouse action.
 - The lasso icon
 toggles betweeen the freehand and rectangular selection tools.
 - The paintbrush icon
 allows you to select spots manually.
 - Click Export
 to export to PNG (low resolution), SVG (high resolution) or CSV.
Left of the View Panel is the Mode Selector. By default, the Clusters mode is shown.
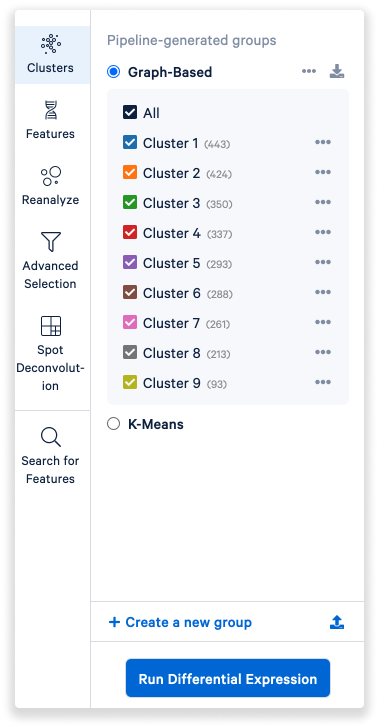
- By default, graph-based clusters are shown, but you can also choose K-means.
- Click to edit name or color.
- Click to edit the cluster name or delete the cluster.
- Click to download cluster assignments as a CSV file.
- You can create a new group or import your own
 . Follow the format given by downloading cluster assignments as a CSV file (see above).
 - You can Run Differential Expression on the selected clusters. The results will be shown in the Data Panel on the bottom right, covered further below.
Under the Features mode, you can explore expression of specific genes or features.
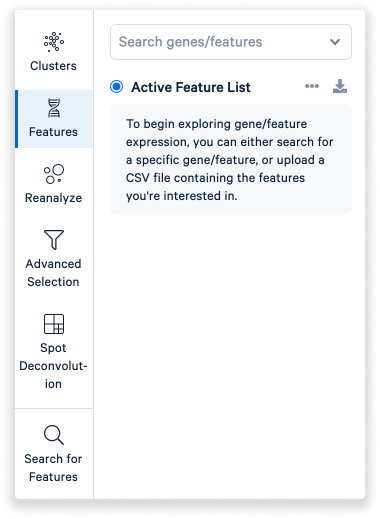
- Start by searching for a specific gene or feature.
- You can also upload a CSV file containing the features of interest.
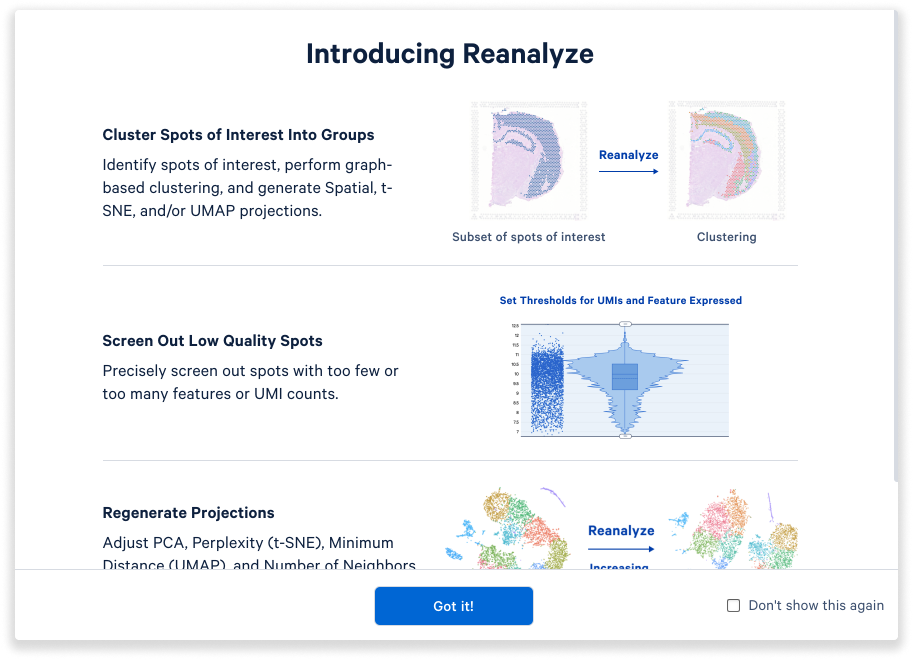
Choose the Reanalyze mode to start the custom reanalysis wizard.
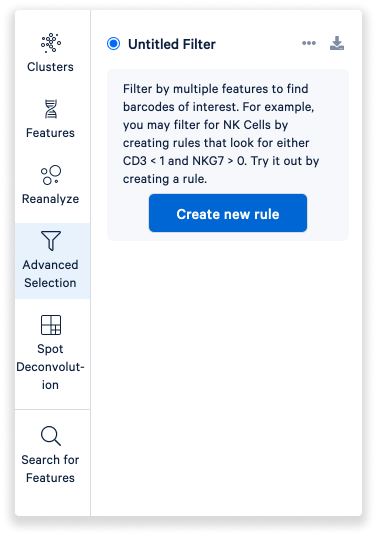
Toggle the Advanced selection mode to filter by multiple features to find barcodes of interest.
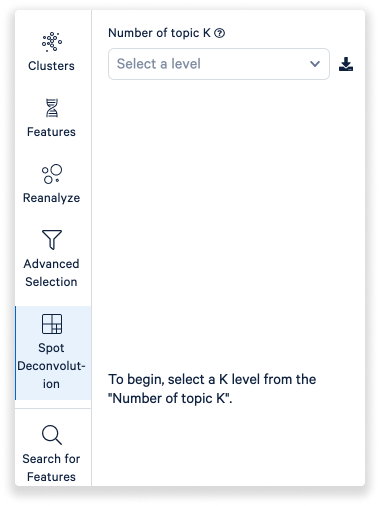
The Spot Deconvolution mode works similar to clusters, but groups represent latent topics (either cell types, or mixtures of cell types). See the spot deconvolution tutorial for more information on how to interpret this mode.
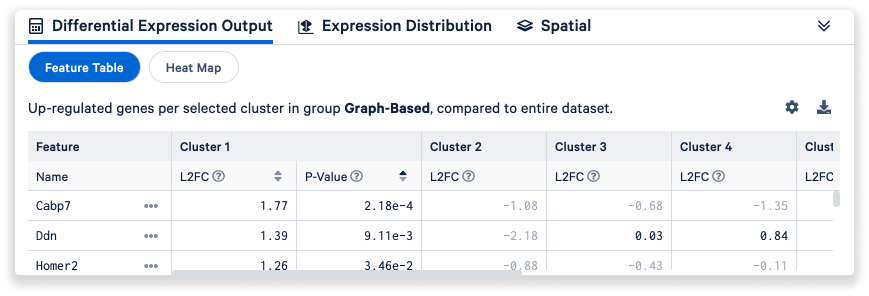
By default, the Data Panel on the bottom of the window shows the Differential Expression Output tab, with the results of differential gene expression (DGE) as a feature table, including Log2 fold change and p-values for each gene and cluster. The results displayed in this feature table will update as you run DGE on different combinations of clusters (see Clusters mode above).
- Click the Settings icon
 to change display values from L2FC to median-normalized average and to hide genes with low average count. You can also toggle the default filter (up-regulated genes per selected cluster) to down-regulated genes, all significant genes, or the current feature list.
 - Click to export the table to CSV.
The DGE results can also be visualized as a heatmap.
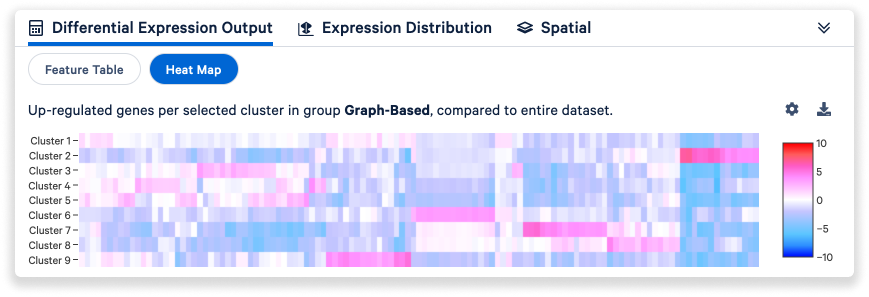
- Click the Settings icon to change how features are filtered and to hide genes with low average count.
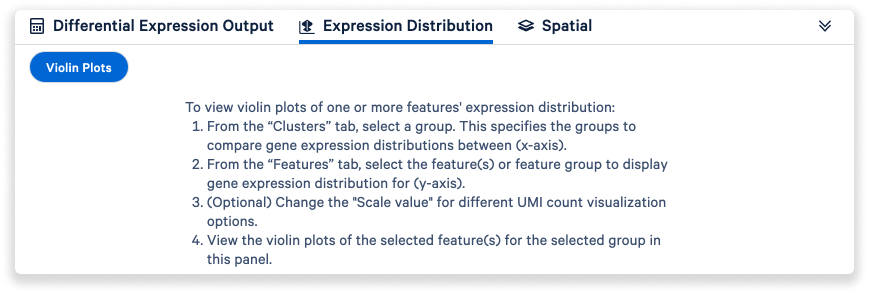
The Expression Distribution tab allows users to access violin plots.
Finally, the Spatial tab enables users to access spatial enrichment and spot deconvolution results.
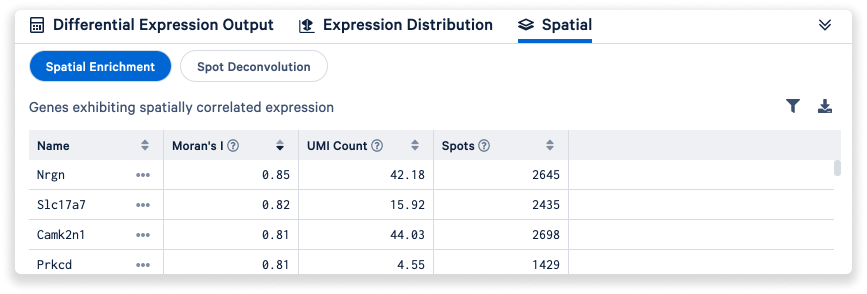
- You can filter the spatial enrichment table
 based on the Moran's I statistic.
 - Click to export the table to CSV.
For more ideas on how you can analyze your Visium data in Loupe Browser, see the following tutorials: