Cloud Analysis enables cell type annotation for standard Cell Ranger and Cell Ranger ARC outputs to generate accurate cell type labels. Two annotation models are available: a 10x Genomics cloud-based model and the Pan-Human Azimuth model. For human samples, the Pan-Human Azimuth model is run automatically in addition to the cloud-based model. The cell annotation models are currently under beta development.
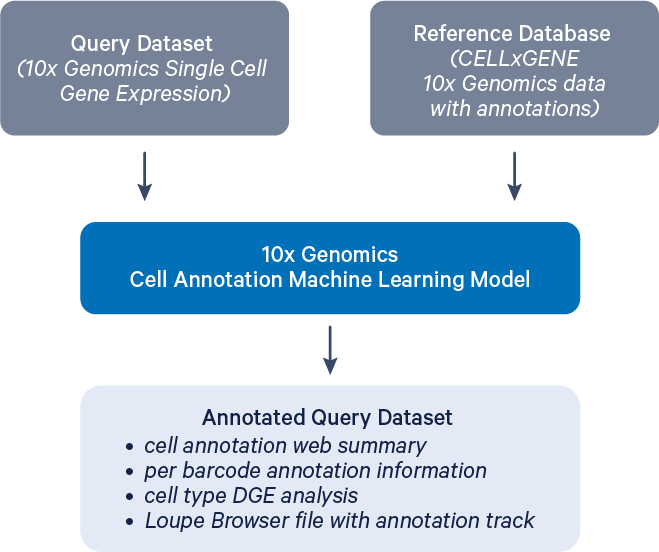
This example shows how to run the annotate pipeline and outlines the expected output files using a publicly available dataset.
- A successfully completed run of standard Cell Ranger (
count,multi,aggr) or Cell Ranger ARC (count,aggr) pipelines on Cloud Analysis, with a dataset that includes a Gene Expression library. These pipelines must be run in Cloud Analysis, as you cannot begin by uploading Cell Ranger or Cell Ranger ARC outputs to the 10x Cloud. - A
.cloupefile will only be generated if secondary analysis is enabled during the initial run. - The sample must be human (or human-derived) or mouse (or mouse-derived).
- The analysis supports datasets ranging from 100 to 800,000 cells.
- The availability of automated cell annotation is subject to restrictions based on U.S. or local laws and regulations. See regional restrictions for the list of impacted regions.
- Go to the Analysis tab in the web interface and select the analysis you wish to annotate.
- Click the "Run Cell Type Annotation" button to start setting up.
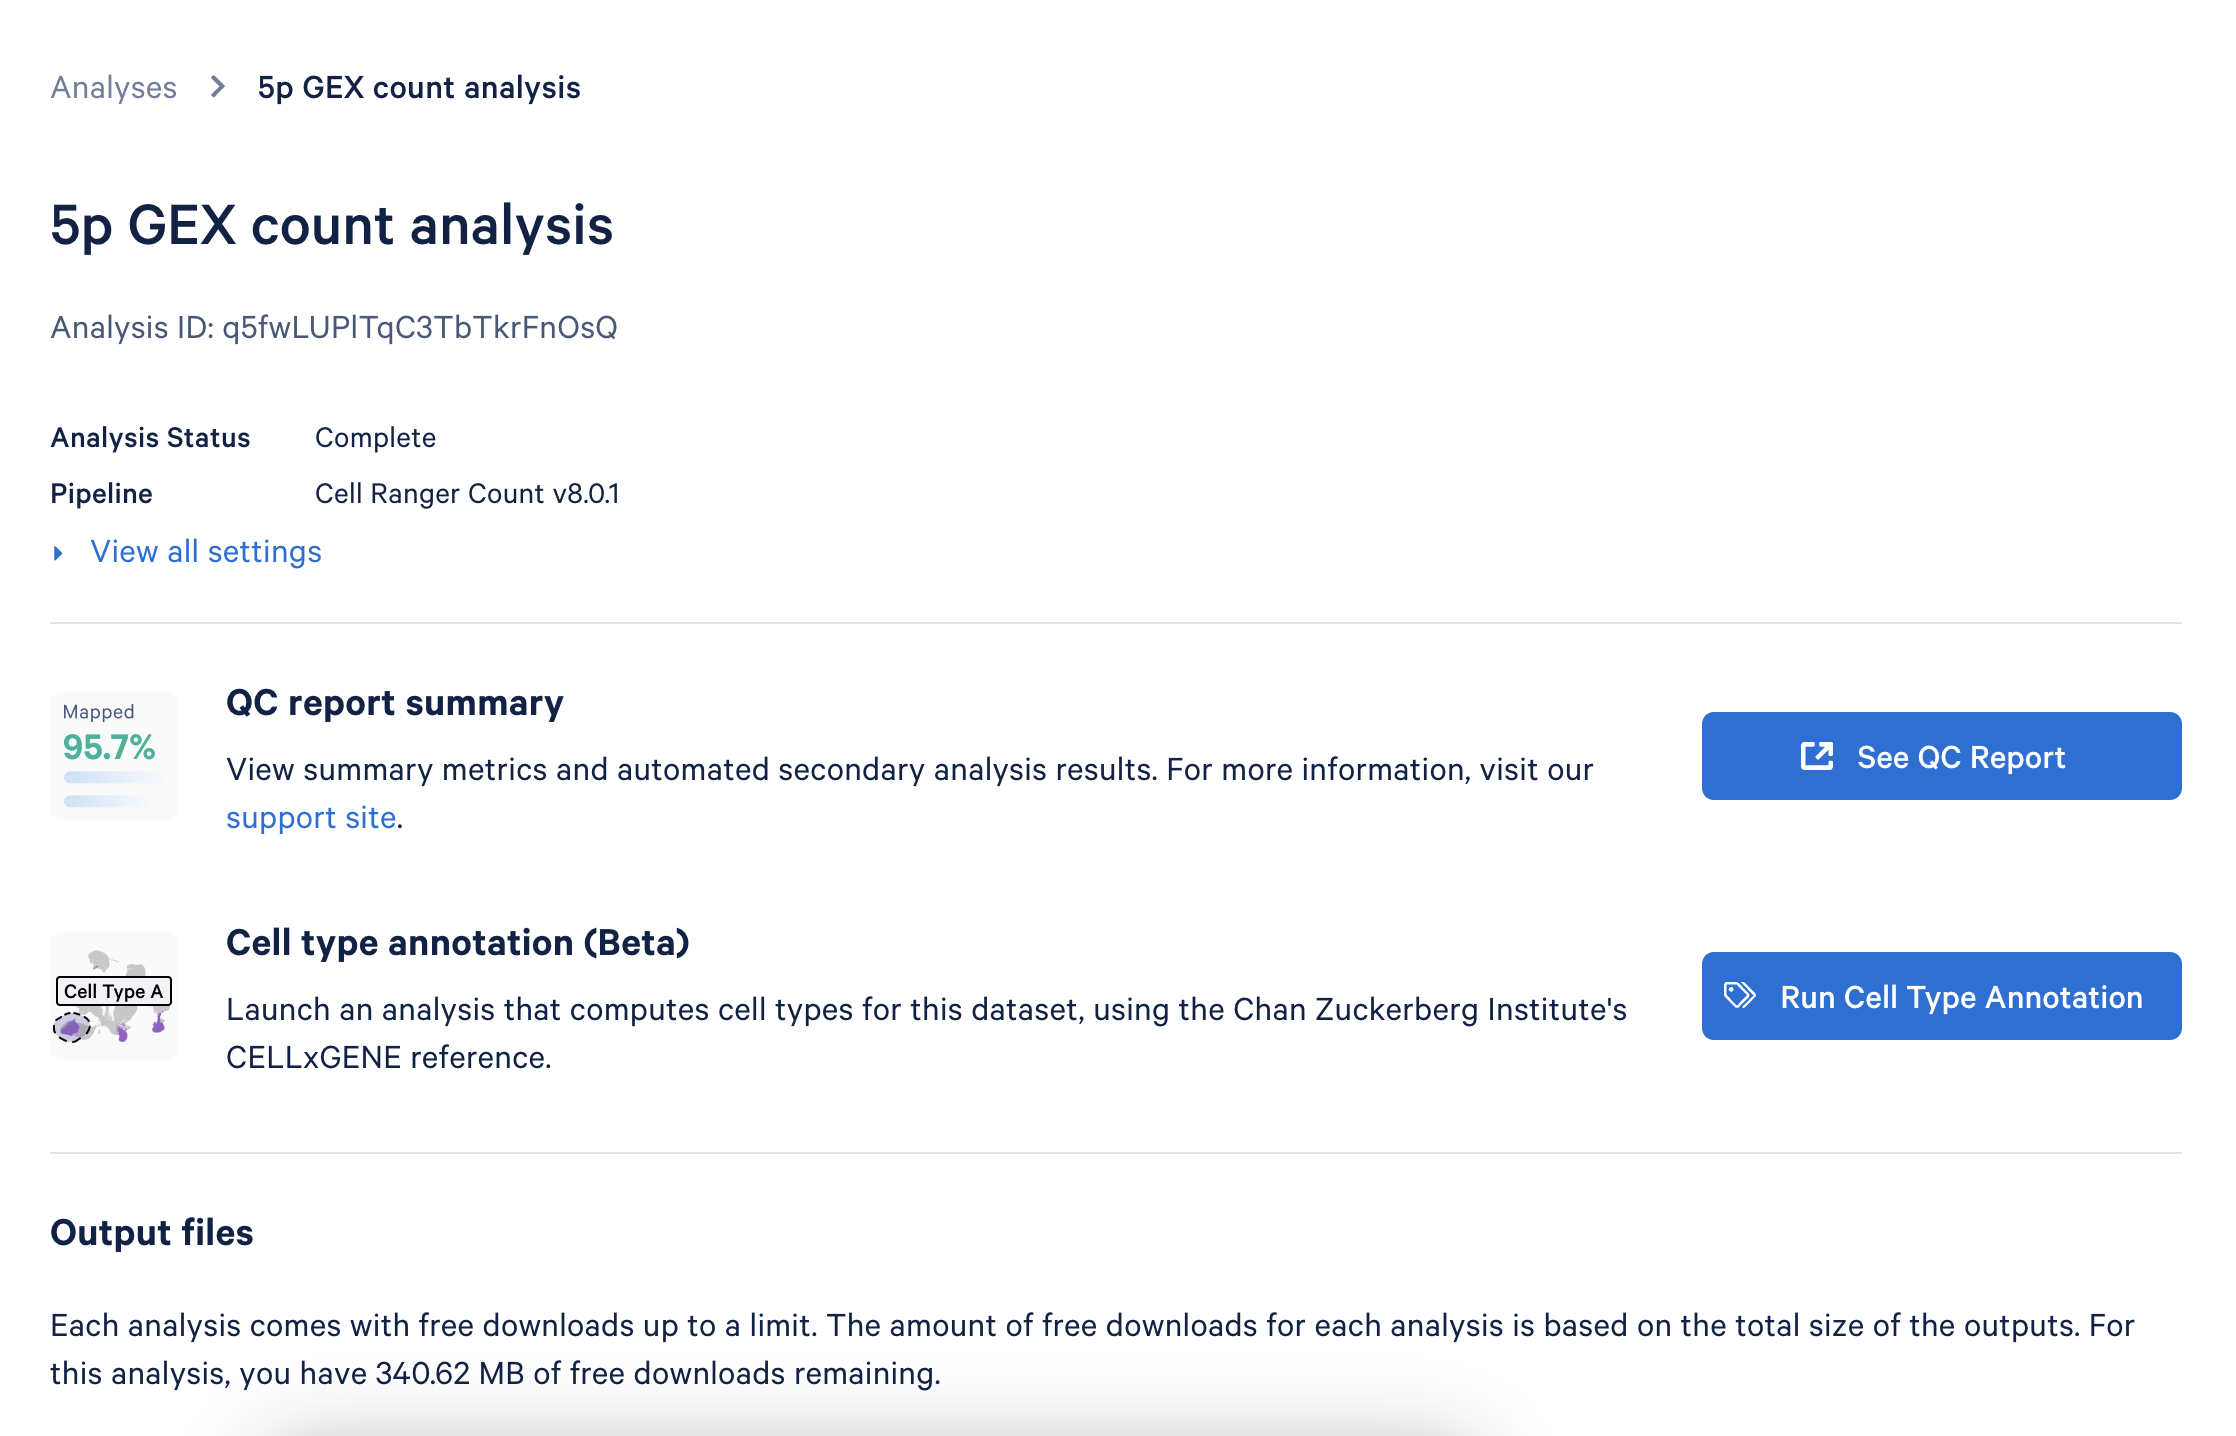
This will take you to the annotation setup page:
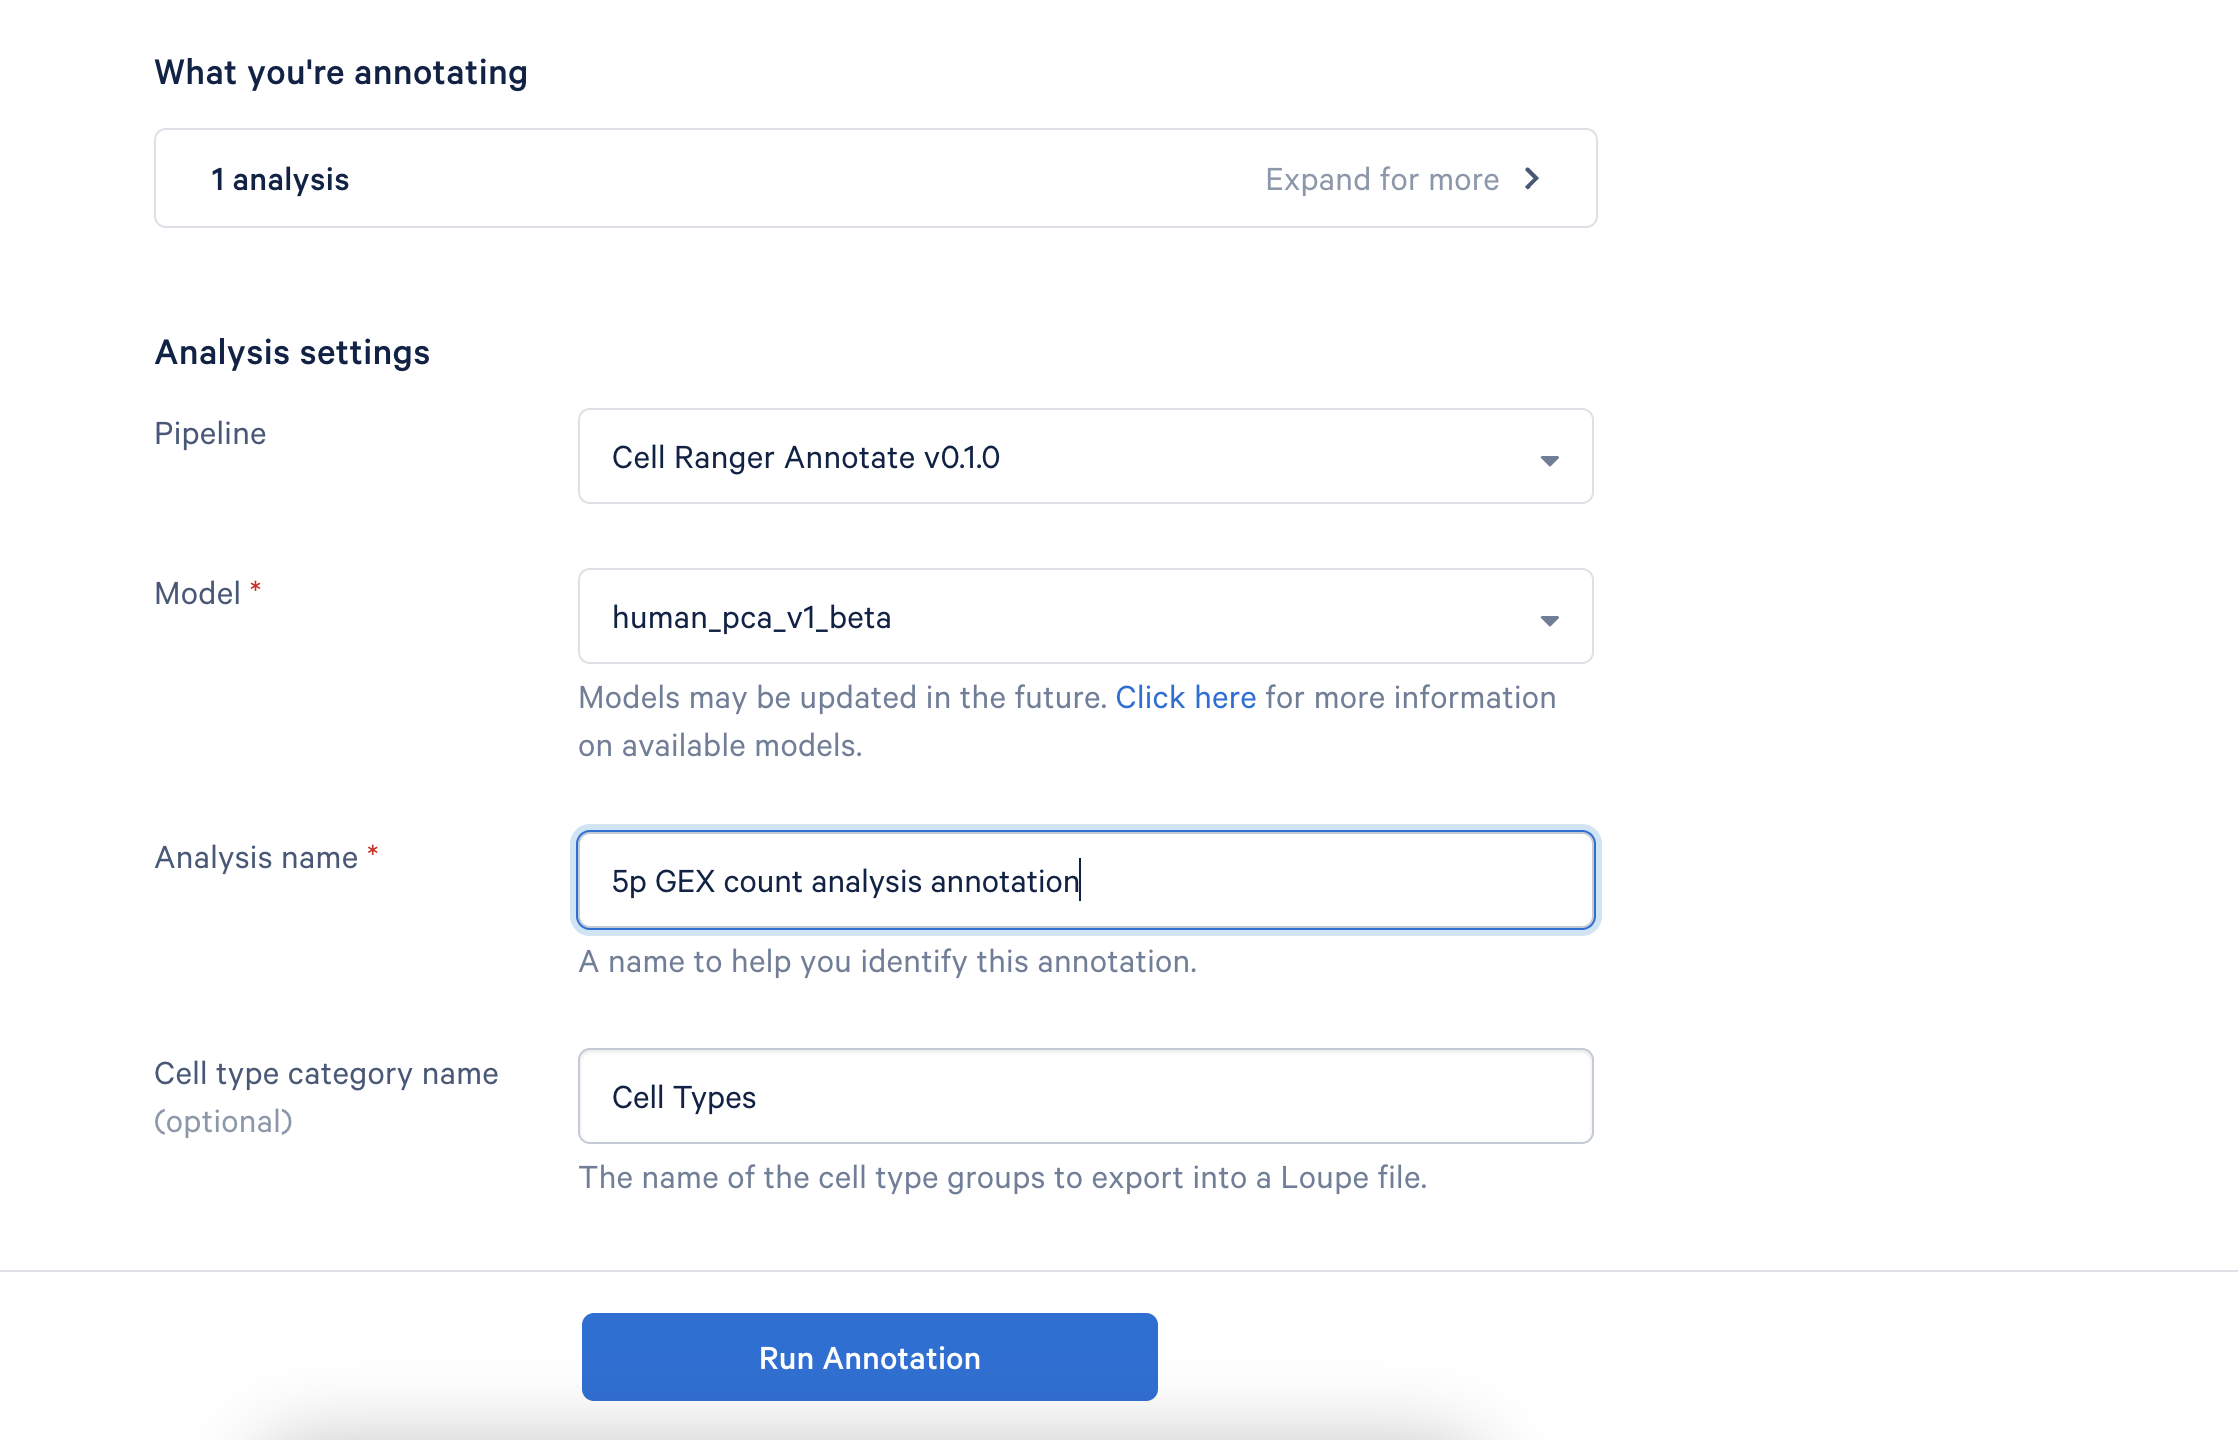
- Provide a descriptive name for your analysis to help you easily identify it later.
- If desired, you can rename the "Cell Type Category" that appears in Loupe Browser.
- There are no tunable parameters in the cell annotation algorithm at this time.
- For human samples, the Pan-Human Azimuth model is run automatically in addition to the 10x Genomics cloud-based model.
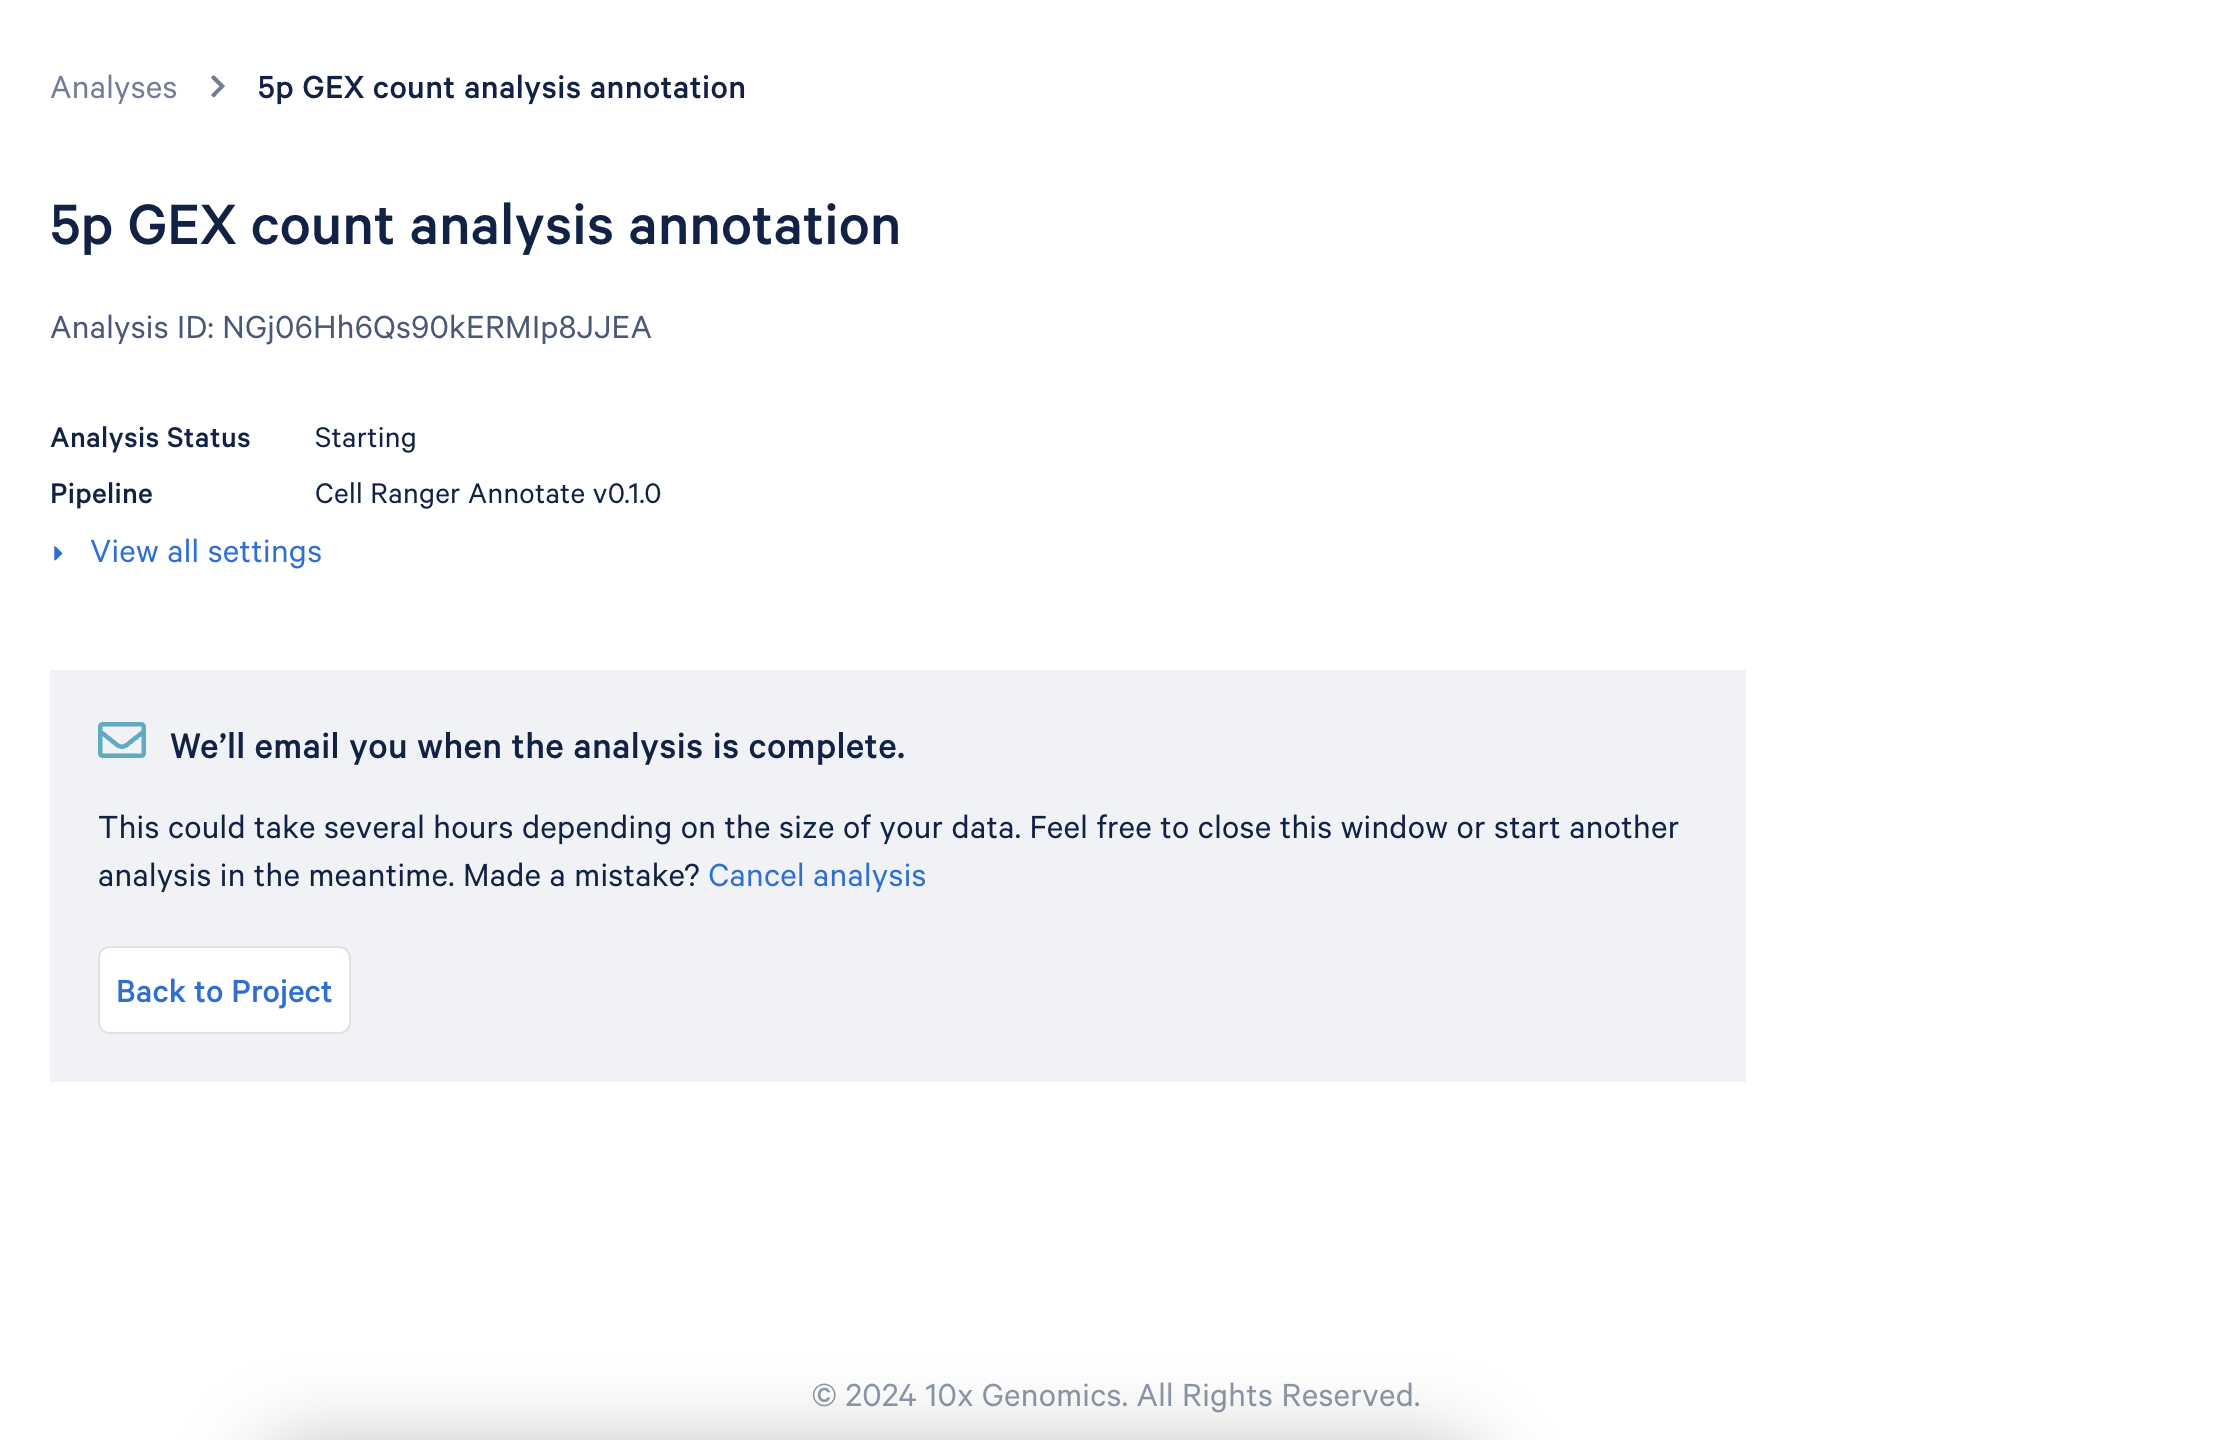
- Click "Run Annotation" to begin the process. You will receive an email notification once the analysis is complete.
The following output files are provided from the annotation pipeline. Annotation outputs are written to a cell_types directory, organized into a subfolder per annotation model: Azimuth for the Pan-Human Azimuth model and 10x_Cloud for the cloud-based model. The cell_annotation_results.json.gz file is produced only by the cloud-based model, so it appears in 10x_Cloud but not Azimuth. Detailed descriptions of the output file contents are available on the Cell Ranger support website.
outs/
├── cell_annotation_sample_cloupe.cloupe
├── cell_types
│ ├── 10x_Cloud
│ │ ├── cell_annotation_differential_expression.csv
│ │ ├── cell_annotation_results.json.gz
│ │ └── cell_types.csv
│ └── Azimuth
│ ├── cell_annotation_differential_expression.csv
│ └── cell_types.csv
├── web_summary.html
| Downloaded file name | Description |
|---|---|
web_summary.html | View high-level cell types, metrics, and distribution. |
cell_annotation_sample_cloupe.cloupe | The Loupe Browser file from the original analysis, annotated with high-level cell types. Generated only when a .cloupe file is available (secondary analysis enabled during the initial run). |
cell_annotation_results.json.gz | Detailed evidence of how each cell has been assigned a cell type by the algorithm, broken down by dataset IDs in the reference database and nearest-neighbors in each. Cloud-based model only (10x_Cloud subfolder). |
cell_types.csv | A CSV file listing coarse and fine cell types for each cell. |
cell_annotation_differential_expression.csv | Table listing genes that are differentially expressed in each detected cell type, along with log2 fold-change and associated p-value. |