This page describes the high-level algorithms underlying the processing and analysis steps that occur on the Atera Instrument.
The Atera Gene Expression workflow begins with sample preparation. Fresh frozen (FF) or formalin-fixed paraffin-embedded (FFPE) samples are mounted on slides. The samples are fixed and permeabilized (FF samples) or deparaffinized and decrosslinked (FFPE samples). Then, probe hybridization, ligation, and rolling circle amplification (RCA) are performed following the steps in the assay user guide.
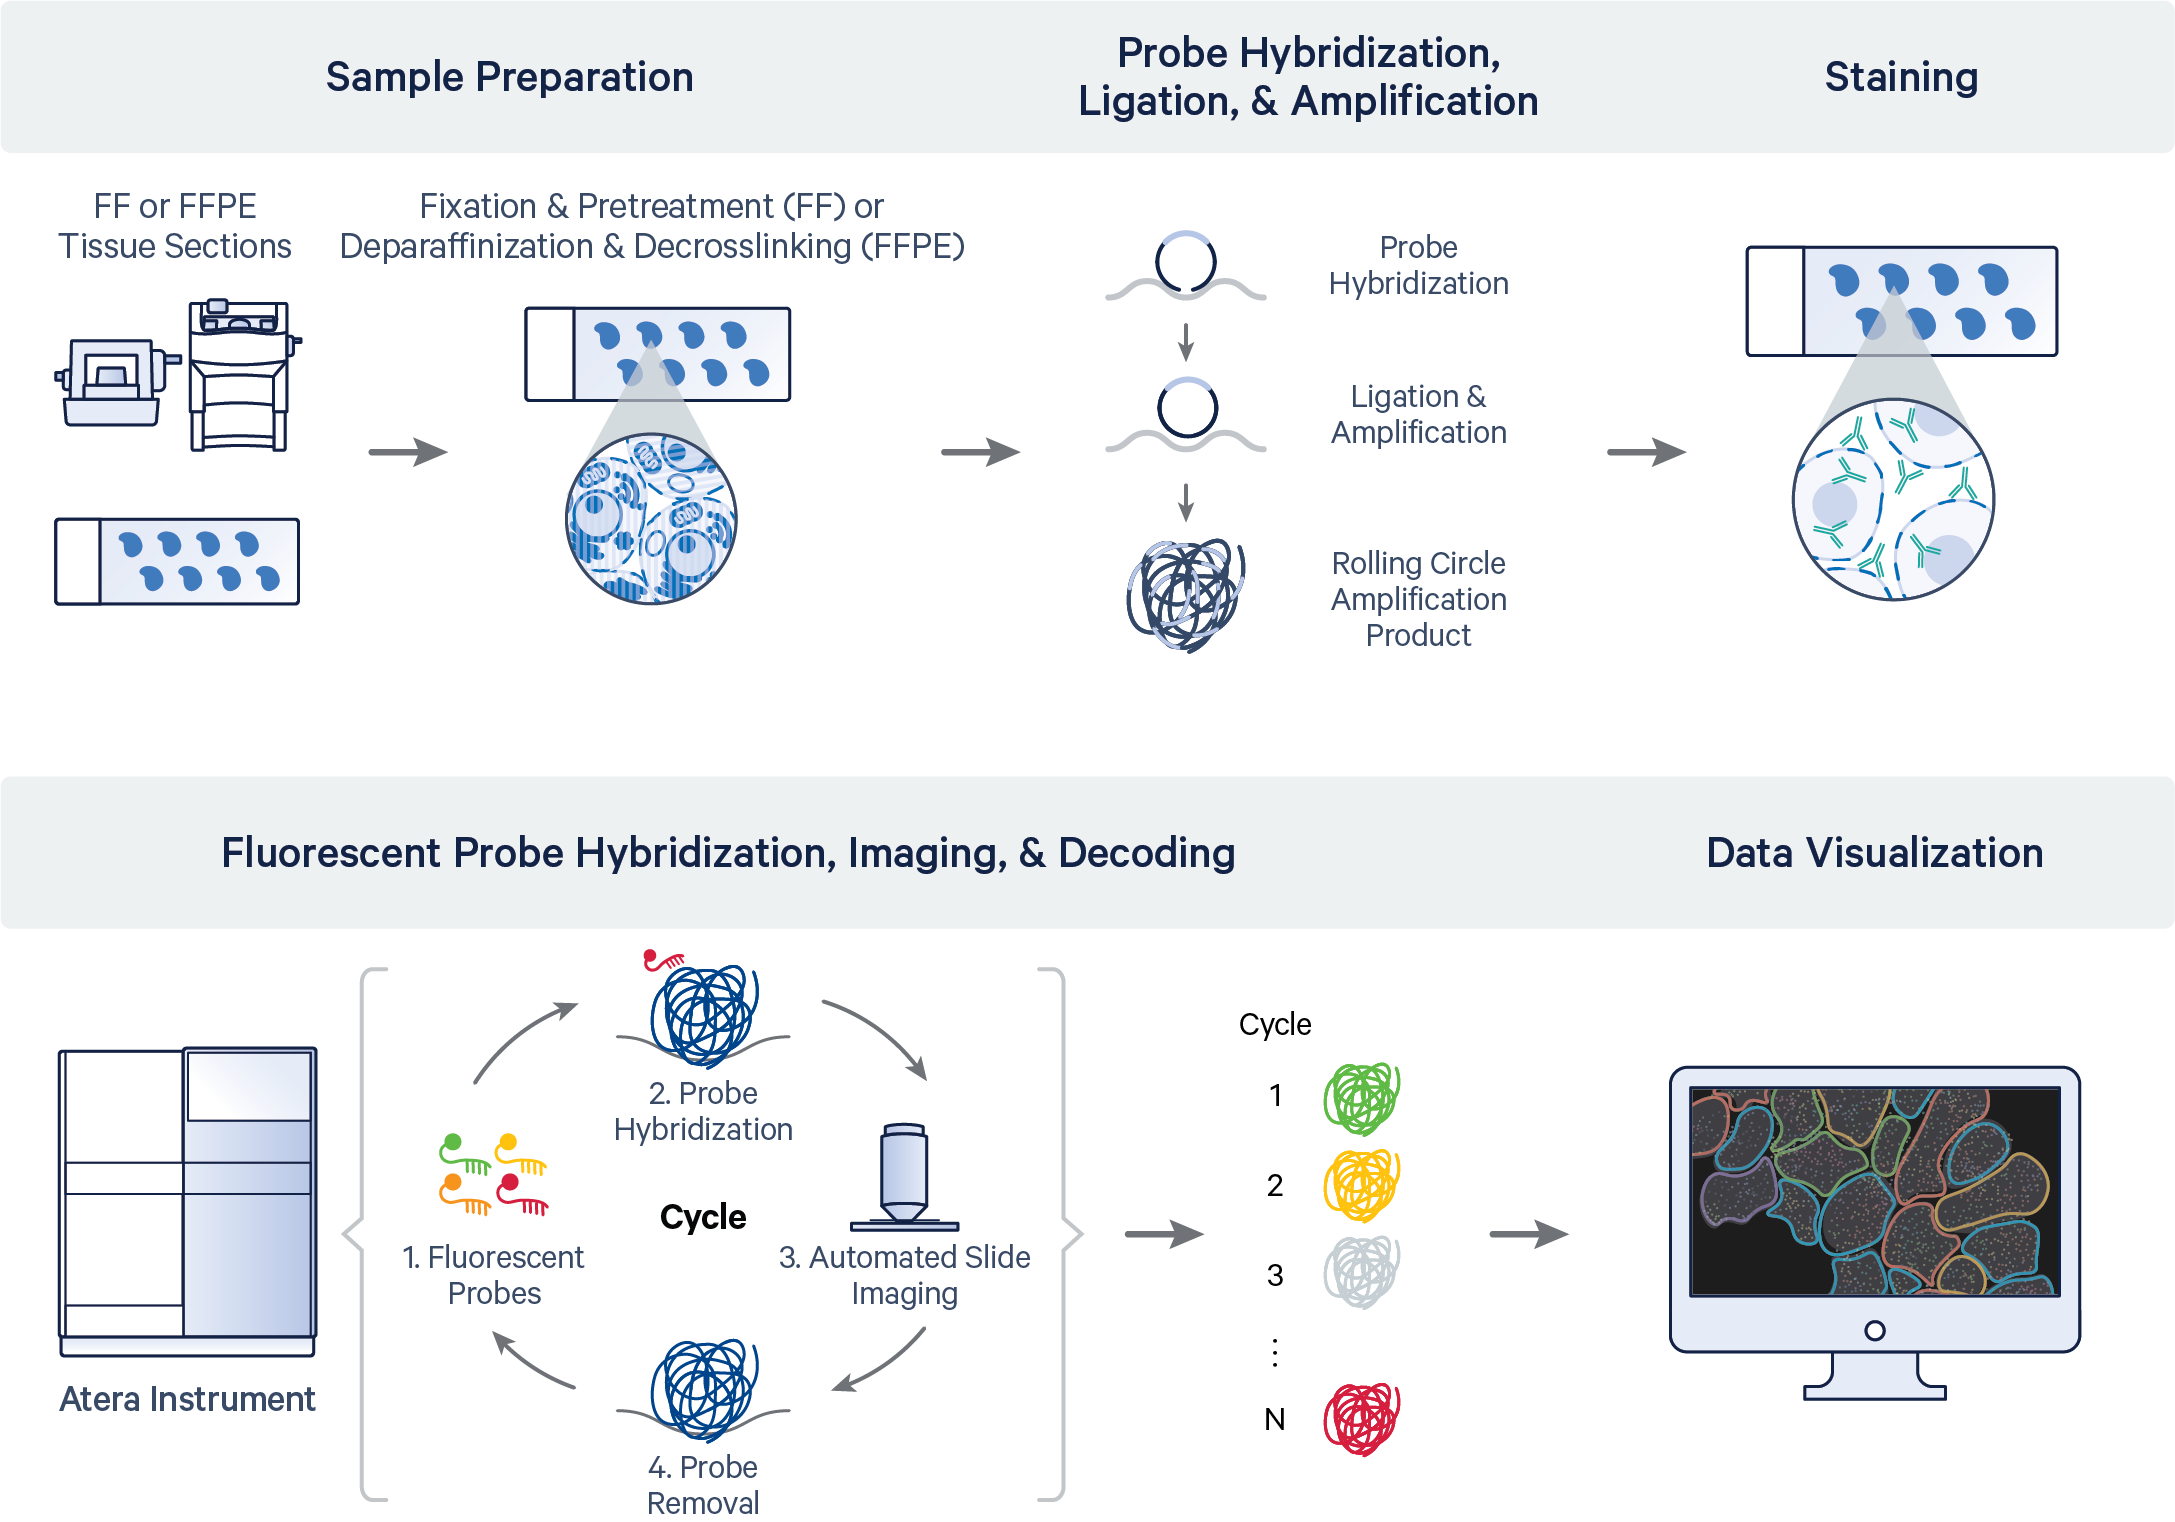
Once the sample has been prepared, imaging is performed in cycles for multiple fluorescence channels on the Atera Instrument. In parallel, real-time data processing occurs on the fields of view (FOVs) to build a spatial map of the transcripts across the region of interest (ROI).
The Atera panel codebooks are imaged and processed in sections, or blocks. When one block of imaging completes, the Atera Instrument can simultaneously begin imaging the next block of codewords, while processing the data from the previous block. This pattern reduces total instrument runtime. All whole-transcriptome (WTA) and multi-codebook panel configurations (i.e., WTA + Panel C, Panel A + Panel C) follow this pattern of parallel imaging and data processing.
The high-level pipeline steps for the workflow are shown below:
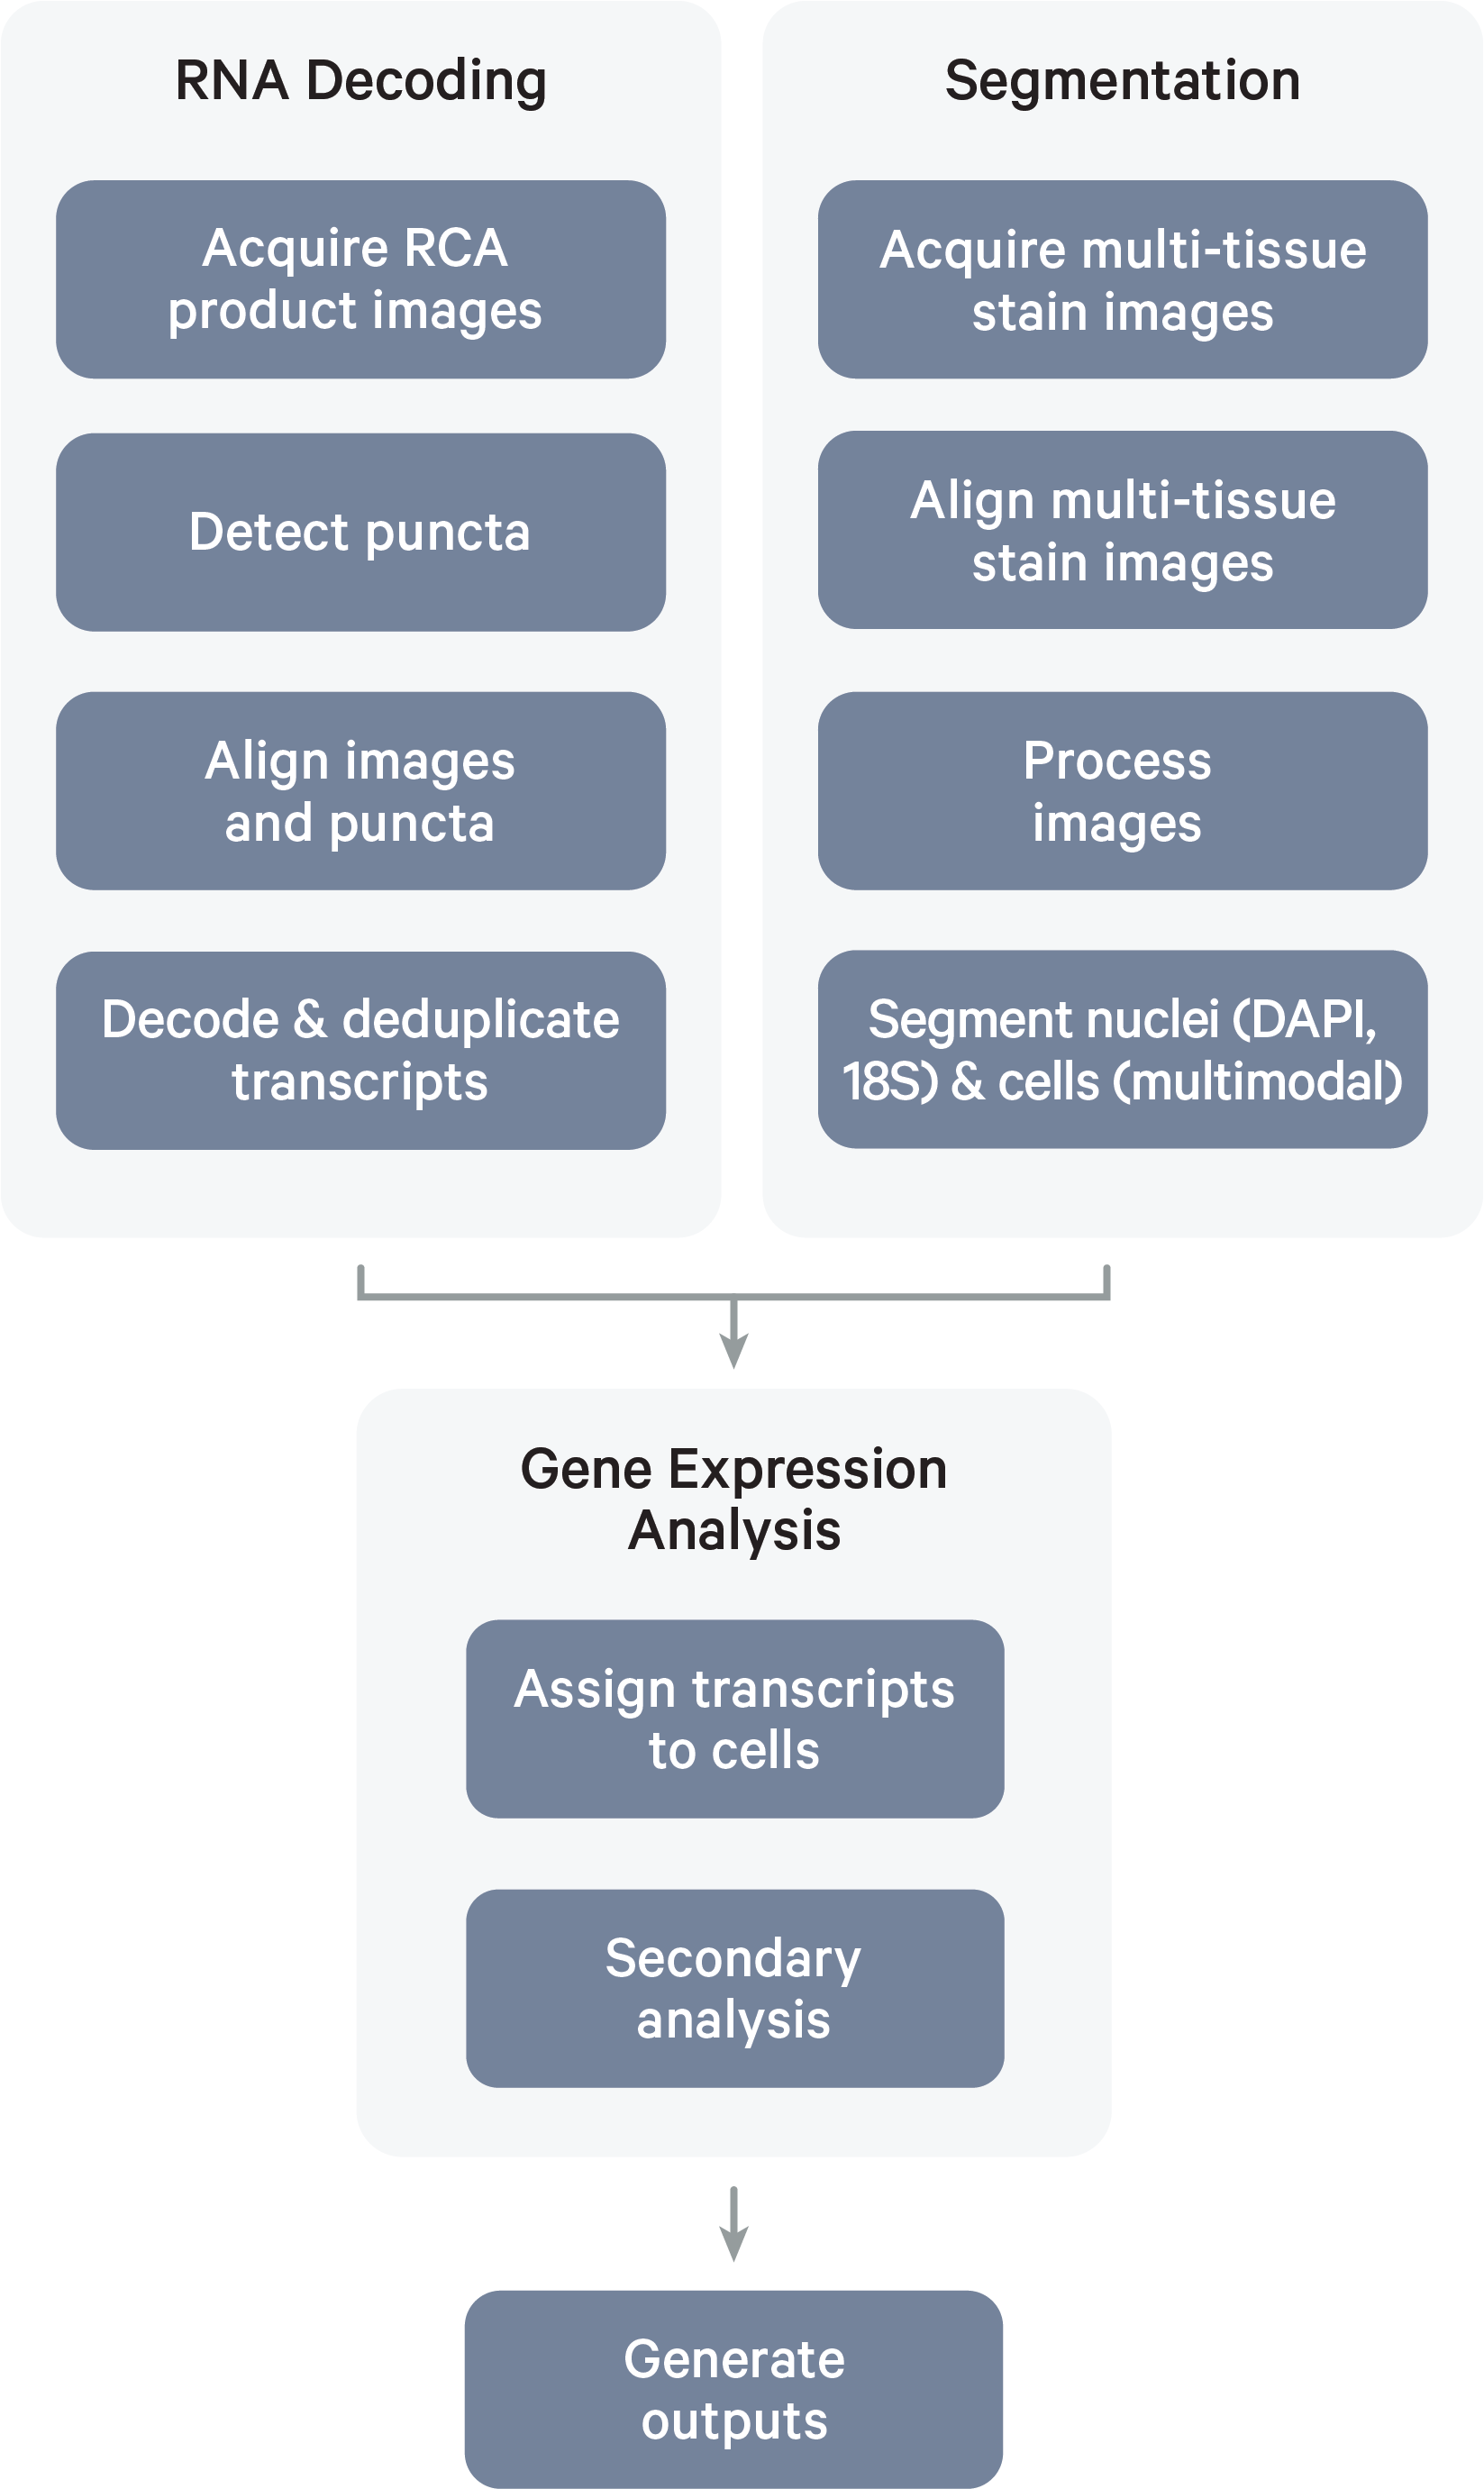
The data processing algorithms operate on these image inputs:
- 3D DAPI morphology image: DAPI is a blue fluorescent DNA stain for visualizing nuclear DNA in fresh and fixed cells. In the Atera workflow, DAPI staining is used to locate nuclei, inform cell segmentation, and produce a 3D tissue morphology image. DAPI images are captured across all FOVs in the first cycle for every block. The 1st cycle image of the instrument run is used for the 3D DAPI output file.
- RCA product images: During each RNA detection cycle, fluorescently labeled probes for detecting RNA target sequences and other reagents are automatically cycled in, imaged, and removed. The internal image sensor captures data across multiple Z-planes with a 0.75 µm step size across the entire tissue thickness for every FOV in the user-selected region of interest (ROI). Punctate fluorescent signals (puncta) are detected and filtered, and image distortion is corrected.
- 2D multi-tissue stain images: The Atera Gene Expression assay contains nucleic acid stains for visualizing the cell nucleus and cytoplasm. The optional Atera Cell Segmentation Staining Reagents kit contains antibodies for cell membrane (boundary) and cell interior. These images, along with the background images, are used for nucleus and cell segmentation algorithms. A background "blank" image is a picture of the tissue with no fluorophores. It may also be referred to as an "autofluorescence" image.
Thus, over the course of a sample instrument run, the Atera Instrument's internal image sensor collects 3D volumes across: 1) multiple FOVs, 2) multiple fluorescence channels, and 3) multiple cycles of chemistry and imaging. This produces petabytes of internal sensor data that are processed efficiently and analyzed across all cycle-channels to decode transcripts and segment cells.
Once transcript decoding and cell segmentation are complete, downstream analysis of Atera raw output data — the spatial map of transcripts — can proceed. The pipeline performs secondary analysis on the cell-feature matrix to generate PCA, UMAP, graph-based clustering, and differential expression analysis results. All of the secondary analysis results are provided in the cell-feature matrix AnnData output file. The differential expression analysis results are also provided in the diff_exp/ directory in CSV format, which could be read by e.g., LLMs for a quick check of annotating clusters.
The Atera Onboard Analysis pipeline performs cell type annotation for human Atera WTA samples using the Pan-human Azimuth model, which was developed by the Satija lab as part of The Human BioMolecular Atlas Program (HuBMAP) (Sarkar et al., 2026). This model is only compatible with human samples.
The first iteration of this model was trained on scRNA-seq and snRNA-seq data from 23 different tissues. Cancer datasets were excluded from the training process. Cell types are organized into a unified cell ontology. For model details and updates, see the Pan-human Azimuth page from the Satija lab.
Atera Onboard Analysis is a fully integrated data processing pipeline operating in real-time on the instrument. Intermediate images are not retained on the instrument after data processing and generation of the final output files (commonly referred to as the "output bundle").
See the data archive page for details about the raw data files to archive.