Choose a product below to filter the page content to your needs:
The cellranger multi pipeline outputs an interactive web_summary.html file that contains summary metrics and automated secondary analysis results.
For Fixed RNA Profiling experiments, the web summary provides metrics and plots for singleplex (e.g., 10k human K562-r cells) or multiplex (e.g., 40k mixture of dissociated tumor cells from four donors) Gene Expression and Antibody Capture libraries.
If an issue was detected during the pipeline run, an alert appears on this page (see also the Cell Ranger troubleshooting documentation). The web_summary.html file is a good starting point for quality assessment for experiments analyzed with cellranger multi.
The cellranger multi pipeline’s web summary has three views:
- Cells: Provides metrics, analysis, and visualization of data from 10x Barcodes that were called as cells from a sample (multiplexed samples will each have their own web summary html).
- Library: Provides metrics, analysis, and visualization of data from all cell and non-cell (background) 10x Barcodes in each library generated in the experiment. If the data are from a multiplexed experiment, the library view will contain cells assigned to the different samples in the experiment. The metrics and plots will be the same for all sample web summaries in a multiplex experiment.
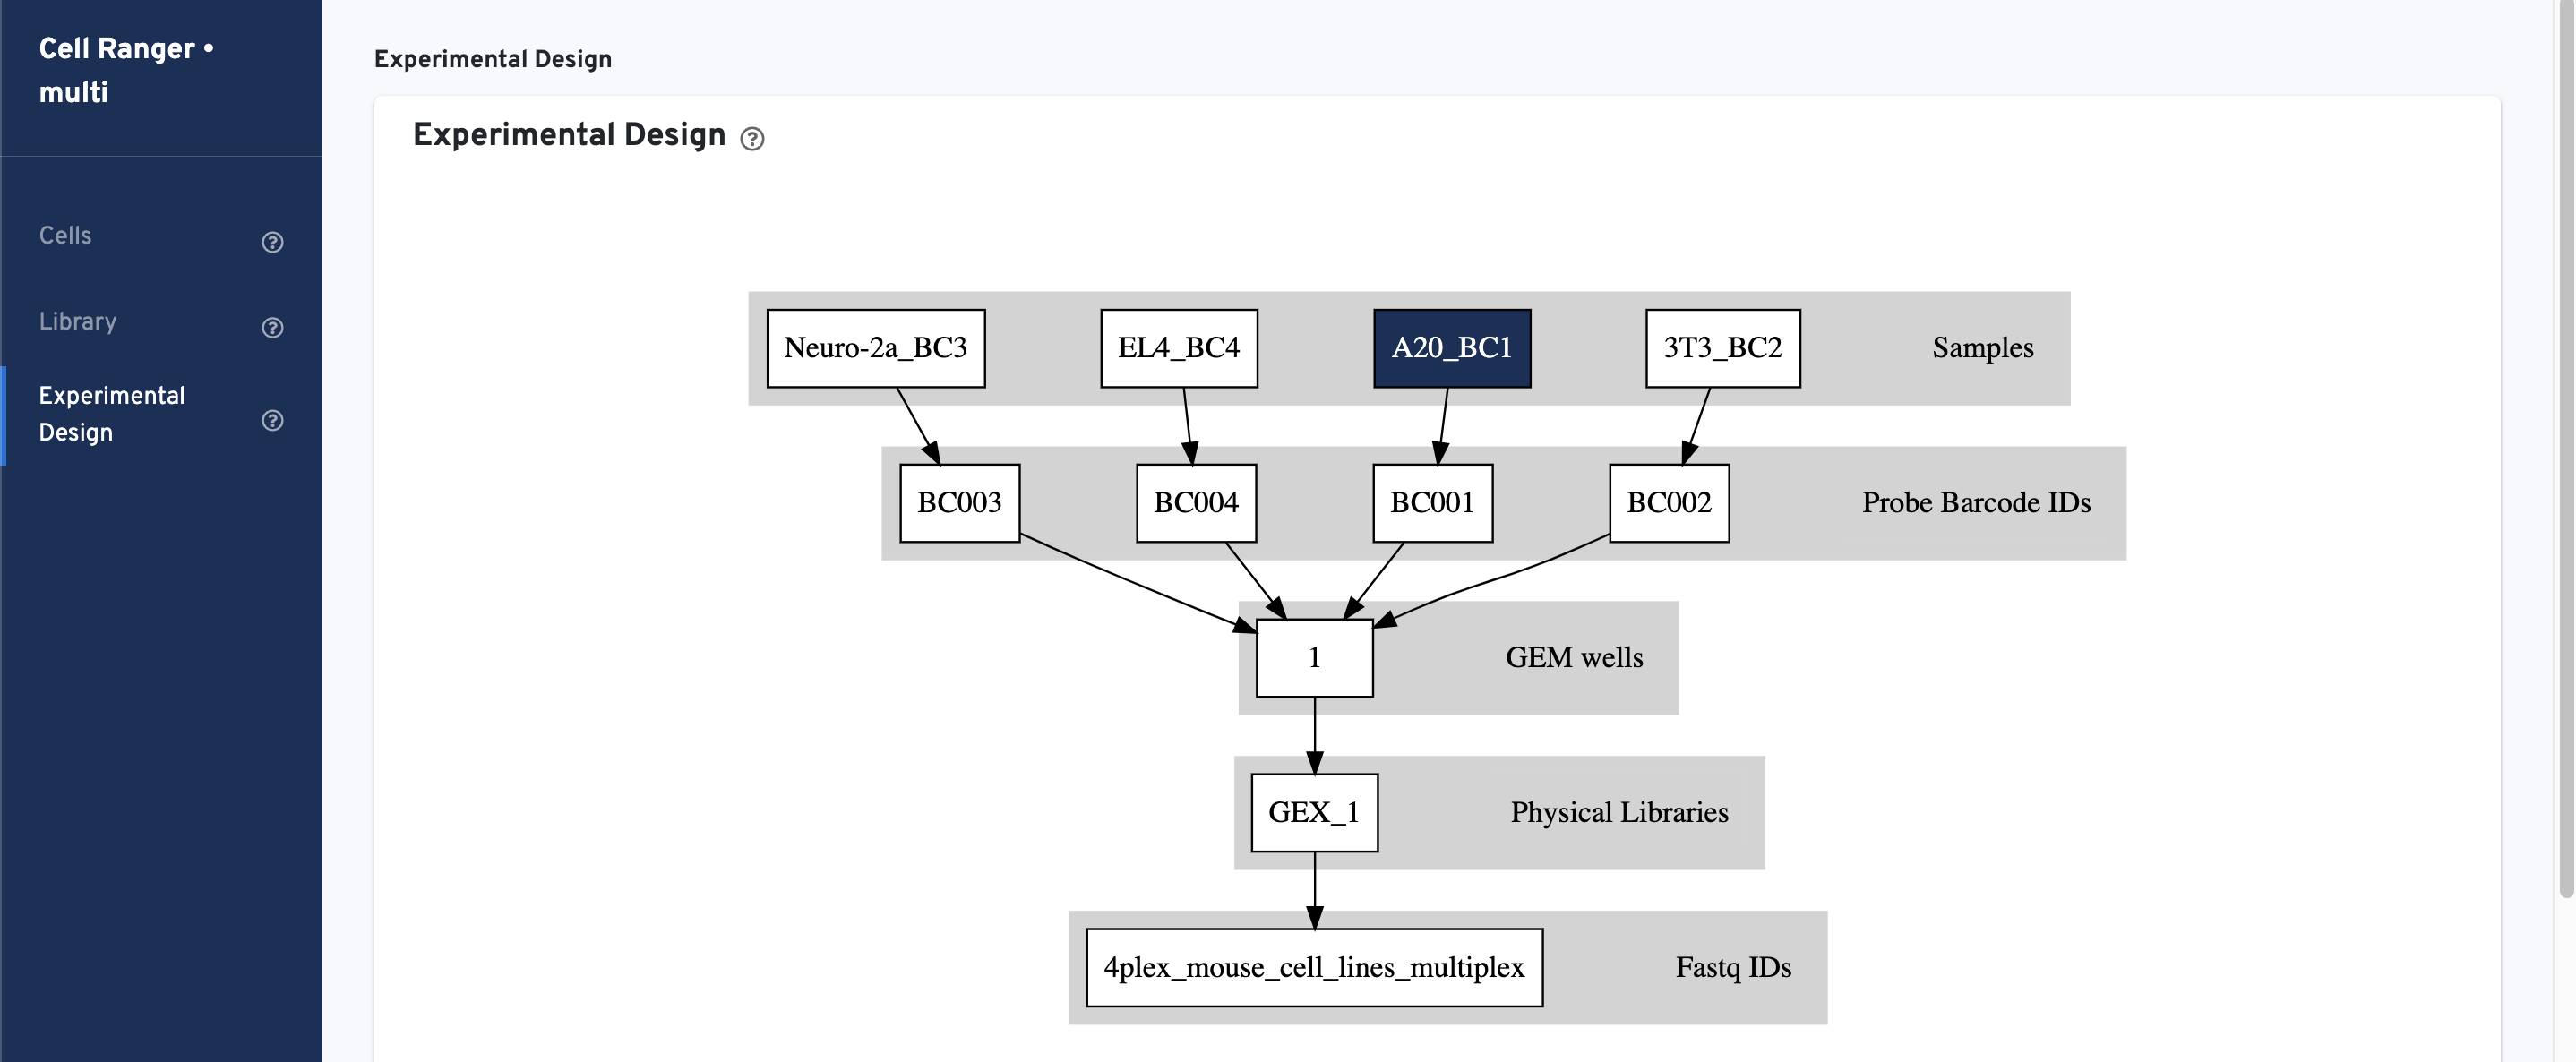
- Experimental Design: Provides a visualization of the experimental design as inferred by Cell Ranger based on the multi config CSV file provided by the user.
The Experimental Design view has the same layout for all assay types. Click the question mark ? symbol to read descriptions for each section and metric.
This view enables one to visualize the experimental design for the dataset, as interpreted by Cell Ranger. This is an example for a multiplexed Fixed RNA Profiling experiment:
The input multi config CSV file is also displayed to help with troubleshooting:

For Gene Expression (GEX) libraries, there will be a "Gene Expression" tab on both the Cells and Library views. Singleplex and multiplex GEX libraries share many of the same metric tables and plots. The metric tables and plots listed below are only relevant for samples from multiplexed experiments; they are not present for singleplex:
| View | Metric or plot |
|---|---|
| Cells | "Cell Multiplexing" table, "Mapping Metrics (Amongst Reads From Cells Assigned To Sample)", "UMIs from genomic DNA" metrics, "GEX Barcode Rank Plot", "Median Genes per Cell" plot |
| Library | "Metrics per probe barcode" table |
Below is an example of the Cells and Library view metrics and plots for Fixed RNA Profiling for Multiplexed Samples experiment Gene Expression library.
Starting with the Cell view, note key metadata at the top of the summary, such as the reagent chemistry, transcriptome version, and reference path.
The Cells table contains the most important hero metrics for the sample.

The Cell Multiplexing table contains metrics specific to FRP multiplexed experiments for the sample, and the Mapping Metrics table contains metrics quantifying how well reads were mapped to the reference for the sample. This view will also report genomic DNA metrics for a specific sample. Click the question mark ? to read full descriptions for each one.

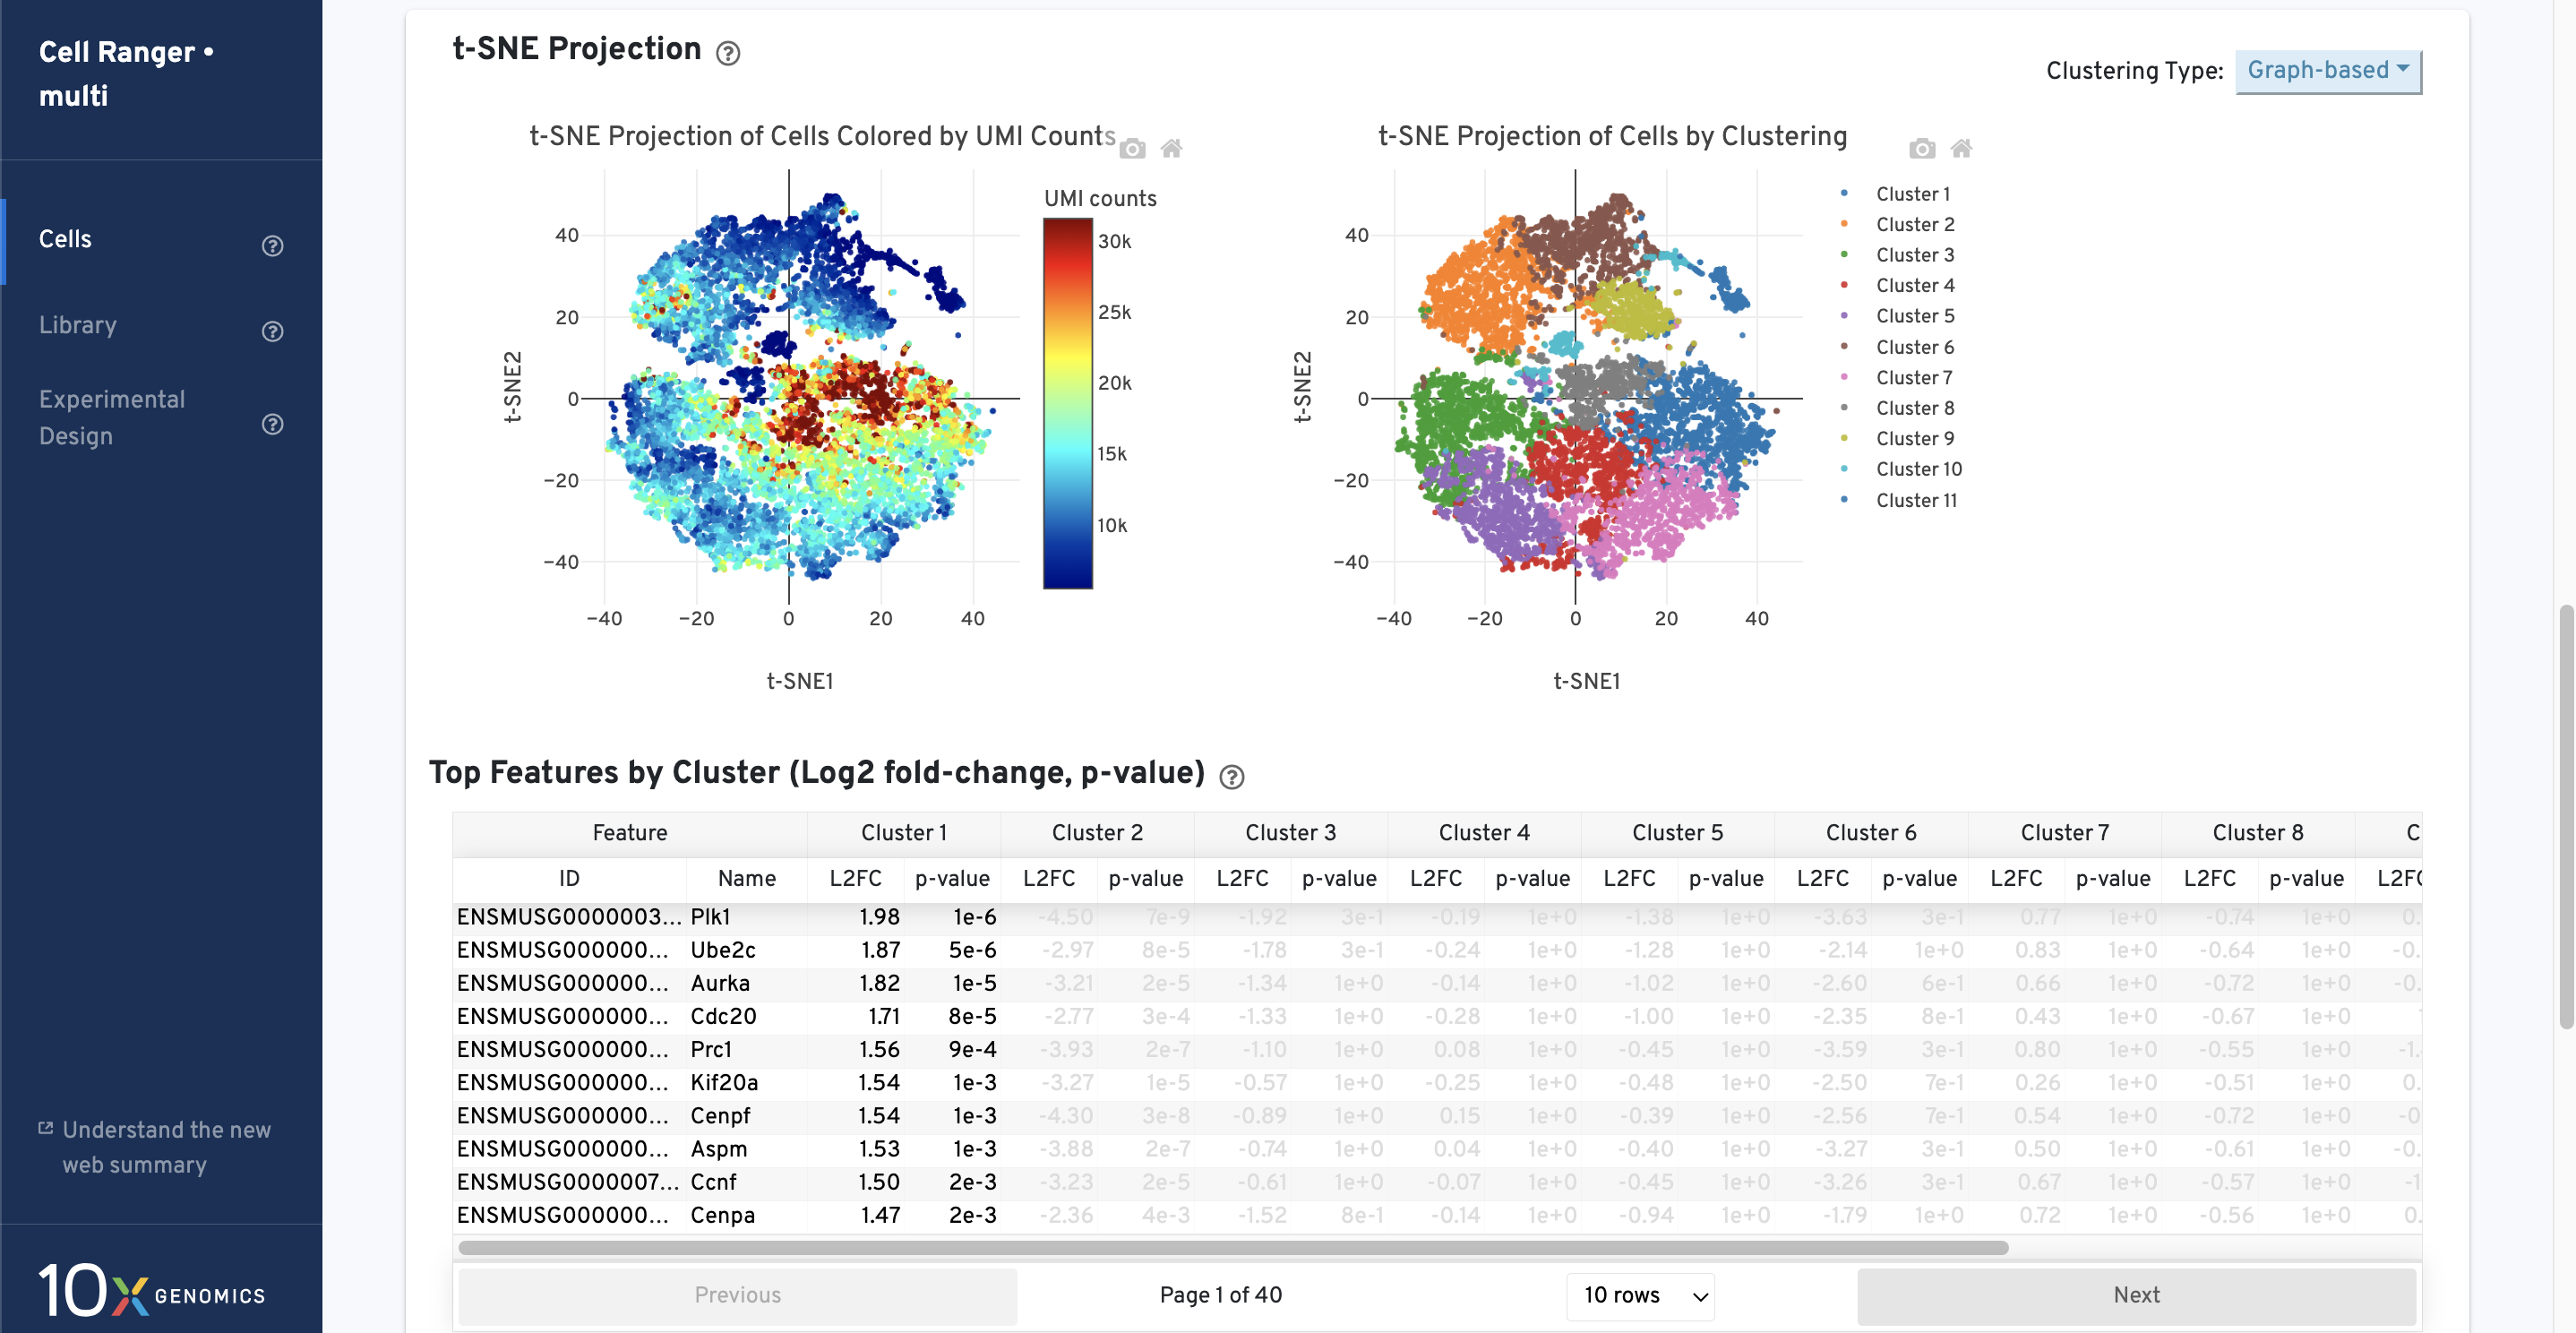
Secondary analysis:
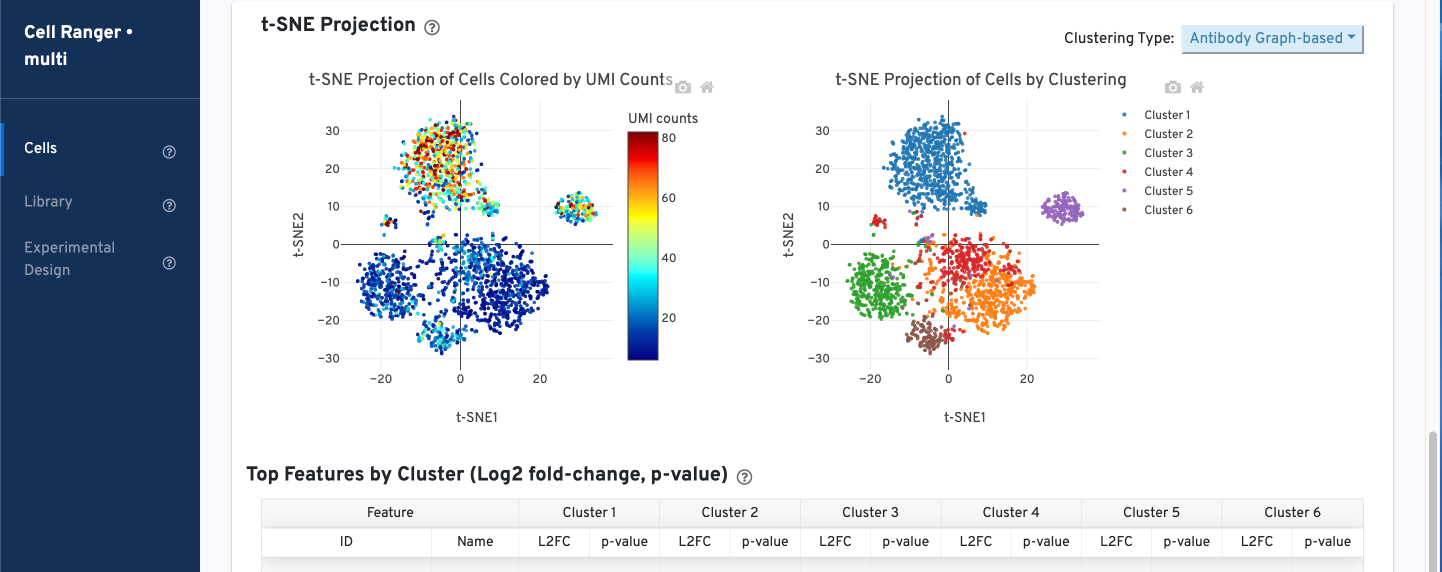
- The t-SNE Projection section shows the data reduced to two dimensions, colored by UMI count or clustering (Graph-based by default). It is a good starting point to explore structure in the data.
- The Top Features by Cluster table shows the results of a differential gene expression analysis among clusters (Graph-based clusters by default). Click the question mark
?to read full descriptions for each one.
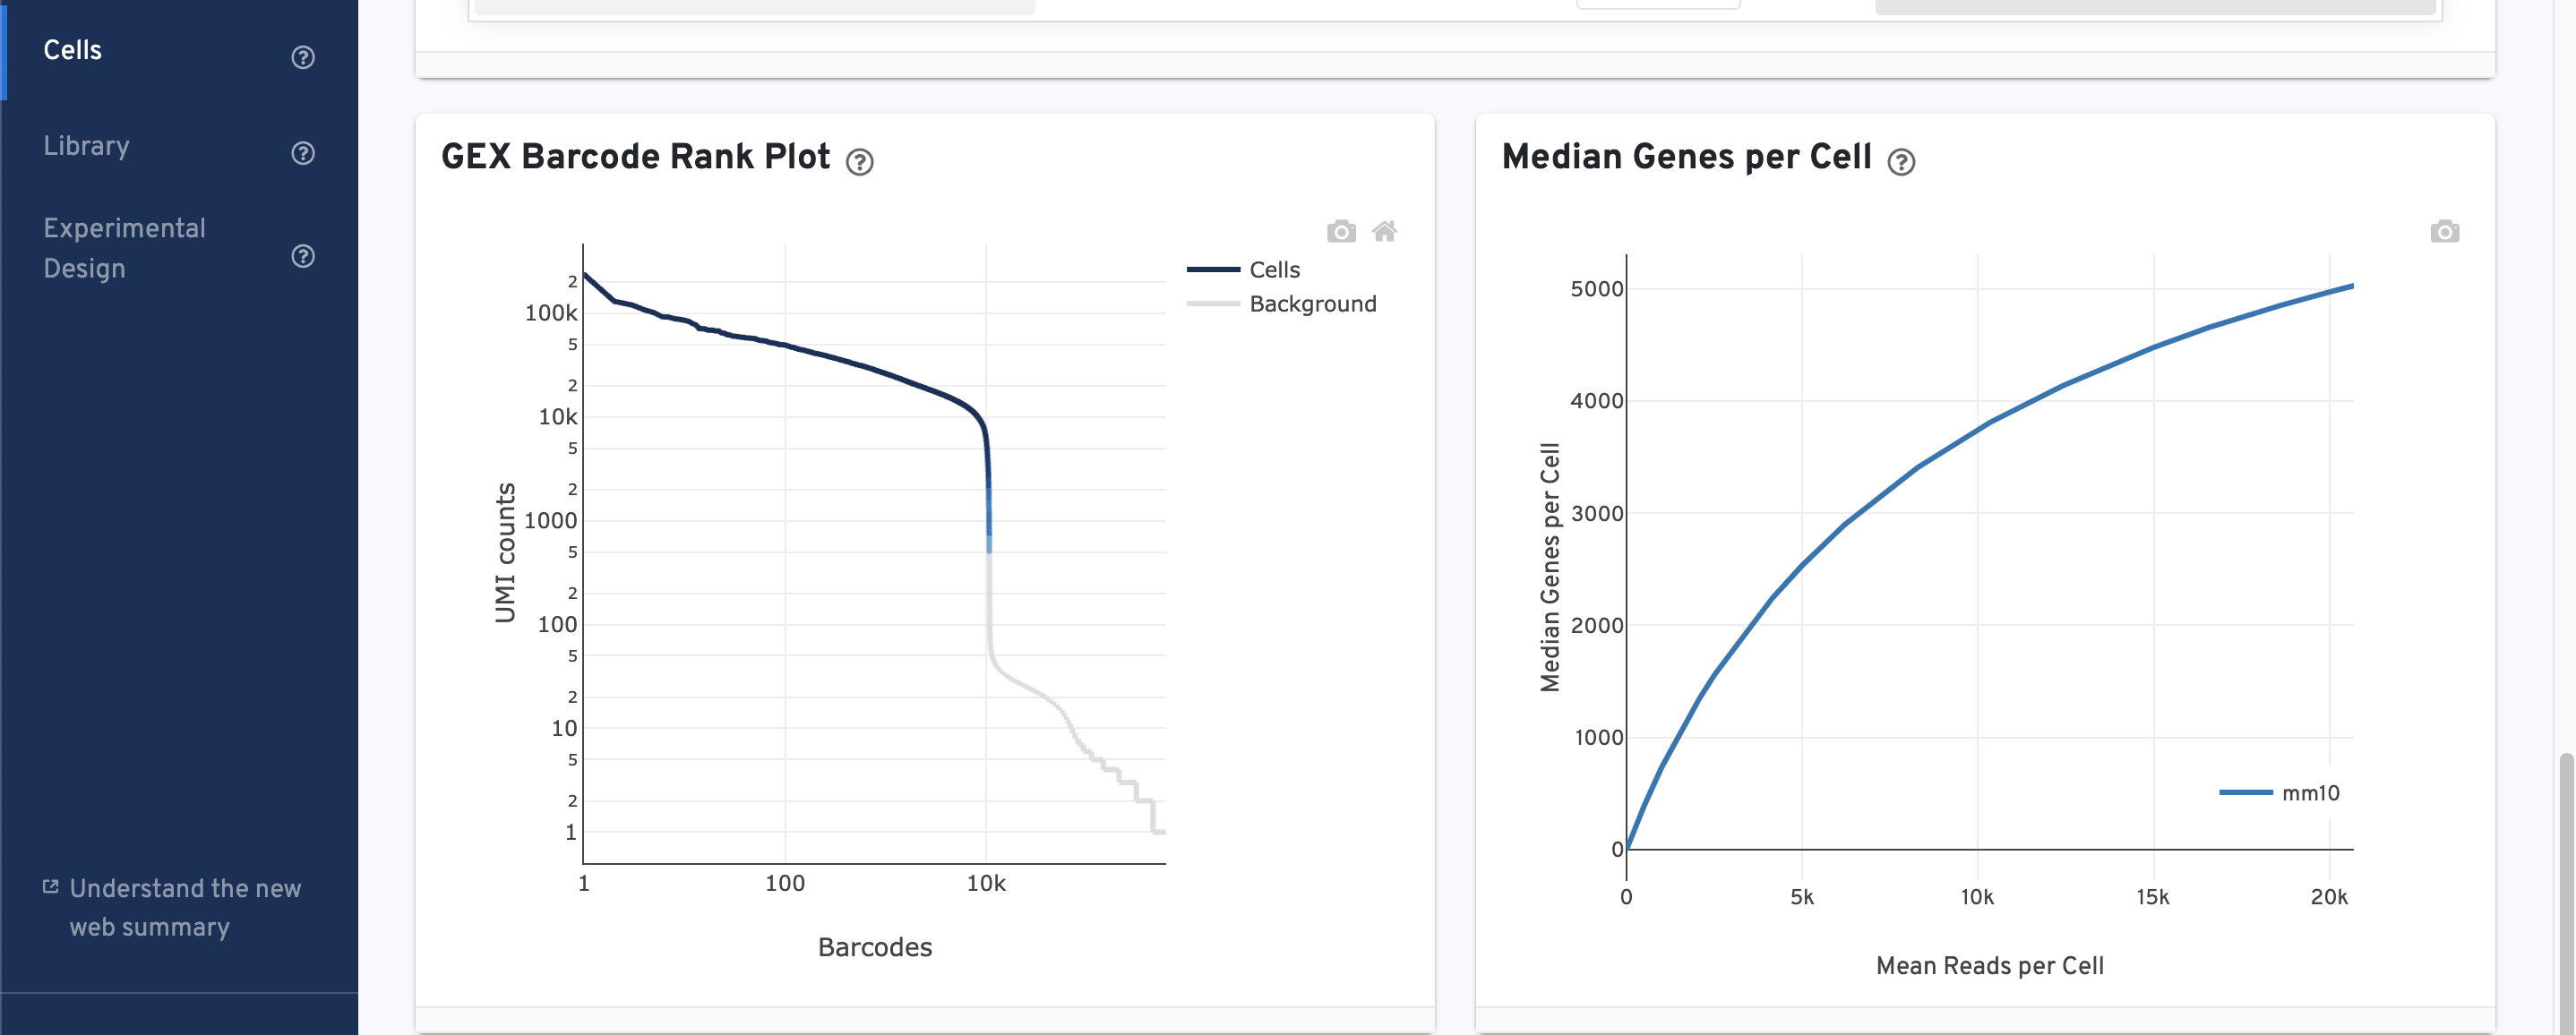
- The GEX Barcode Rank Plot shows the count of filtered UMIs mapped to each barcode for the sample. Read this Guided Tour of the Barcode Rank Plot for more details on its use and interpretation.
- The Median Genes per Cell plot shows the Median Genes per Cell as a function of downsampled sequencing depth in mean reads per cell, up to the observed sequencing depth for the sample.
The Cell Statistics table displays the most important results of the experiment. Additional metrics are displayed in the Sequencing Metrics, Mapping Metrics, and Metrics per Physical Library tables below. Click the question mark ? to read full descriptions for each one.
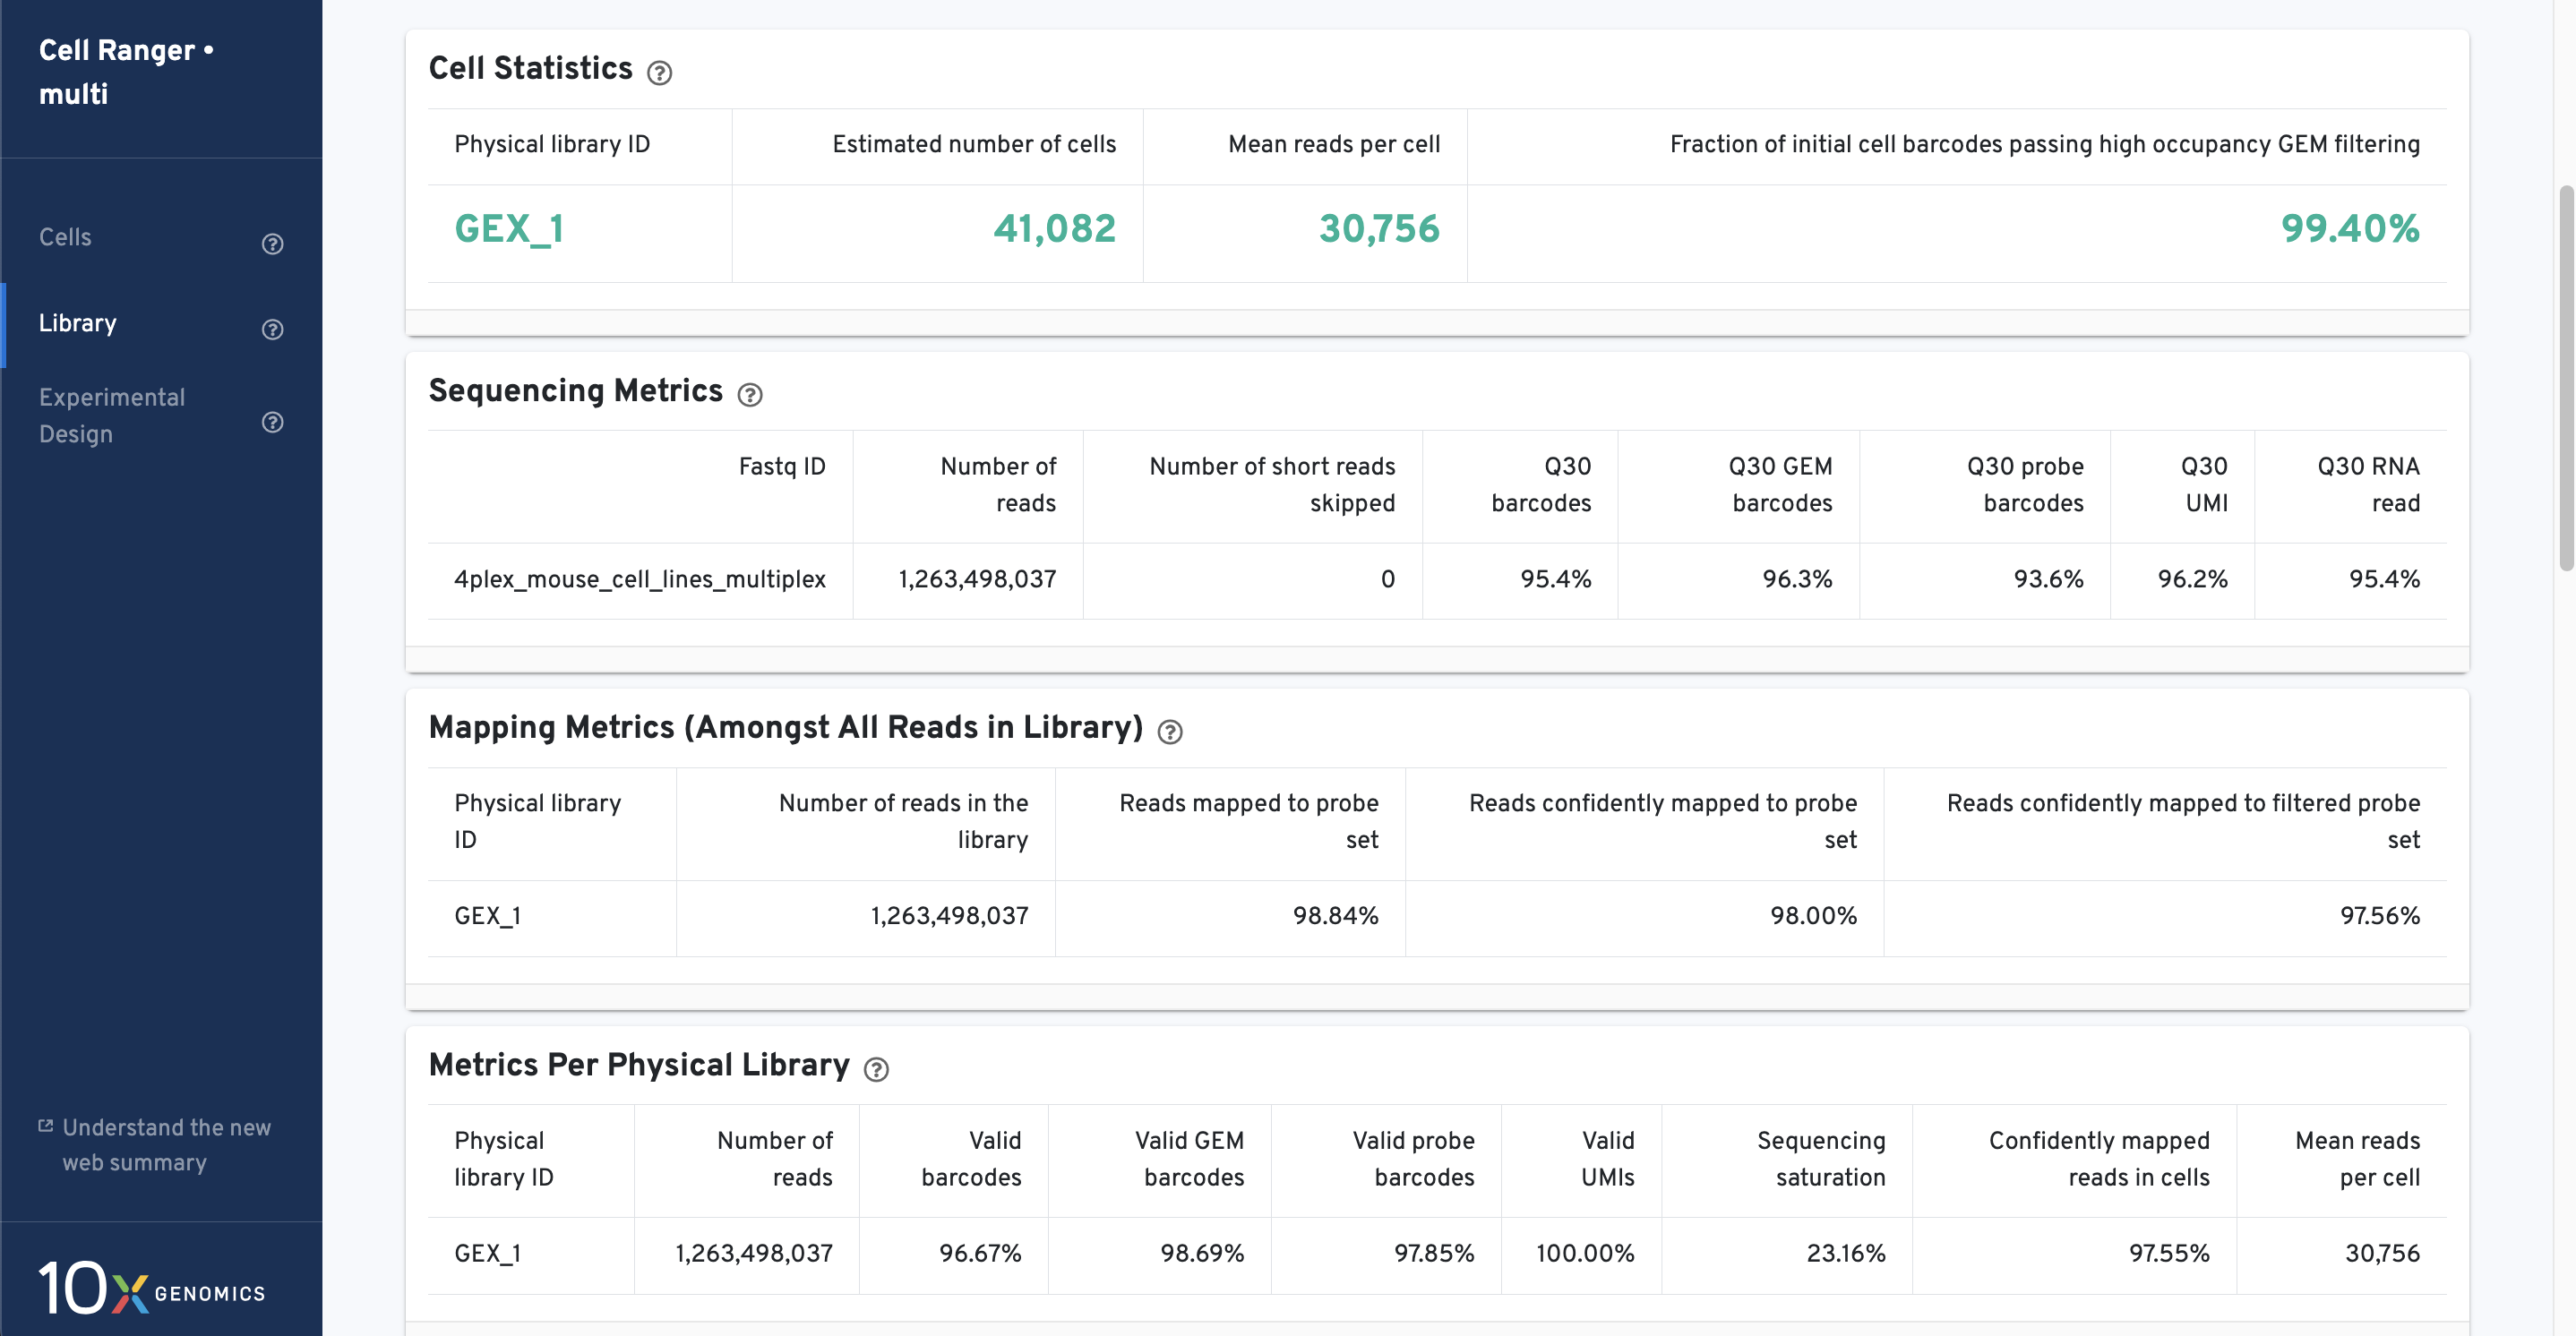
For Fixed RNA Profiling experiments, "valid barcodes" refer to the 10x GEM Barcode, "valid GEM barcodes" refer to the cell barcode (10x GEM Barcode + Probe Barcode), and "valid probe barcodes" refer to the Probe Barcode.
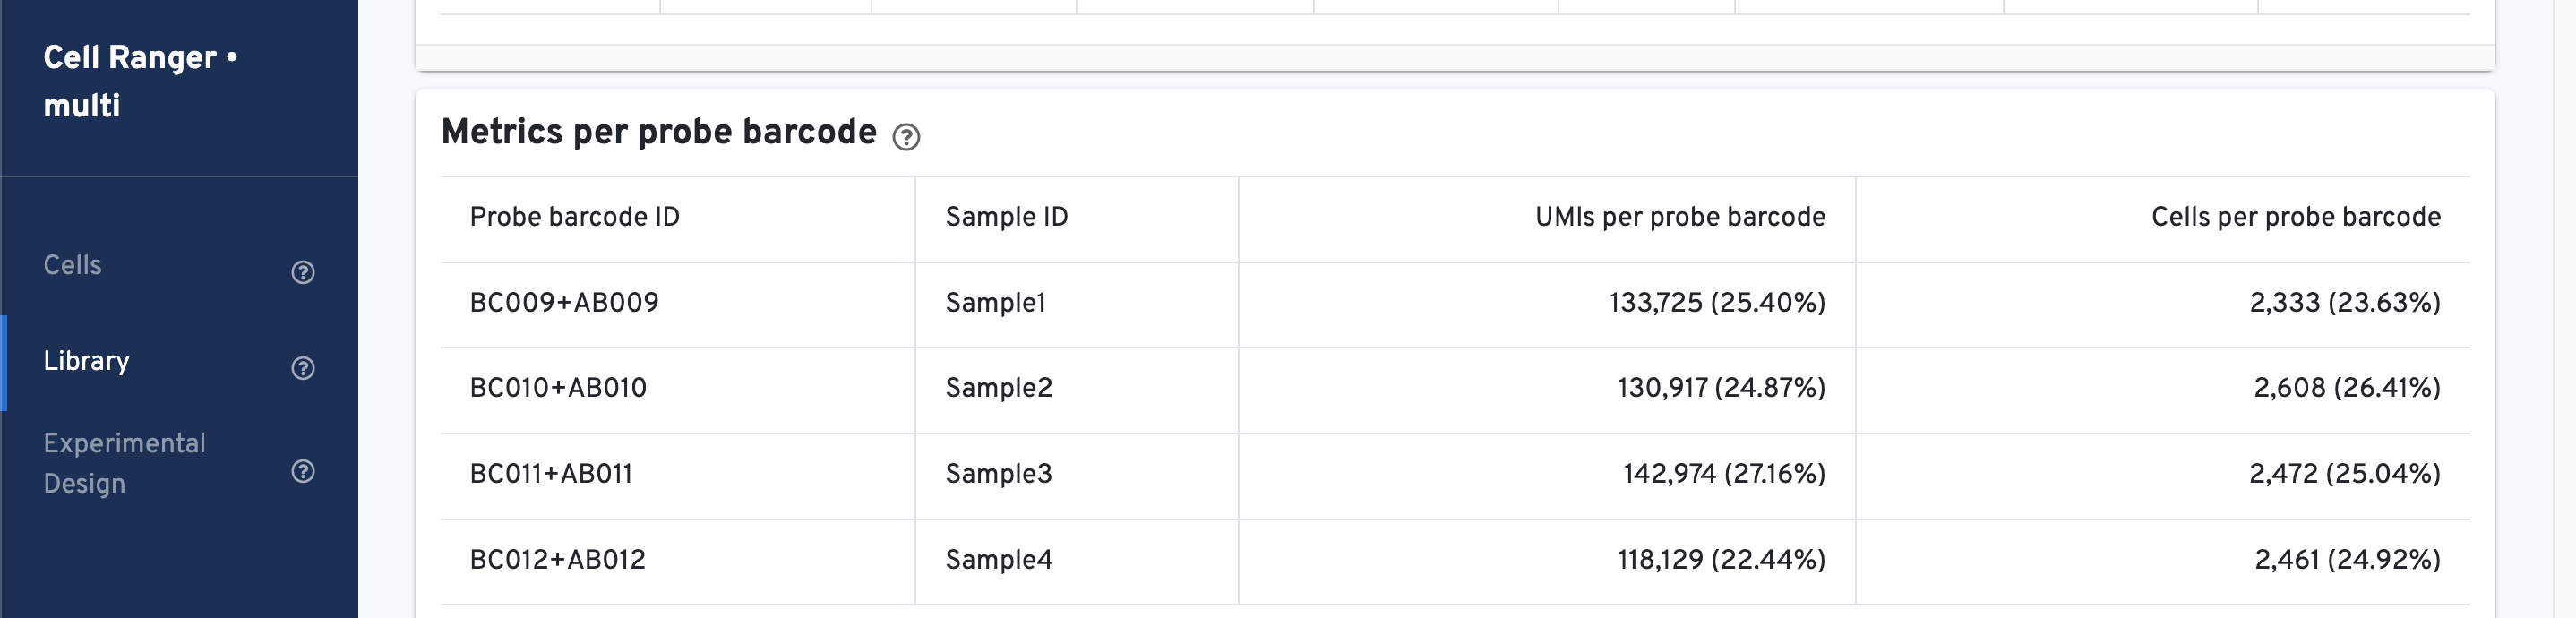
There is an additional Metrics per probe barcode table for multiplexed Fixed RNA Profiling Gene Expression libraries. This table is useful for troubleshooting, for example, to identify when a Probe Barcode was used but not included in the multi config CSV [samples] section, or when a Probe Barcode was not used but was included in the [samples] section.
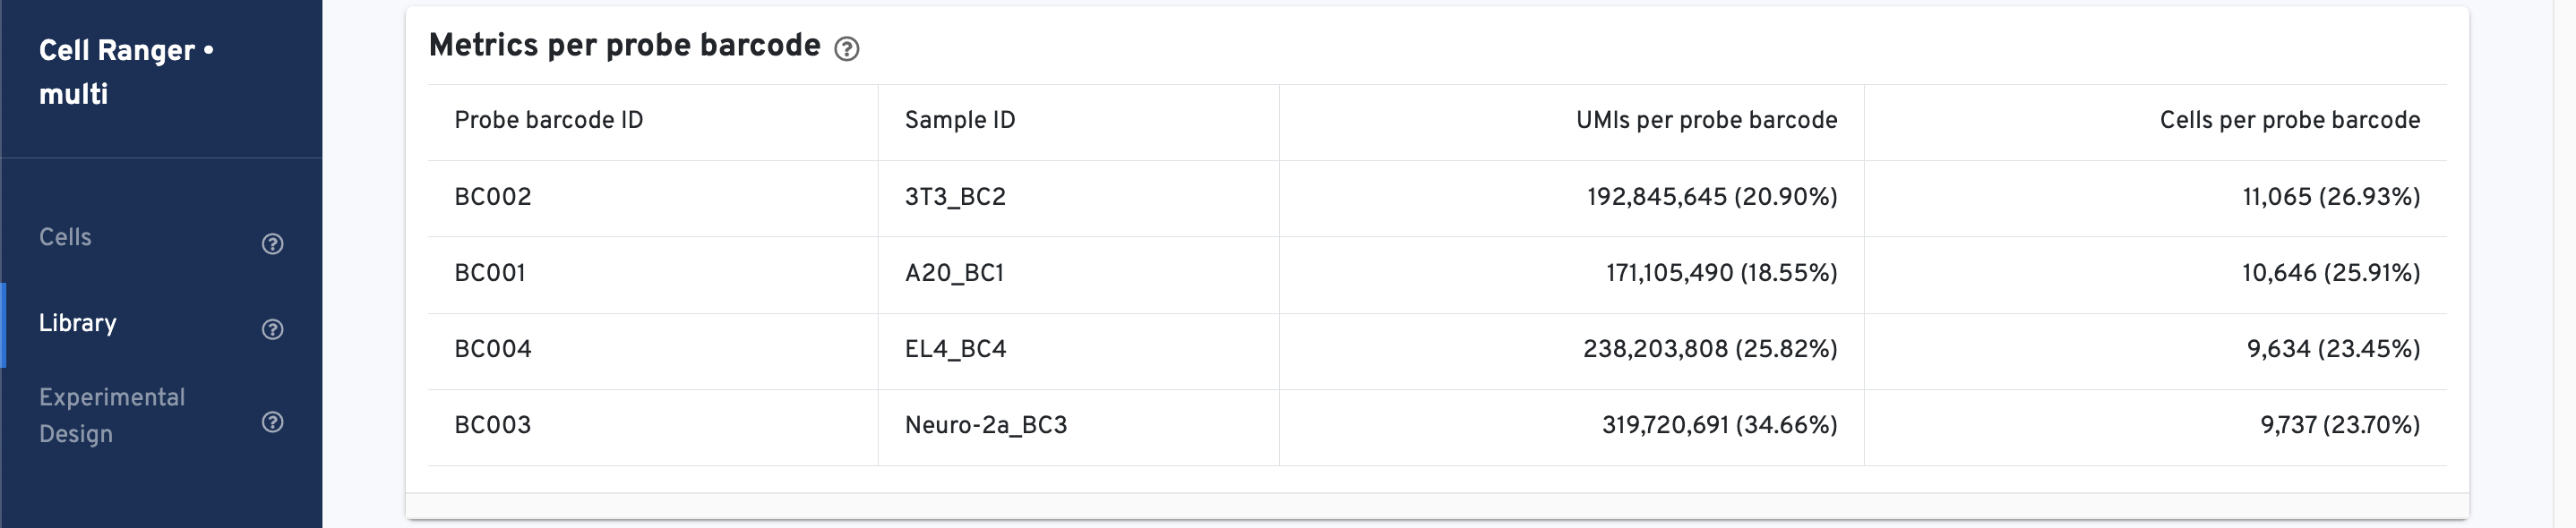
Starting in v7.2, the table will also show the Probe Barcode's corresponding Antibody Multiplexing Barcode (e.g., "BC009+AB009") for multiplexed experiments with both Gene Expression and Antibody Capture libraries.
The web summary Library view for Fixed RNA Profiling datasets will report genomic DNA metrics for the whole library.

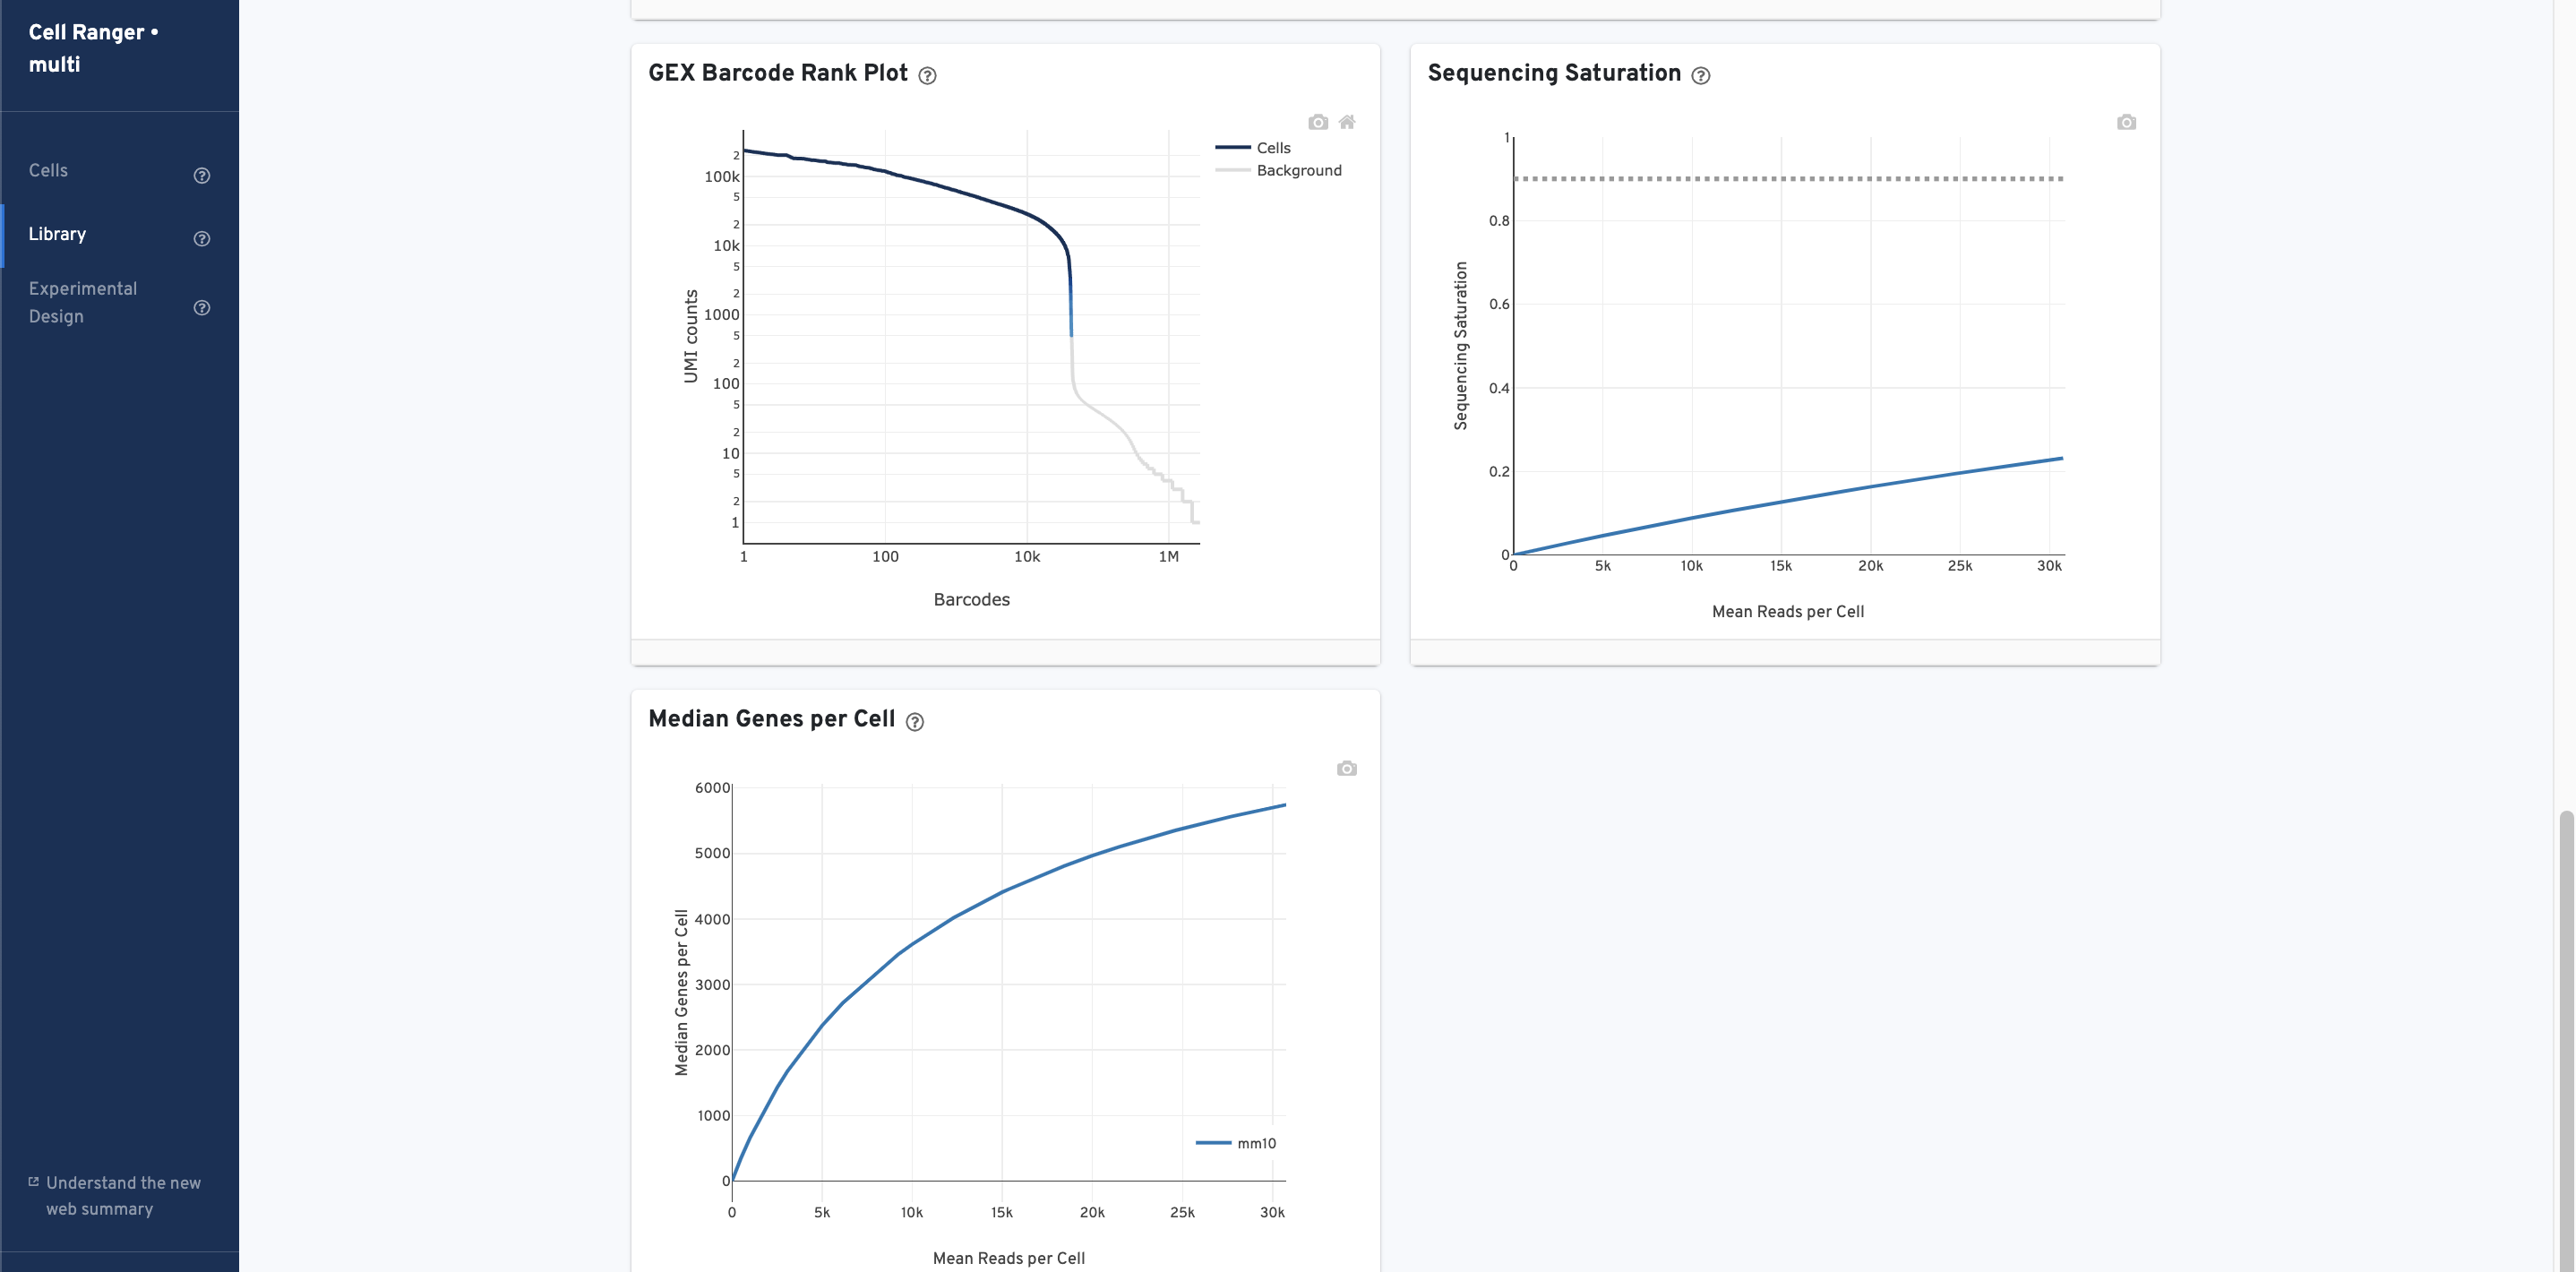
- The GEX Barcode Rank Plot for the gene expression data enables one to assess library quality. Ideally, there is a steep drop-off separating high UMI count cells from low UMI count background noise. See this Guided Tour of the Barcode Rank Plot for more details.
- The Sequencing Saturation plot allows the user to assess the relative trade-offs of sequencing deeper or shallower. As sequencing saturation increases, the total number of molecules detected in the library increases, but with diminishing returns as saturation is approached.
- The Median Genes per Cell plot allows the user to assess the relative trade-offs of sequencing deeper or shallower. The slope of the curve near the endpoint can be interpreted as an upper bound to the benefit to be gained from increasing the sequencing depth beyond this point.
For Antibody Capture libraries, there will be an "Antibody" tab on both the Cells and Library views. The metric tables and plots listed below are only relevant for samples from multiplexed experiments; they are not present for singleplex:
| View | Metric or plot |
|---|---|
| Cells | "Cell Multiplexing" table, "Antibody Barcode Rank Plot" |
| Library | "Metrics per probe barcode" table |
Below is an example for multiplex Fixed RNA Profiling with Antibody Capture.
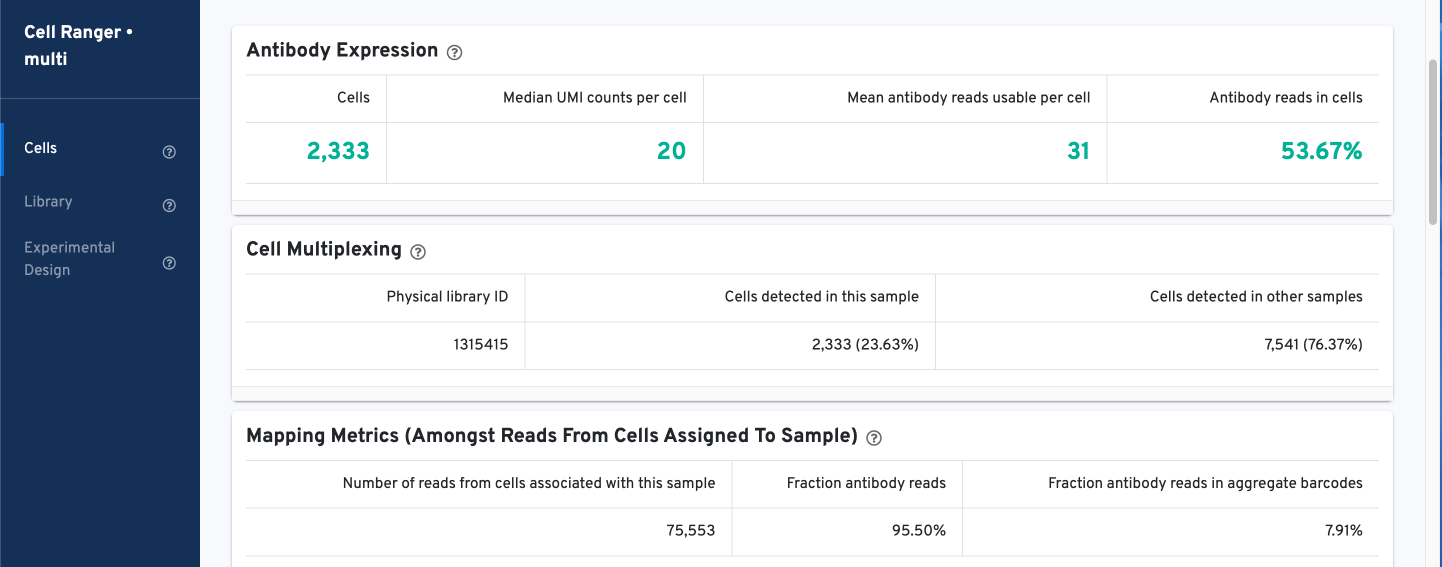
Starting with the Cell view, note key metadata for the Antibody Capture library in the Antibody Expression, Cell Multiplexing, and Mapping Metrics tables. Click the question mark ? to read full descriptions for each metric.
The Histogram of Antibody Counts can help to explore gene expression levels of the top 120 antibody marker genes across the library's population of cells. The x-axis shows UMI counts in the log10 scale (1=10 UMIs, 2=100 UMIs, etc.) and the y-axis shows the number of cells. To view this histogram for a specific subset of antibodies, select (or deselect) antibodies for display by clicking on the legend labels.

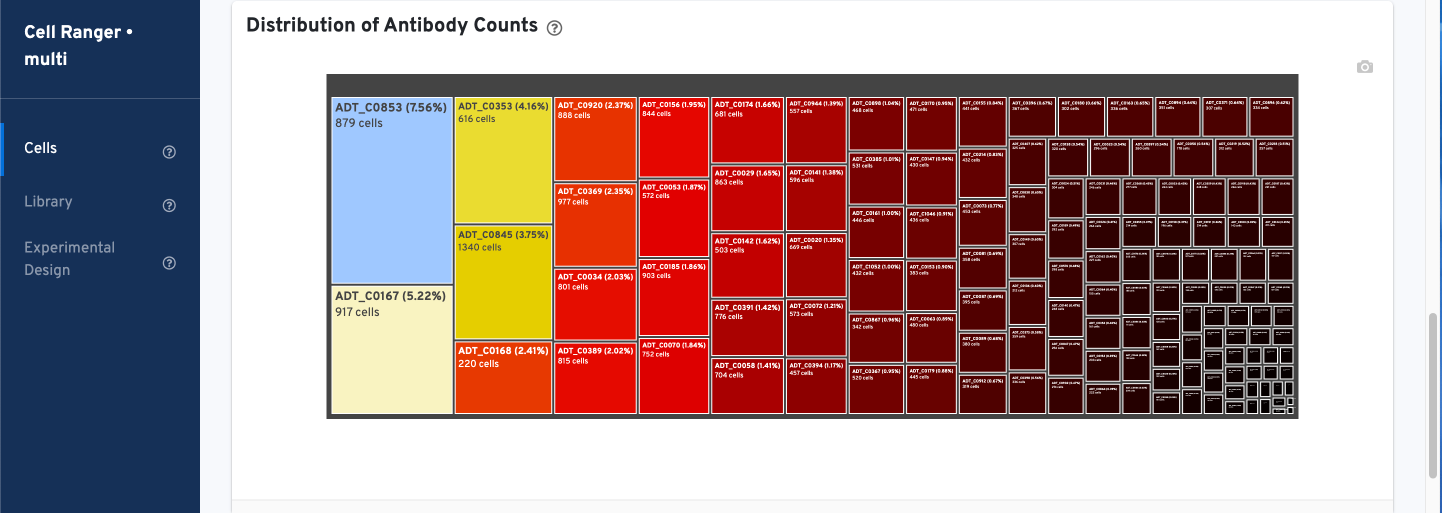
The Antibody tab includes a Distribution of Antibody Counts plot. This plot shows the relative composition of antibody counts for antibodies with at least one UMI. The box size is proportional to the fraction of total UMIs from cell barcodes derived from that antibody. Hovering over a box provides more information about the metrics displayed. In this example, the first blue box shows that at least one ADT_C0853 antibody UMI was detected in 879 cells:
Secondary analysis:
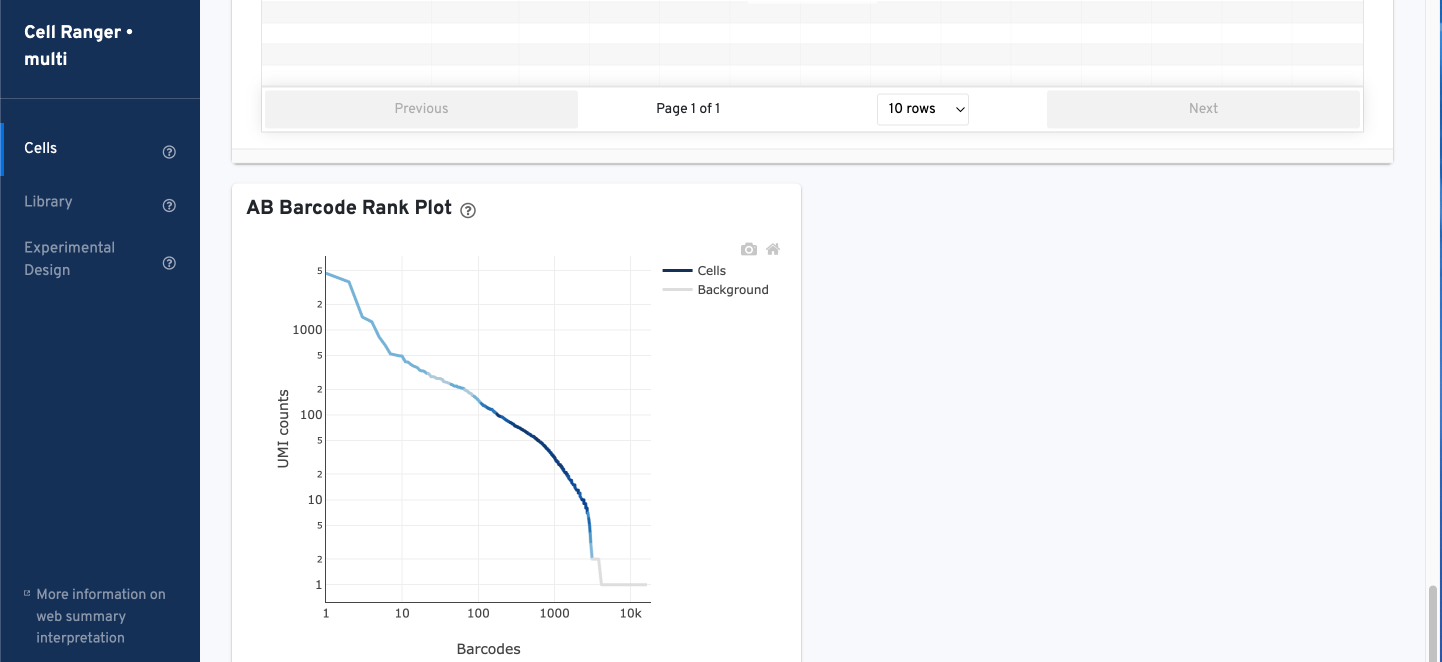
For multiplexed experiments, there is an antibody barcode rank plot for the sample:
The Cell Statistics table displays the most important results of the experiment. Additional metrics are displayed below the hero metrics in the Sequencing Metrics, Mapping Metrics, and Metrics per Physical Library tables. Click the question mark ? to read full descriptions for each one.

There is an additional Metrics per probe barcode table for multiplexed Fixed RNA Profiling Antibody Capture libraries. This table is useful for troubleshooting, for example, to identify when an Antibody Multiplexing Barcode was used but not included in the multi config CSV [samples] section, or when an Antibody Multiplexing Barcode was not used but was included in the [samples] section.
Finally, there is an antibody barcode rank plot for the library:
