Cell Ranger outputs certain files that are specific to the Antibody Capture analysis, besides the Gene Expression outputs.
Starting from Cell Ranger 3.0, all Feature Barcode counts, including Antibody Capture counts, simply become new features in addition to the standard per-gene features, and are output alongside gene counts in the feature-barcode matrix. For every row in the Feature Reference CSV file where feature_type is specified as Antibody Capture, there will be a corresponding row in the feature-barcode matrix. That row will get its title from the id field in the Feature Reference file for that feature, and the counts can be visualized via Loupe Browser by searching for the human-readable name from the name field of the Feature Reference file (for antibody applications, the id and name fields can typically be the same as long as the id is unique).
To visualize cells in 2-D space, secondary analysis dimensionality reduction outputs for Antibody Capture libraries are provided in the analysis/ directory. Log-transformed antibody counts are used to perform these analyses for Antibody Capture libraries. This is in contrast to the gene expression side of the feature-barcode matrix, where these projections are run on the PCA-reduced space from raw counts.
Below are some examples of the PCA, t-SNE, and UMAP output projection files.
Principal Components Analysis (PCA):
head -5 analysis/pca/antibody_capture_10_components/projection.csv
Barcode,PC-1,PC-2,PC-3,PC-4,PC-5,PC-6,PC-7,PC-8,PC-9,PC-10
AAACAAGCACCATACT-1,-5.574515404720648,4.1250677853049735,0.3343758325171491,-0.9529782537962408,-1.8811942105099764,-0.4217695409442901,-1.9900329330389255,-1.2255017468251315,-1.3980947791205285,-1.1176859809904909
AAACAAGCACGTAATG-1,-6.983452898884609,-1.9379476767294177,-0.042479446422044376,-1.264967360758824,4.167549425417305,0.12065395835962933,-0.707084060668425,-2.9769215409849656,0.9053984182888417,-0.061563257127632665
AAACAAGCATGCAATG-1,-4.430486543723384,3.7442086078976002,-0.9447490398187632,-1.9902233589725338,-0.6258151384415838,-1.3582451690099415,-0.107256076231657,-1.6254493516586832,-0.43820589495677176,2.3253990939137505
AAACAAGCATTTGGGA-1,-4.945904594634436,4.017097394368968,-0.16688953081917113,-0.5729444140584459,-1.8303228981840096,-0.7755095535305054,-1.4069565944426259,-0.7969252558721216,-0.0011689859429466765,0.39202448730849027
The t-distributed Stochastic Neighbor Embedding (t-SNE):
head -5 analysis/tsne/antibody_capture_2_components/projection.csv
Barcode,TSNE-1,TSNE-2
AAACCCAAGTGGTCAG-1,-29.97926190939189,-3.5125258285933603
AAAGGTATCAACTACG-1,20.762905594110116,-6.946344013493825
AAAGTCCAGCGTGTCC-1,11.156075443007484,-5.489821984514518
AACACACTCAAGAGTA-1,-26.08126312702518,-5.167458628104057
The Uniform Manifold Approximation and Projection (UMAP)):
head -5 analysis/umap/antibody_capture_2_components/projection.csv
Barcode,UMAP-1,UMAP-2
AAACGAAAGACCAGCA-1,-0.27067992,-6.089176
AAACGAAAGACGGAAA-1,-6.584536,4.711372
AAACGAAAGCGAAACC-1,-7.544384,5.097423
AAACGAATCAATCTCT-1,2.8123982,3.3911235
Cell Ranger 6.1 and later outputs detailed information about detected aggregate barcodes in a file named aggregate_barcodes.csv. This file is only produced if antibody or antigen aggregates are detected.
If your data was analyzed using cellranger multi v7.1 and later, this output is found under the outs/per_sample_outs/<sample_name>/count/aggregate_barcodes.csv folder, and in outs/ for the cellranger count pipeline. In older versions of Cell Ranger, the aggregate_barcodes.csv is contained in a subfolder called /count/antibody_analysis/aggregate_barcodes.csv.
aggregate_barcodes.csv shows antibody (and antigen) barcodes that were detected as aggregates and the following metrics:
umi_corrected_reads: Number of reads with this barcode and library type that required UMI correctionfrac_corrected_reads:umi_corrected_readsdivided by the total number of reads in the library with this barcodefrac_total_reads: Number of reads with this barcode divided by the total number of reads in the libraryfrac_sample_reads: Number of reads with this barcode divided by the total number of reads in the library assigned to the relevant sample
head aggregate_barcodes.csv
barcode,library_type,umis,umi_corrected_reads,frac_corrected_reads,frac_total_reads,frac_sample_reads
CGATGACCAAGCCTCCAGTGAGTG-1,Antibody Capture,854,0,0.0,0.002,0.006477257066593166
CTCAGCTAGTACCAGGAGTGAGTG-1,Antibody Capture,1235,0,0.0,0.002,0.009480151160176111
TGTGGGTCATTTATCGAGTGAGTG-1,Antibody Capture,1146,0,0.0,0.002,0.008783827892098906
Summary metrics for the antibody counts will be displayed in the Summary view of the count web summary under Antibody Sequencing and Antibody Application, and in the Cells and Library views of the multi web summary under the Antibody tabs.
Starting from Cell Ranger 6.1, on both count and multi web summaries, the histograms on UMI counts will be shown for features that were specified as Antibody Capture in the Feature Barcode reference file.
Any specific antibody analysis steps are described in the Antibody Algorithms section.
To reduce sequencing and library preparation costs, Antibody Capture libraries without any gene expression data can be analyzed with Feature Barcode Only mode in cellranger count (Cell Ranger v3.1+).
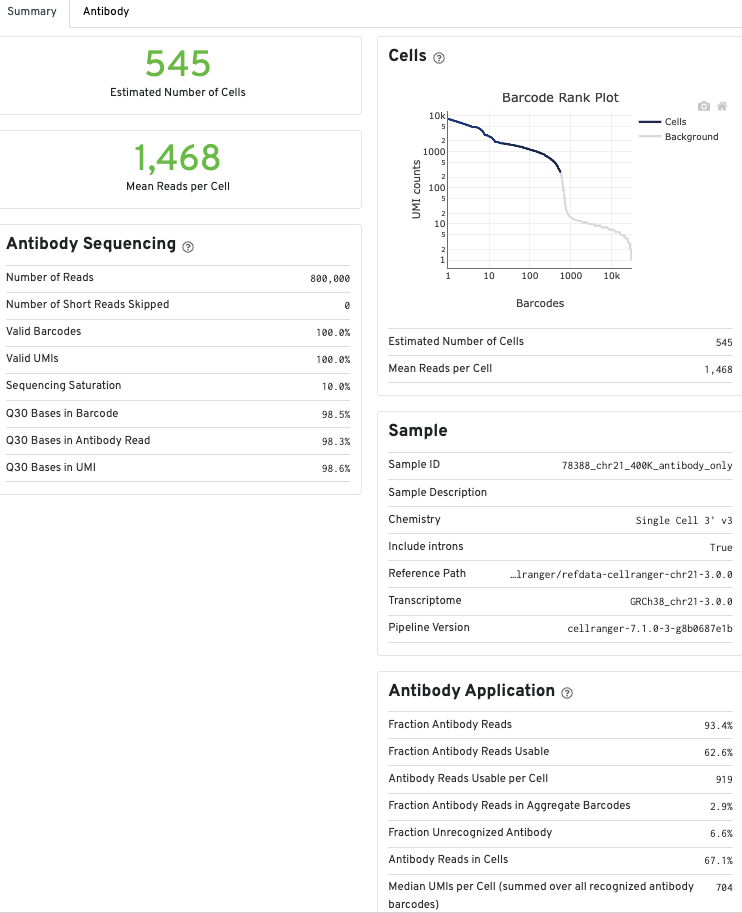
A web_summary.html file summarizing the run is produced as usual. However, metrics displayed in the web summary in Feature Barcode Only mode do not precisely match results for Gene Expression + Feature Barcode analysis, since there are differences in the set of cells that are called in each mode. Click the question mark ? to read full descriptions for each section.
Metrics for Antibody libraries appear on the Summary tab under the Antibody Sequencing and Antibody Application sections. The Sequencing and Mapping sections, which display metrics from Gene Expression libraries, do not appear.
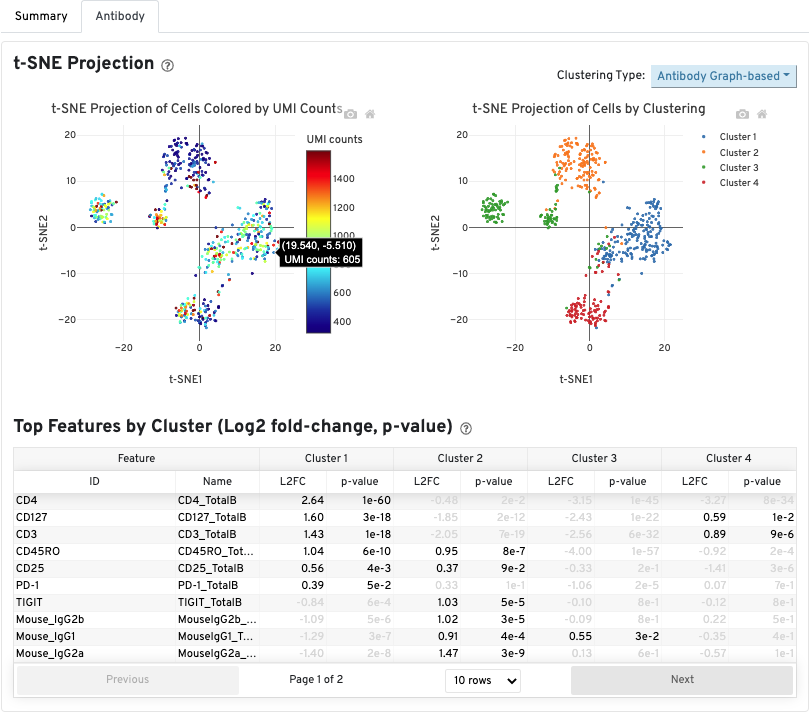
The Antibody tab will have t-SNE projection plots, a Top Features table, and a histogram of Antibody counts:
In Cell Ranger v7.1 and later, the Antibody tab includes a Distribution of Antibody Counts plot. This plot shows the relative composition of antibody counts for antibodies with at least one UMI. The box size is proportional to the fraction of total UMIs from cell barcodes derived from that antibody. Hovering over a box provides more information about the metrics displayed. In this example, the first blue box shows that at least one CD45RA antibody UMI was detected in 535 cells:
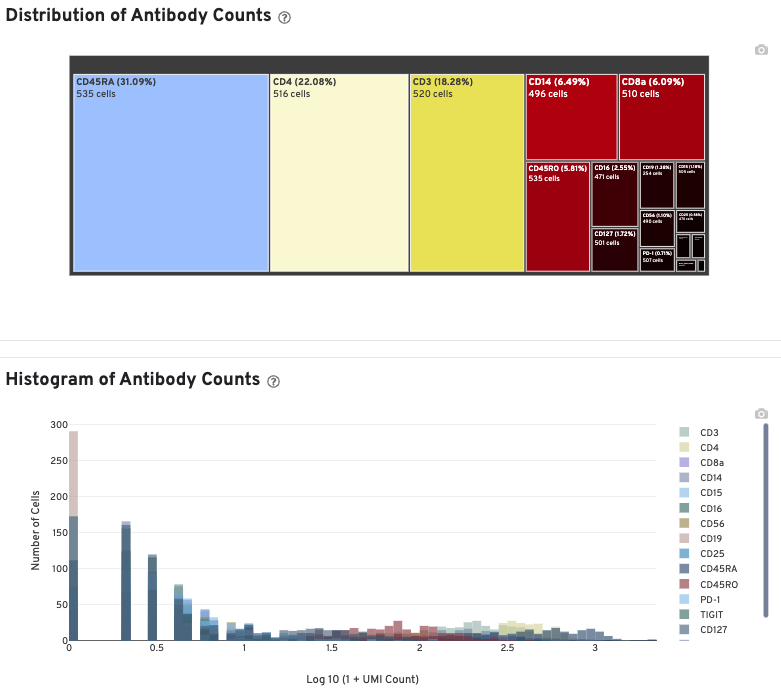
The Histogram of Antibody Counts shows the UMI counts in the log scale on the X-axis, and the number of cells on the Y-axis. Only antibodies with total UMI counts over 1,000 are plotted, and only up to the top 120 antibodies by UMI count are shown. To view this histogram for a specific subset of antibodies, select (or deselect) antibodies for display by clicking on the legend labels.
Shown below are results for a single sample with Gene Expression and Antibody Capture libraries. On the left, both libraries are processed together, and the barcode rank plot displays Gene Expression counts. On the right, only the Feature Barcode library is supplied to cellranger count, and the barcode rank plot displays the antibody counts.
Observe that a similar number of cells was called in each cellranger run, but the shape of barcode rank plot differs due to differences in the background levels of the Gene Expression and Antibody Capture libraries.
Gene Expression + Feature Barcode
Feature Barcode only
Feature Barcode Only analysis only detects cells that are labelled by the Feature Barcode reagents in use. Cell types not well-stained by the panel have low total UMI counts and may not be called by the cell calling algorithm. The table below illustrates this effect by comparing the number of cells detected in the Gene Expression library and Antibody Capture library derived from the same cells. As the number of antibodies in the panel increases, the number of cells detected in the Feature Barcode Only analysis approaches the number detected in the gene expression analysis. Below are results for a series of TotalSeq™-B antibody panels applied to human PBMCs.
| Description | Loaded Cells | GEX Called Cells | Ab Called Cells | Called In Both |
|---|---|---|---|---|
| TotalSeq™-B 4 Antibodies | 1000 | 705 | 562 | 533 (75.6%) |
| TotalSeq™-B 5 Antibodies | 1000 | 749 | 653 | 626 (83.6%) |
| TotalSeq™-B 14 Antibodies | 5000 | 4233 | 4389 | 3977 (93.9%) |
| TotalSeq™-B 31 Antibodies | 5000 | 4616 | 4488 | 4540 (97.2%) |