Note: 10x Genomics does not provide support for community-developed tools and makes no guarantees regarding their function or performance. Please contact tool developers with any questions. If you have feedback about Analysis Guides, please email analysis-guides@10xgenomics.com.
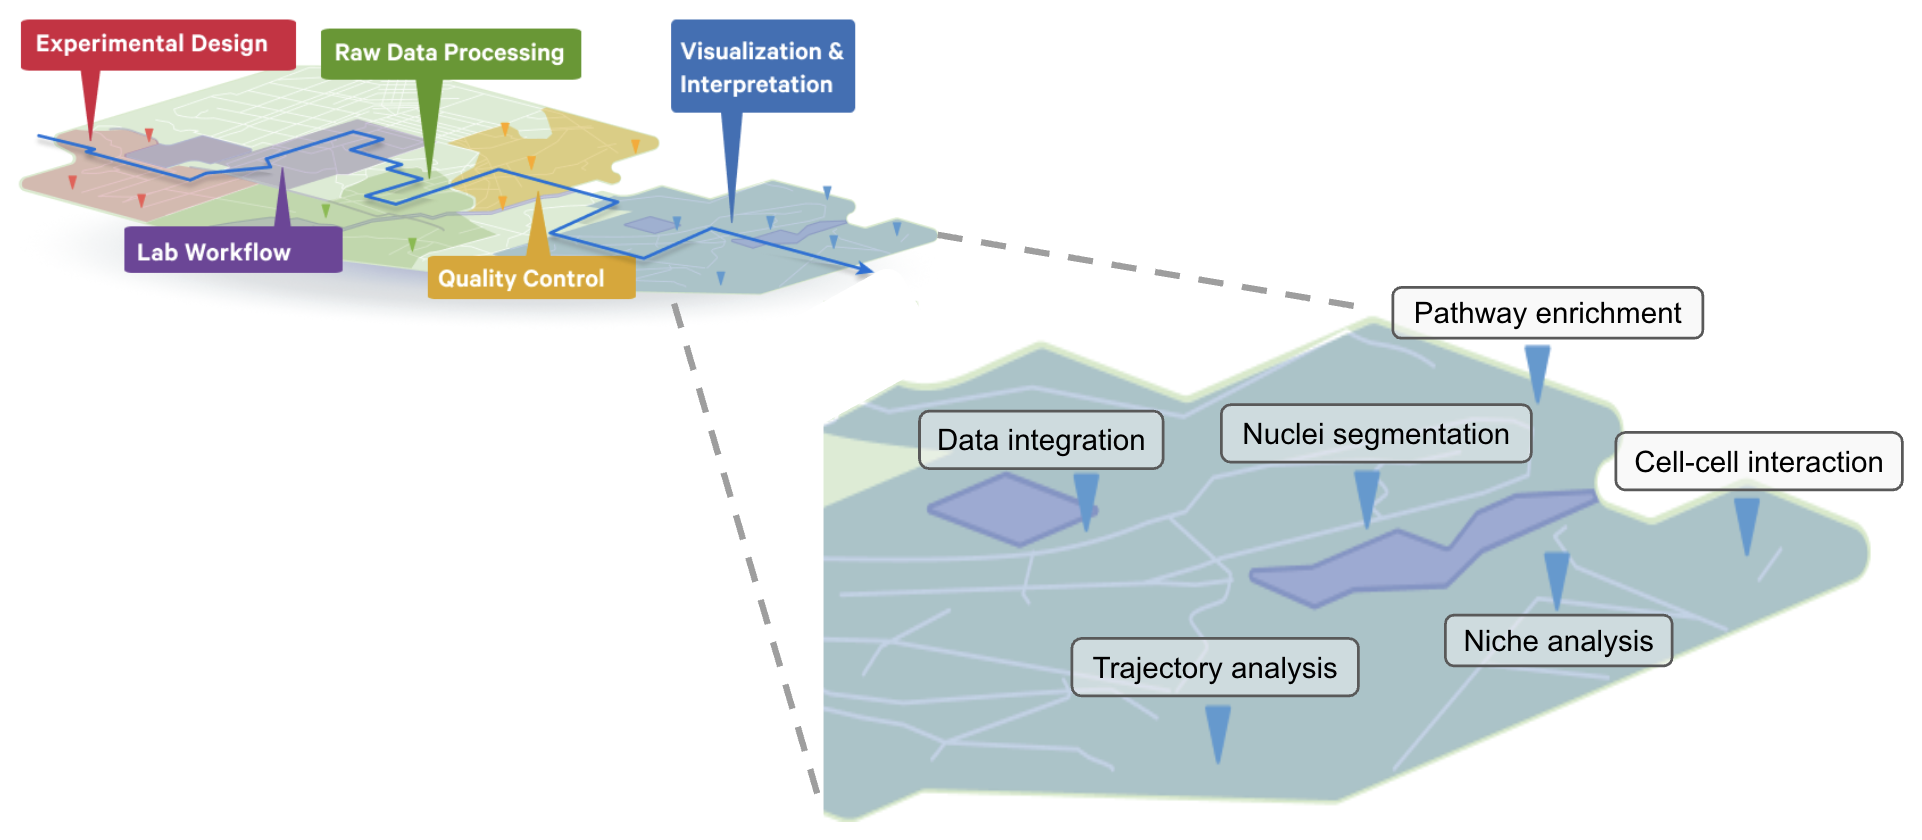
The Visium HD and Visium HD 3’ Spatial Gene Expression assays enable whole-transcriptome spatial gene expression analysis at single-cell-scale resolution across a wide range of sample types and tissues, enabled by the use of ~11,000,000 continuous 2-µm features. However, the large amounts of data generated, compute resources required, and lack of standard workflows present challenges for analysis. This article aims to highlight popular tools and methods and is intended to help you understand the criteria for selecting the appropriate ones for your research question.
The workflow steps for the Visium HD Spatial Gene Expression and the Visium HD 3’ Spatial Gene Expression assays are detailed on the 10x Genomics support site. Sample preparation, staining, library construction, imaging, and sequencing requirements are described for each assay, including a Technical Note for imaging guidelines.
The set of analysis pipelines used to process Visium data along with compatible brightfield or fluorescent images are known as Space Ranger, which can be run on 10x Genomics Cloud Analysis or on a compatible Linux machine. The output files are then ready for downstream analyses using community-developed tools, some of which are discussed in this article.
This article focuses on the analysis steps that follow Space Ranger. Researchers who are new to Visium HD data analysis may find the self-paced learning section of the following article to be a useful starting point: Hands-on Tour of the Visium HD Spatial Gene Expression Analysis Journey.
After running Space Ranger and performing the necessary quality control checks, you might be ready to combine multiple Visium HD samples, or integrate your data with additional data modalities, such as single cell (Chromium) or In Situ (Xenium) assays from 10x Genomics.
Multi-sample integration
Multi-sample analysis refers to the analysis of data from multiple conditions, individuals, tissue sections, or samples. When combining multiple samples, it is important to think about data normalization, correction of technical batch effects, and alignment of spatial coordinates. Example tools include stLearn, STalign, PRECAST, SPIRAL, and Seurat. We demonstrate multi-sample analysis in both R and Python in the articles linked below:
- Visium HD Multi-sample Analysis in Python: a Tutorial in Google Colab
- Visium HD Multi-sample Integration Analysis: an R Tutorial in Google Colab
Single-sample integration
Data integration can also refer to the combination of single cell data with spatial data derived from the same biological sample. Single cell datasets can have higher numbers of transcripts and UMIs compared to spatial transcriptomics datasets. Data can be combined for a more comprehensive understanding of the molecular and spatial biology of the samples. A well-matched sample is highly recommended for this type of analysis.
The integrated single cell data can be used to perform spot-cell type deconvolution using tools such as Cell2location, SpatialDWLS, and SpaceXR (see also the SpaceXR vignette). Deconvolution methods aim to identify the cell types and their proportions in a given spot or square. Space Ranger’s custom binning options for Visium HD make it possible to perform cell-type deconvolution as well. A reference-free method is demonstrated in tools like STDeconvolve and SpatialDeX.
Using single cell data can improve cell type identification. Another common approach with data integration is label or annotation transfer and mapping approaches as implemented in Seurat (v5), scVI, and scArches.
For benchmarking of integration methods in spatial transcriptomics, see Hu et al. 2024.
What is cell segmentation in Visium HD data analysis?
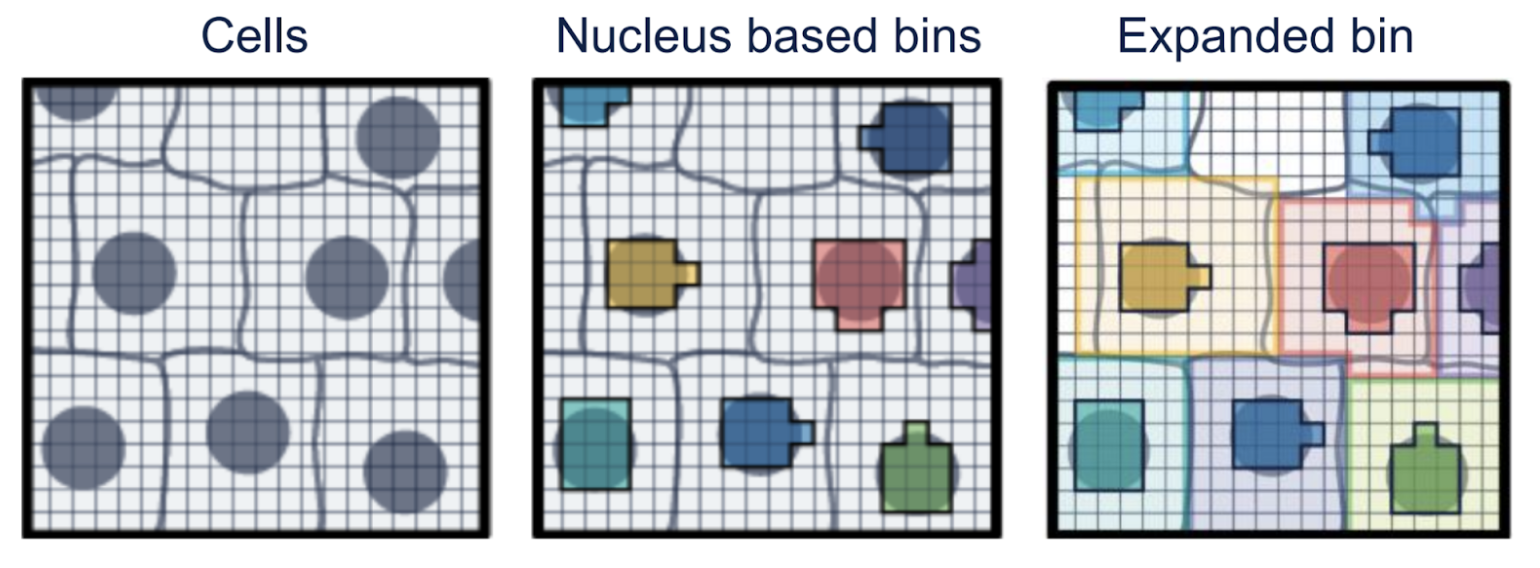
Visium HD data can be analyzed through cell segmentation, assigning 2-µm features to individual nuclei and cells based on the high-resolution microscope image. The process can be visualized as shown below:
- Raw Data: The left-most image displays 2-µm barcodes arranged in a continuous grid across the tissue.
- Aggregated Bins: For simplified data management, these barcodes can be aggregated into larger square bins (e.g., 8x8 µm or 16x16 µm). However, this method may combine multiple cells into the same bin and may require deconvolution.
- Cell Segmentation: A more refined approach utilizes a high-resolution microscopic image. This allows for the grouping barcodes by cell nucleus (middle), followed by expansion to infer approximate cell boundaries (right), enabling per-cell gene counts.
Why should I consider using cell segmentation?
Cell segmentation for Visium HD data infers approximate cell boundaries and converts gene counts from 2-µm features to a per-cell basis. This refines understanding of gene expression, especially in complex tissues, and reduces the need for deconvolution. Cell segmentation can also aid downstream analyses like trajectory analysis and cell-cell communication.
Figure 7i from Oliveira et al. (2025) is shown below.
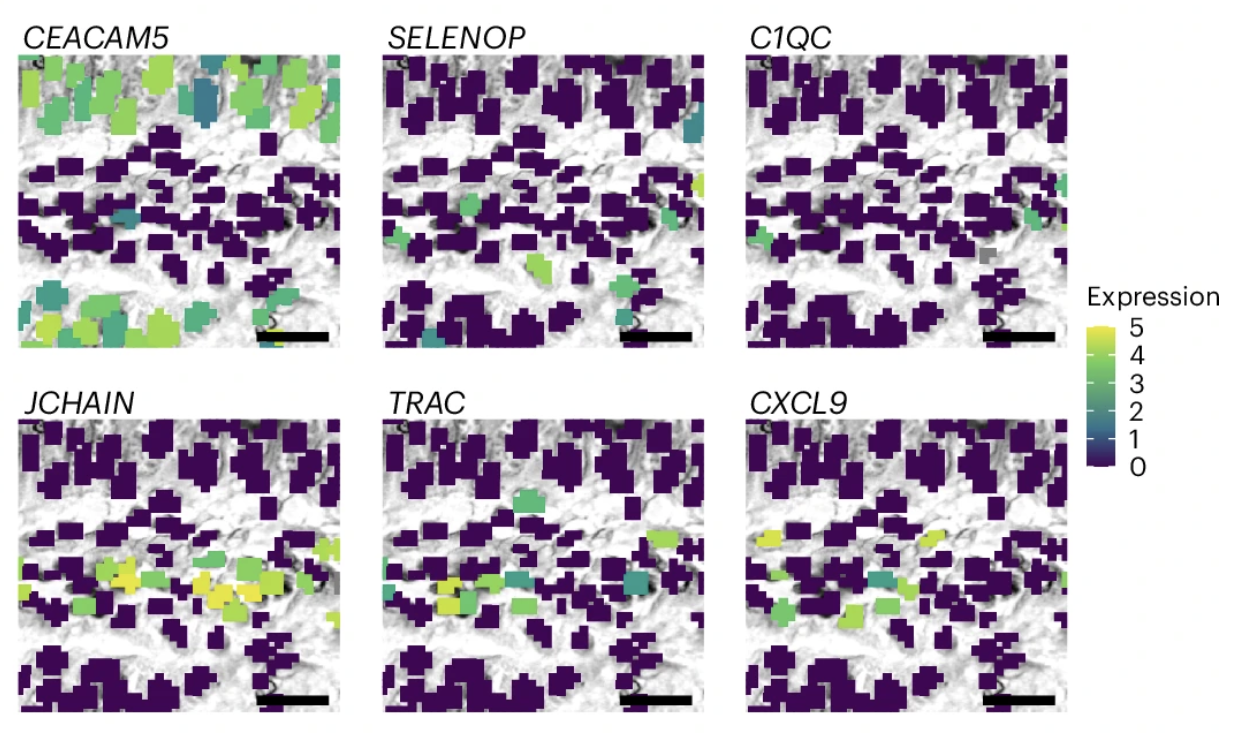
Figure adapted with permission from 10x Genomics.
This figure represents a magnified view of the same regions using a Visium HD nuclei-segmented image. The bins are color-coded based on the normalized log (UMI) counts of marker genes.
Where to begin and how to run this analysis?
Starting in Space Ranger v4.0, cell segmentation results are included for Visium HD and HD 3’ data analysis when the pipeline is run with high resolution H&E images. Algorithm details can be found here.
There are also community-developed tools that can be used for cell/nucleus segmentation. The main categories of tools are those that offer cell/nucleus segmentation only via image-based methods, and those that also incorporate gene expression information. Custom segmentation masks generated with these tools can be input into Space Ranger.
What is cell type identification and annotation for Visium HD?
Cell type identification and annotation is a critical step in order to understand the biological processes in a tissue sample. This type of analysis is not specific to Visium and can be carried out on single cell data as well. The morphological context from the image can improve the cell annotation process in Visium data.
Why is this step helpful for Visium HD data analysis?
After running Space Ranger, bins or inferred cells are clustered based on differentially expressed genes. Identification of cell types can inform the appropriate next steps. Loupe Browser (10x Genomics) provides an easy way to visualize the different clusters and can be used for cell type annotation. Understanding cell compositions and locations can provide insight into the biological pathways and processes in the tissue of interest. For instance, identifying the cells within a tumor and its surrounding microenvironment can help understand the disease mechanism of specific cancers, as demonstrated by Oliveira et al. (2025).
How to run this analysis?
Cell type annotation can be performed manually following differential gene expression by using canonical markers from the literature or online databases. If a given cluster (which may not always be a single population of cells) shows significantly expressed marker genes for a known cell type, manual methods can be used for annotation. This approach is demonstrated in our Loupe Browser tutorial using a human colon cancer sample. Reclustering can also be performed to delineate and refine subtypes.
There are also several popular tools to perform automated annotation, e.g., Azimuth. The choice of tool depends on the research question and sample type. Healthy tissues can be easier to annotate with automated methods but diseased tissue may require manual annotation.
What is the inference of cell-cell communication in Visium HD data analysis?
Cells interact with each other and respond to various stimuli from their environment by a process generally known as cell-cell communication (CCC). Inference of CCC is a useful technique for studying diseases like cancer and other biological processes. Single cell transcriptomics has enabled this kind of analysis to be routinely performed and the addition of spatial context from assays like Visium HD helps to further evaluate the possibility and likelihood of inferred interactions.
Computational tools to infer CCC have been developed with two main approaches.
- LIANA (LIgand-receptor ANalysis frAmework) is a framework able to prioritize ligand-receptor interactions from single cell and spatial transcriptomics using different resources and methods.
- Other tools can identify context-dependent cell-cell interactions and infer intercellular activity induced by the interactions. For example, see Niche-DE (Mason et al. 2024).
What biological questions could this analysis address? Why can this step be helpful for Visium HD data analysis? When is this analysis appropriate?
Inference of CCC is a useful technique for studying diseases like cancer and other biological processes. Gene expression patterns within a cell can be influenced by other neighboring and nearby cells within their niche. After broad cell-type annotation is performed, interrogation of the local cell-type-specific interactions can yield insights into the tissue of study.
For example, Oliveira et al. (2025) used LIANA to assess CCC between macrophages and T cells, and inferred ligand-receptor interactions within the tumor periphery region. This revealed the dominant SPP1+ macrophage interaction with tumor and T cells via the CD44 receptor. SELENOP+ macrophages showed distinct interactions with tumor cells and T cells, primarily influencing pro-tumor metabolic pathways and immune cell stimulation.
What do example results look like?
Figures 5e and 5f from Oliveira et al. (2025) are shown below:
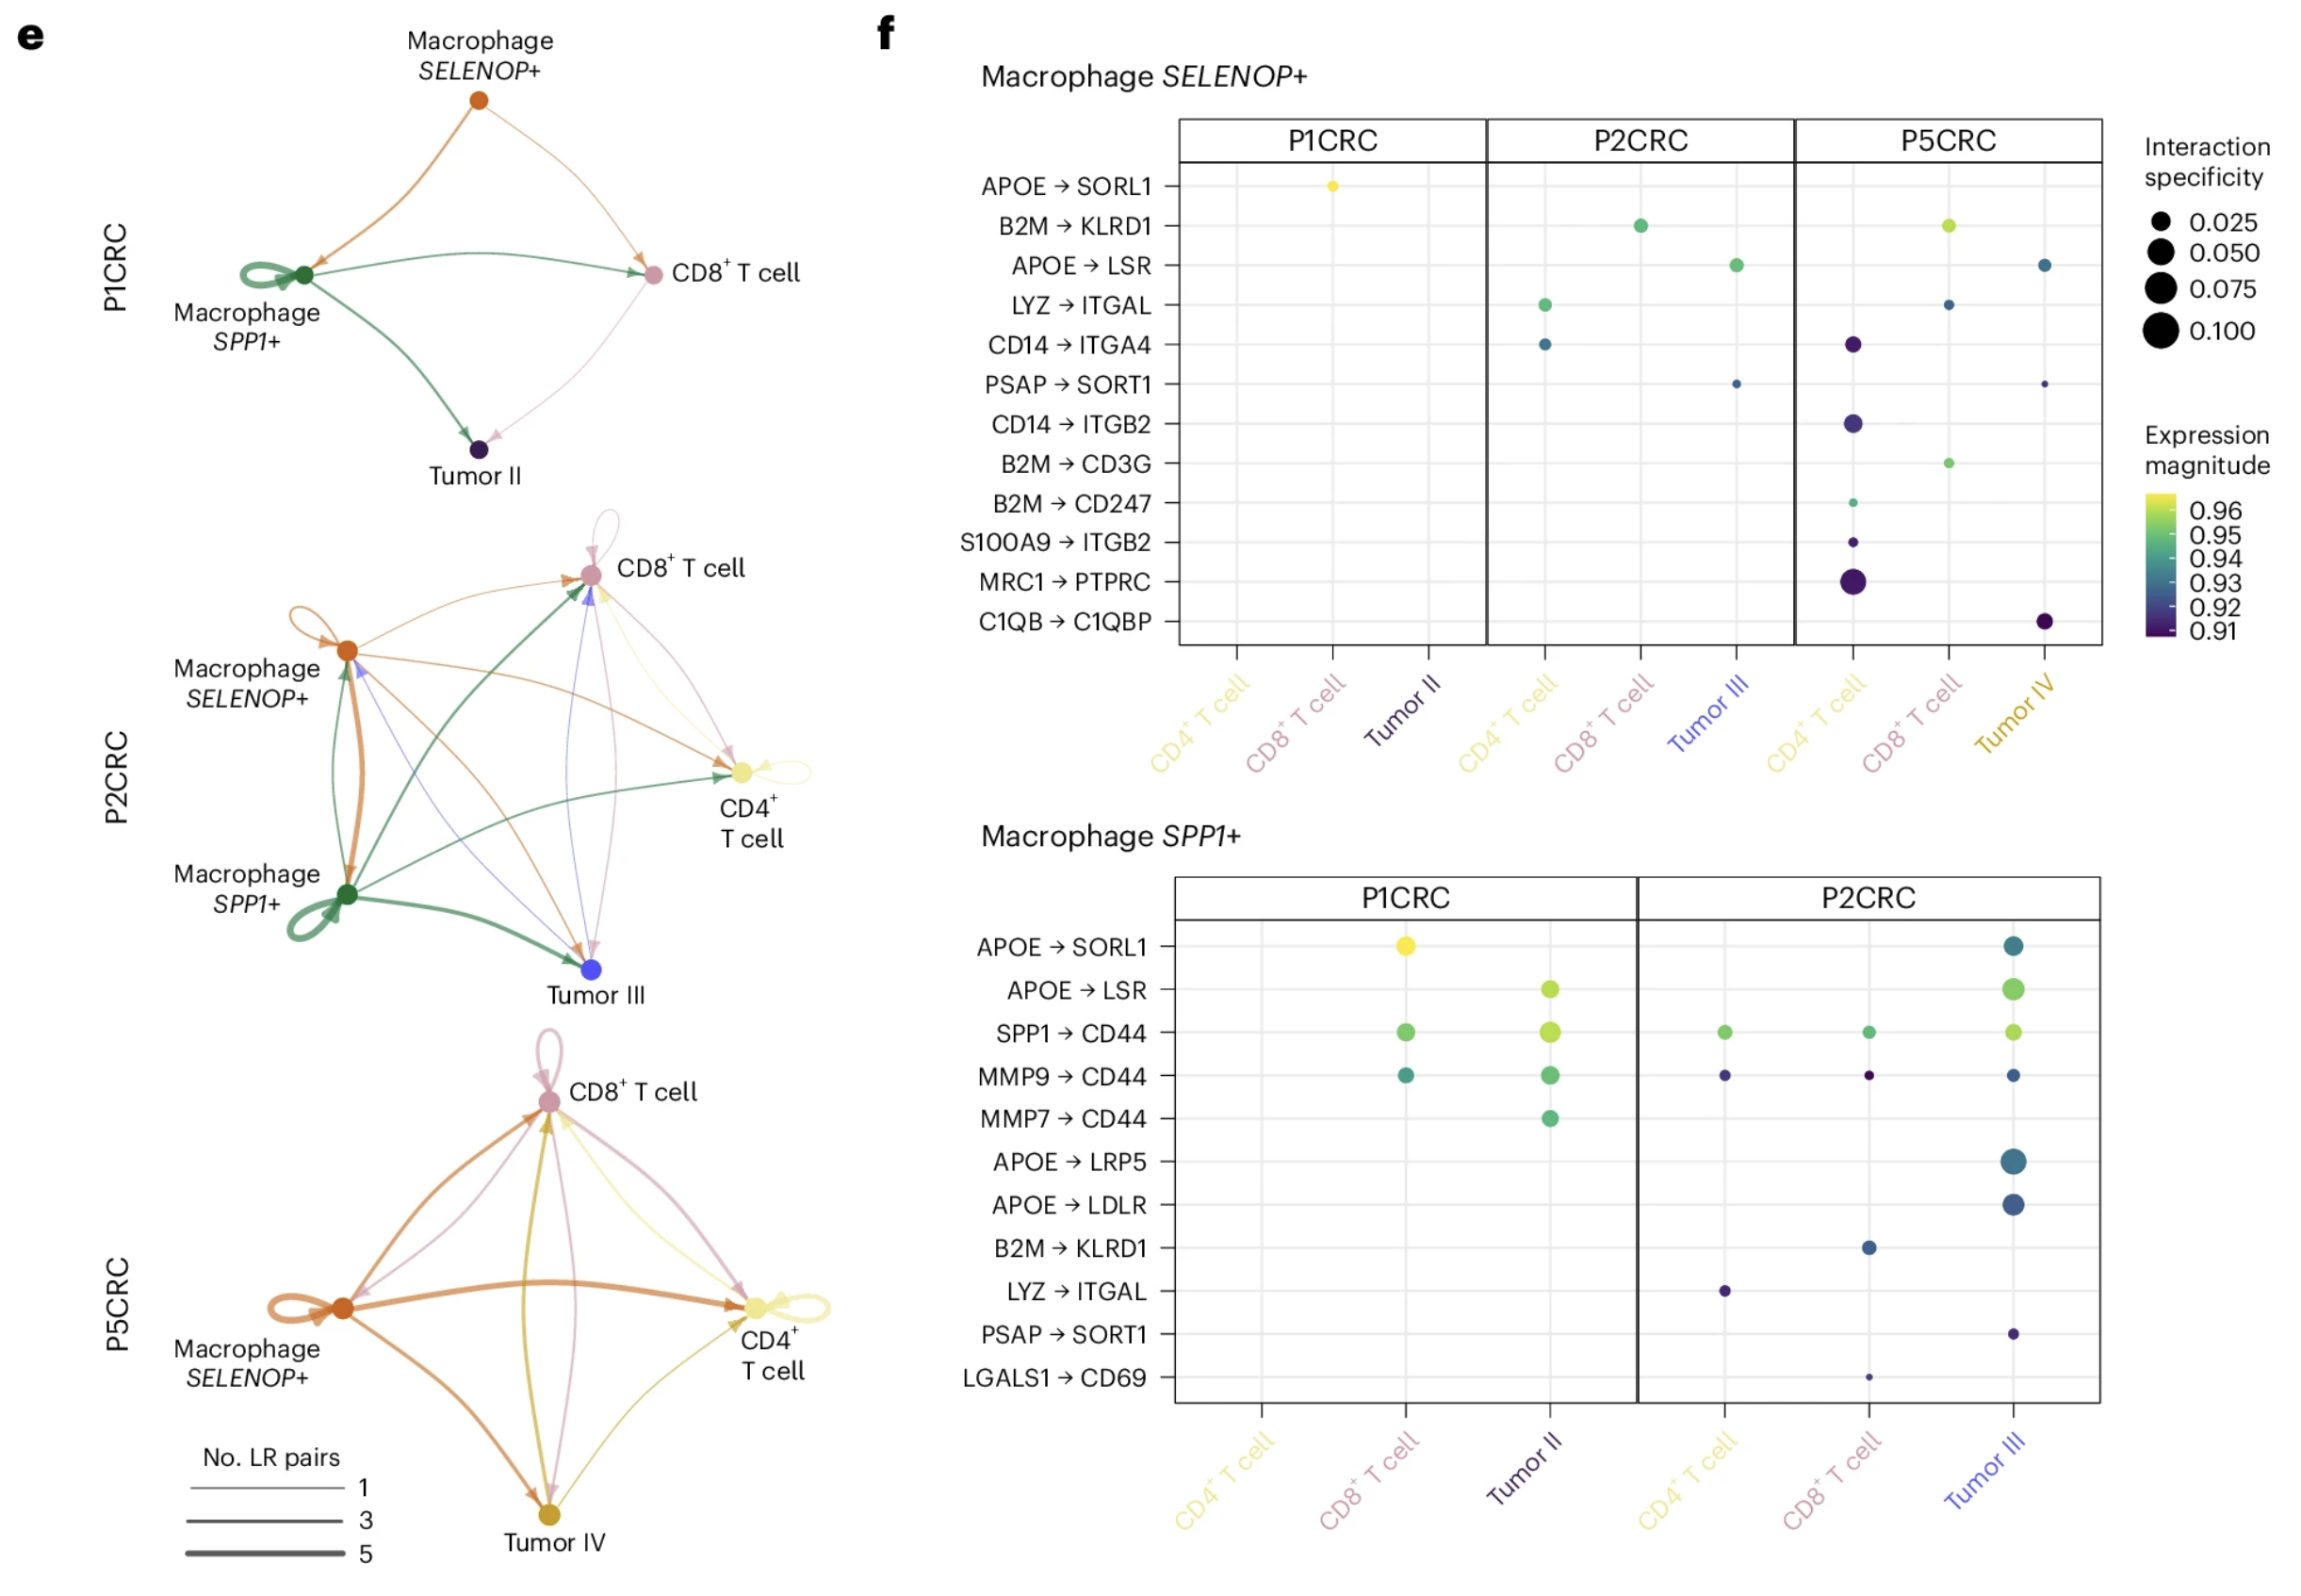
Figure adapted with permission from 10x Genomics.
Figure 5e shows "interaction networks of macrophages, T cells and tumor cells in the boundary regions (50 µm). Nodes represent cell types, and edges represent the number of significant ligand–receptor (LR) pairs." Figure 5f shows a "dot plot representing the expression and specificity of ligand–receptor pairs for SPP1+ and SELENOP+ macrophages as sources." Scale bars are set to 1 mm.
How to run this analysis?
It is recommended to perform this analysis after clustering and cell type assignment are completed with reasonable confidence. Example tools include LIANA, stLearn, and CellphoneDB.
What is spatially-aware clustering in Visium HD data analysis?
Clustering in single cell data is based on the expression profiles of the differentially expressed genes of the cells contained in a given dataset. Leveraging spatial information to enable spatially-aware clustering by considering the spatial coordinates in addition can increase confidence of the cluster assignments using spatially-variable genes.
What biological questions can be addressed and when is the analysis appropriate?
Spatially-aware clustering may improve the biological organization and activity within tissues and help identify microenvironments based on the cellular makeup and gene expression of adjacent cells.
Where to start and how to run this analysis?
Tools like BANKSY have been incorporated in Seurat v5 and can be run on the Seurat object as part of standard Visium HD analysis. Example tools include Seurat v5, BANKSY, and COVET.
What do the results look like?
See Figure 2 from Yuan et al. 2024.
What is pathway analysis in Visium HD?
Pathway analysis is a very popular method used with high-throughput data where there potentially can be hundreds of differentially expressed genes, making it challenging to interpret the data. The goal of this type of analysis is to identify biological pathways that are overrepresented in a given experimental condition relative to other conditions in the experiment.
What biological questions could this analysis address? Why can this step be helpful for Visium HD data analysis? When is this analysis appropriate?
Pathway analysis in single-cell and spatial gene expression data helps address questions about cell-to-cell variability, cell type heterogeneity, and the biological processes driving cellular behavior. It allows researchers to understand which biological pathways are active in specific cell types or under different conditions, and how these pathways contribute to cellular functions and responses. Using Visium data, a researcher can summarize many molecular insights into interpretable pathways for specific clusters, cell types or microenvironments.
What do the results look like?
Figure 5a from Oliveira et al. (2025) is shown below:
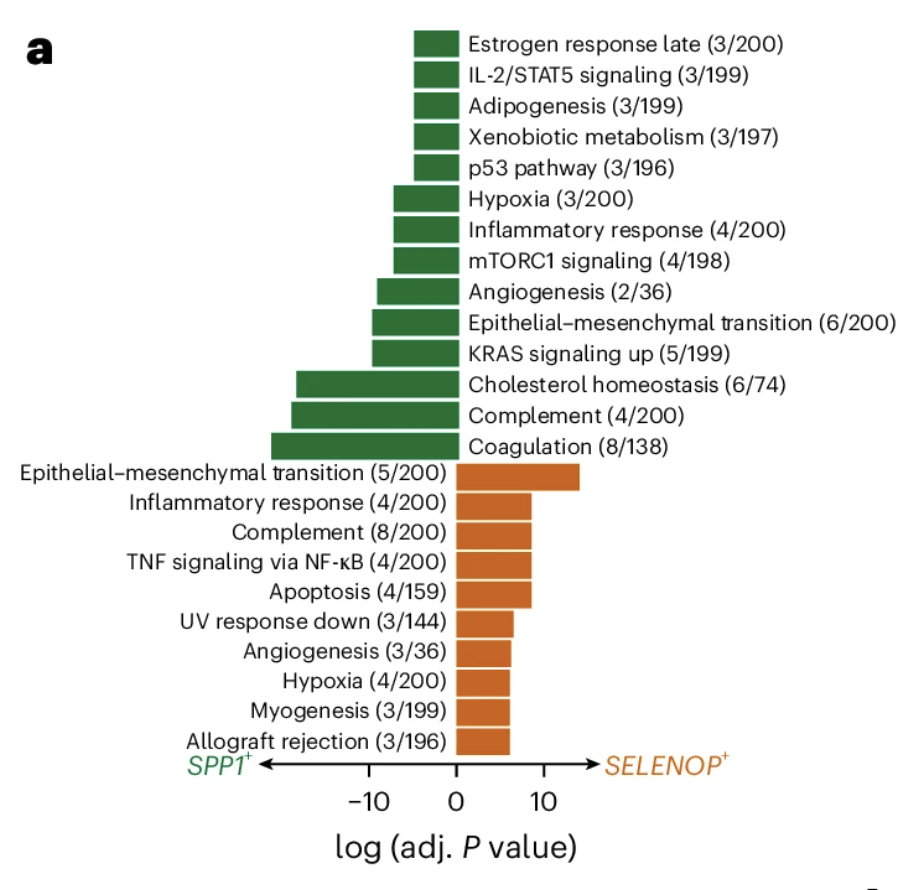
Figure adapted with permission from 10x Genomics.
This figure shows a "bar plot showing the enriched gene sets for the macrophage subpopulations identified. The length of the bar represents the −log10 (adjusted P value) from one-tailed Fisher’s test."
Where to start and how to run this analysis?
A key step is the selection of appropriate annotation databases as the input for analysis: The Molecular Signatures Database (MSigDB) is one of the most popular databases used for pathway analysis and comprises several gene sets for use with the GSEA software. The choice of gene set is dictated by the type of condition in the cluster or cell type.
C5 for gene ontology is the largest and one of the most popular. We demonstrate GSEA on a human colon cancer sample using the cancer gene neighborhoods (CGN) from C4 computational gene sets. It is also possible to generate a curated list from other literature sources to use with these tools.
Example tools include GSEA, enrichR, and clusterProfiler.
What is trajectory analysis for Visium HD?
Trajectory analysis (also known as pseudotime analysis) infers the evolution and differentiation process between cells by analyzing their spatial positions and gene expression levels within tissue sections.
Why should I consider trajectory analysis?
Because sequencing destroys cells, you cannot track a single cell over time. Instead, trajectory analysis assumes that in a large population of cells, some are "early" in a process and others are "late". It computationally orders these cells along a continuum (a "trajectory") to infer their timeline. While single cell data is sufficient to perform this analysis, the use of Visium HD data also provides the spatial context.
What do example result figures look like?
Figure 2b from Pham et al. 2023 is shown below.
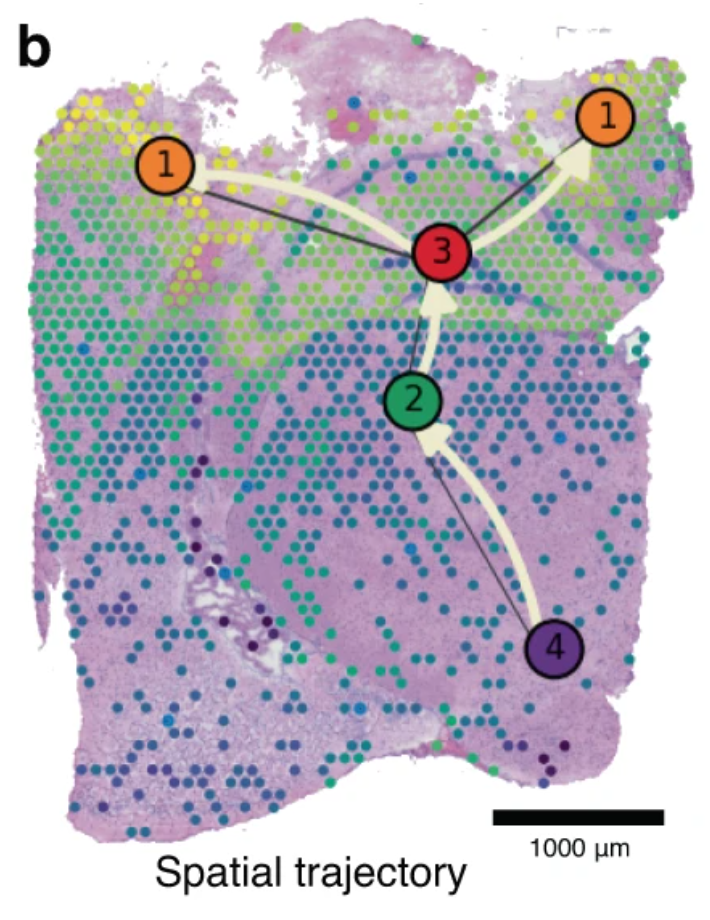
The image has not been modified and is licensed under a Creative Commons Attribution 4.0 International License.
This figure shows "spatio-temporal trajectory of microglial activation at 3 days post-TBI, as predicted by our PSTS algorithm, running from the hypothalamus (node 4), through the thalamus (node 2) and hippocampus (node 3) and then the cortical penumbra regions adjacent to the lesion core (nodes 1). Colour-coded pseudo-time-space values (ranging from 0 to 1) reflect microglia-related gene expression changes through the tissue space."
Figure 6d from Vannan et al. 2024 is shown below.
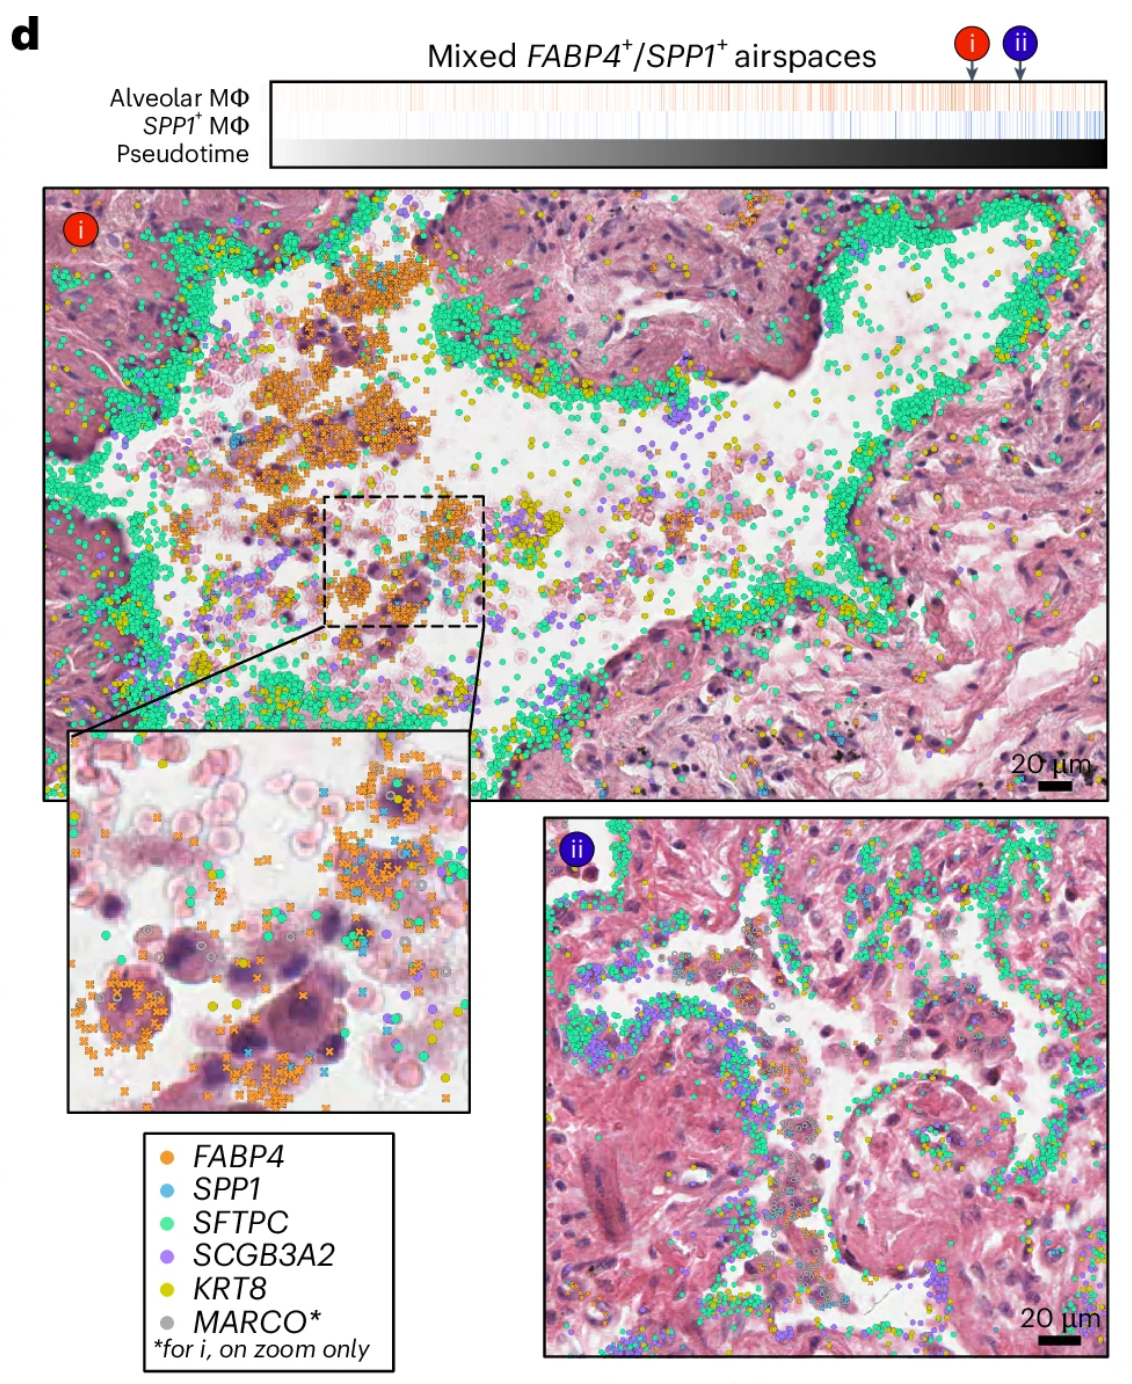
The image has not been modified and is licensed under a Creative Commons Attribution 4.0 International License.
This figure shows "H&E images of mixed alveolar (FABP4+) and SPP1+ macrophage accumulations in two alveoli ranked near the end of the pseudotime trajectory, overlaid with transcript expression for all listed genes. Above the H&Es, each alveolus is marked by its position in pseudotime, and the proportion of alveolar and SPP1+ macrophages is shown for each airspace across pseudotime."
How to run this analysis?
Tools that can perform trajectory analysis include stLearn and SPATA2.
The advent of spatial technologies has enabled a deeper understanding of biology and leveraging the best computational methods to unlock further insights into the data. Understanding the complex spatial relationships between the cells can help further research in many areas, especially with the wide sample-type and tissue-type compatibility of the Visium assays, including the species-agnostic Visium HD 3’ assay. The choice of analyses will ultimately be dictated by the research question, so not every analysis method is applicable to every study.
The list of tools and analysis methods presented in this article is not exhaustive. The landscape of Visium HD data analysis is rapidly evolving. New analysis tools, articles, and resources continue to be announced. We hope this article has given you a glimpse of what is possible with your Visium HD data and we are excited to see the field grow and evolve.